
Rationale and Objectives
The aim of this study was to evaluate the added value of histogram analysis of apparent diffusion coefficient (ADC) maps in differentiating indeterminate orbital malignant tumors from benign tumors, compared to using magnetic resonance (MR) morphological features alone.
Materials and Methods
We retrospectively evaluated 54 patients with orbital tumors from March 2013 to February 2015. All the patients were assessed by both routine MR and diffusion-weighted imaging, and divided into benign group and malignant group. Routine MR imaging features and histogram parameters derived from ADC maps, including mean ADC (ADC mean ), median ADC (ADC median ), standard deviation, skewness, kurtosis, and 10th and 90th percentiles of ADC (ADC 10 and ADC 90 ), were compared between two groups. Univariate and multivariate logistic regression analyses were used to identify the most valuable variables in predicting malignancy. Receiver operating characteristic (ROC) curve analysis was used to determine the diagnostic value of significant variables.
Results
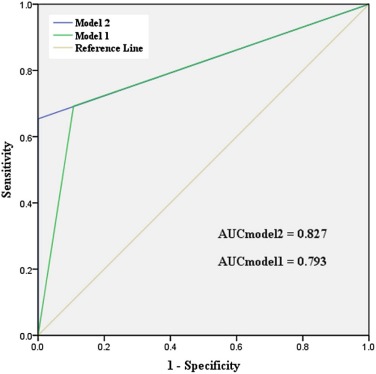
Multivariate logistic regression analysis indicated that two or more quadrants involved, iso-intense on T2-weighted imaging (T2WI), and ADC 10 were significant predictors for orbital malignancy. By using model 2 (iso-intense on T2WI + two or more quadrants involved + ADC 10 < 0.990) as the criterion, higher AUC and specificity could be achieved than by using model 1 (iso-intense on T2WI + two or more quadrants involved) alone, (model 2 vs model 1; area under curve (AUC), 0.827 vs 0.793; sensitivity, 65.4% vs 69.2%; specificity, 100% vs 89.3%).
Conclusions
Iso-intense on T2WI, two or more quadrants involved, and ADC 10 are risk factors for orbital malignancy. Histogram analysis of ADC map might provide added value in predicting orbital malignancy.
Introduction
Orbital space occupying lesions represent a broad spectrum of benign and malignant disease . Accurate differentiation of orbital benign and malignant tumors is very important for the pre-treatment plan . Although viewed as the gold standard, open or fine-needle aspiration biopsy is sometimes technically challenging or not feasible, especially for orbital apex lesions . Therefore, several previous imaging-related studies have tried to use the imaging features of routine computed tomography or magnetic resonance (MR) images to help differentiate malignant orbital tumors from benign mimics . Although some imaging features, including involvement of anterior orbit, irregular shape, ill-defined margin, and iso-intensity on T2-weighted imaging (T2WI), were indicated as potentially discriminating features for the malignant orbital tumors, their overall diagnostic performance was still limited.
Diffusion-weighted imaging (DWI) has been used increasingly to distinguish malignant orbital tumors from benign mimics . Although malignant orbital tumors usually show as high signal intensity on DWI and low apparent diffusion coefficient (ADC) value, the ADC value showed a substantial overlap between benign and malignant orbital tumors, which limited its clinical value for individual patients. Only the mean ADC value was used as the differentiating index in previous studies, which would underestimate the heterogeneity of the tumor, and might be the reason for the obvious overlap. Currently, histogram analysis of the ADC map based on pixel distribution has been proven useful to provide quantitative information about tumor heterogeneity, to differentiate and grade tumors, or to predict the treatment response in various organs . However, to the best of our knowledge, no study to date has applied the histogram analysis of ADC maps in differentiating benign and malignant orbital tumors.
Get Radiology Tree app to read full this article<
Materials and Methods
Study Population
Get Radiology Tree app to read full this article<
Get Radiology Tree app to read full this article<
Table 1
Demographic and Histological Information of Two Groups
Demographic Data Benign Group ( n = 28) Malignant Group ( n = 26)P Value Mean age 44.8 ± 13.5 55.3 ± 16.2 0.012 Gender (F/M) 12/16 12/14 0.808 Diagnosis Inflammatory pseudotumor (9) Lymphoma (18) — Pleomorphic adenoma (8) Adenoid cystic carcinoma (2) Schwannoma (6) Metastases (2) Optic nerve sheath meningioma (4) Basocellular carcinoma (1) Solitary fibrous tumor (1) Lymphoepithelial carcinoma (1) Ewing’s sarcoma (1) Melanoma (1)
F, female; M, male. Data in parentheses indicate the number of the corresponding patients in our study.
Get Radiology Tree app to read full this article<
MRI Techniques
Get Radiology Tree app to read full this article<
Get Radiology Tree app to read full this article<
Imaging Processing
Get Radiology Tree app to read full this article<

Get Radiology Tree app to read full this article<
Get Radiology Tree app to read full this article<
Sb=Sb0×e(b0−b)ADC S
b
=
S
b
0
×
e
(
b
0
−
b
)
ADC
where b and b 0 represent the different diffusion sensitivity coefficients, and S b and S b0 represent the corresponding signal values of the given region of interest (ROI). Typically, b 0 is set to zero such that Equation 1 can be rewritten as Equation 2 :
ADC=−ln(Sb/S0)/b ADC
=
−
ln
(
S
b
/
S
0
)
/
b
Get Radiology Tree app to read full this article<
Get Radiology Tree app to read full this article<
Get Radiology Tree app to read full this article<
Get Radiology Tree app to read full this article<
Statistical Analysis
Get Radiology Tree app to read full this article<
Get Radiology Tree app to read full this article<
Results
Get Radiology Tree app to read full this article<
Get Radiology Tree app to read full this article<
Table 2
Frequency Distribution of Qualitative MR Imaging Features for Reader 1 and Inter-Reader Agreement
Parameters Benign ( n = 28) Malignant ( n = 26)P Value_Κ_ Value Laterality 0.413 0.945 Unilateral 26 22 Bilateral 2 4 Shape 0.001 0.811 Irregular 14 24 Regular 14 2 Margin 0.006 0.687 Well defined 21 9 Ill defined 7 17 Location 0.019 0.744 Intraconal 16 22 Extraconal 6 21 Anterior orbit preseptal 3 21 Lacrimal fossa 10 12 No. of involved quadrants 0.004 0.732 One 17 5 Two or more 11 21 Signal intensity on T1WI 0.470 0.675 Low 6 3 Iso 22 22 High 0 1 Signal intensity on T2WI <0.001 0.789 Low 0 1 Iso 6 24 High 22 1 T1WI signal homogeneity 0.264 0.701 Homogeneous 16 19 Heterogeneous 12 7 T2WI signal homogeneity <0.001 0.776 Homogeneous 11 20 Heterogeneous 17 6 Enhancement homogeneity 0.014 0.694 Homogeneous 10 18 Heterogeneous 18 8
MR, magnetic resonance; T1WI, T1-weighted imaging; T2WI, T2-weighted imaging.
The signal intensity on T1 and T2-weighted imaging was compared to extraocular muscle.
Table 3
Difference of Histogram Parameters between Benign and Malignant Orbital Tumors
Parameters Benign Group Malignant Group_t_ Value_P_ Value ADC mean 1.985 ± 0.398 0.810 ± 0.297 12.222 <0.001 SD 0.314 ± 0.116 0.206 ± 0.090 3.820 <0.001 ADC median 1.928 ± 0.398 0.769 ± 0.241 13.046 <0.001 ADC 10 1.625 ± 0.346 0.567 ± 0.230 13.126 <0.001 ADC 90 2.388 ± 0.487 1.028 ± 0.285 12.393 <0.001 Kurtosis 0.255 ± 0.783 2.036 ± 3.021 −2.917 0.007 Skewness 0.614 ± 0.528 0.623 ± 0.926 −0.046 0.964
ADC, apparent diffusion coefficient; ADC n , nth percentile value of cumulative ADC histogram; SD, standard deviation.
Except P value, data are reported as mean ± SD. The unit for ADC value is ×10 −3 mm 2 /s.
Get Radiology Tree app to read full this article<
Get Radiology Tree app to read full this article<
Table 4
Multivariate Logistic Regression Results for Predicting Orbital Malignant Tumor
Parameters β Coefficient SE Odds Ratio_P_ Value ADC 10 −66.055 11,108.376 0.000 <0.001 Iso-intense on T2WI 55.668 42,092.053 0.000 <0.001 Two or more quadrants involved 2.202 10,274.596 9.043 <0.001
ADC, apparent diffusion coefficient; SE, standard error; T2WI, T2-weighted imaging.

Get Radiology Tree app to read full this article<
Get Radiology Tree app to read full this article<
Get Radiology Tree app to read full this article<
Get Radiology Tree app to read full this article<
Table 5
Inter- and Intra-Reader ICCs for Measurements of Histogram Parameters
Parameter Inter-Reader ICC Intra-Reader ICC ADC Mean 0.892 (0.794–0.941) 0.911 (0.805–0.955) SD 0.848 (0.747–0.895) 0.883 (0.755–0.948) ADC Median 0.886 (0.781–0.935) 0.910 (0.801–0.947) ADC 10 0.883 (0.754–0.933) 0.905 (0.793–0.951) ADC 90 0.876 (0.742–0.916) 0.899 (0.809–0.956) Kurtosis 0.844 (0.746–0.898) 0.877 (0.753–0.937) Skewness 0.838 (0.722–0.887) 0.854 (0.739–0.897)
ADC, apparent diffusion coefficient; ADC n , nth percentile value of cumulative ADC histogram; ICC, intra-class correlation coefficient; SD, standard deviation.
Data in parentheses are 95% confidence intervals.
Get Radiology Tree app to read full this article<
Discussion
Get Radiology Tree app to read full this article<
Get Radiology Tree app to read full this article<
Get Radiology Tree app to read full this article<
Get Radiology Tree app to read full this article<
Get Radiology Tree app to read full this article<
Get Radiology Tree app to read full this article<
Get Radiology Tree app to read full this article<
Get Radiology Tree app to read full this article<
References
1. Sepahdari A.R., Aakalu V.K., Setabutr P., et. al.: Indeterminate orbital masses: restricted diffusion at MR imaging with echo-planar diffusion-weighted imaging predicts malignancy. Radiology 2010; 256: pp. 554-564.
2. Goh P.S., Gi M.T., Charlton A., et. al.: Review of orbital imaging. Eur J Radiol 2008; 66: pp. 387-395.
3. Ben Simon G.J., Annunziata C.C., Fink J., et. al.: Rethinking orbital imaging establishing guidelines for interpreting orbital imaging studies and evaluating their predictive value in patients with orbital tumors. Ophthalmology 2005; 112: pp. 2196-2207.
4. Xian J., Zhang Z., Wang Z., et. al.: Value of MR imaging in the differentiation of benign and malignant orbital tumors in adults. Eur Radiol 2010; 20: pp. 1692-1702.
5. Politi L.S., Forghani R., Godi C., et. al.: ocular adnexal lymphoma: diffusion-weighted MR imaging for differential diagnosis and therapeutic monitoring. Radiology 2010; 256: pp. 565-574.
6. Sepahdari A.R., Kapur R., Aakalu V.K., et. al.: Diffusion-weighted imaging of malignant ocular masses: initial results and directions for further study. AJNR Am J Neuroradiol 2012; 33: pp. 314-319.
7. Lope L.A., Hutcheson K.A., Khademian Z.P.: Magnetic resonance imaging in the analysis of pediatric orbital tumors: utility of diffusion-weighted imaging. J AAPOS 2010; 14: pp. 257-262.
8. Razek A.A., Elkhamary S., Mousa A.: Differentiation between benign and malignant orbital tumors at 3-T diffusion MR imaging. Neuroradiology 2011; 53: pp. 517-522.
9. Ahn S.J., Choi S.H., Kim Y.J., et. al.: Histogram analysis of apparent diffusion coefficient map of standard and high B-value diffusion MR imaging in head and neck squamous cell carcinoma: a correlation study with histological grade. Acad Radiol 2012; 19: pp. 1233-1240.
10. Suo S.T., Chen X.X., Fan Y., et. al.: Histogram analysis of apparent diffusion coefficient at 3.0 T in urinary bladder lesions: correlation with pathologic findings. Acad Radiol 2014; 21: pp. 1027-1034.
11. Ma X., Zhao X., Ouyang H., et. al.: Quantified ADC histogram analysis: a new method for differentiating mass-forming focal pancreatitis from pancreatic cancer. Acta Radiol 2014; 55: pp. 785-792.
12. Ryu Y.J., Choi S.H., Park S.J., et. al.: Glioma: application of whole-tumor texture analysis of diffusion-weighted imaging for the evaluation of tumor heterogeneity. PLoS ONE 2014; 9: pp. e108335.
13. Woo S., Cho J.Y., Kim S.Y., et. al.: Histogram analysis of apparent diffusion coefficient map of diffusion-weighted MRI in endometrial cancer: a preliminary correlation study with histological grade. Acta Radiol 2014; 55: pp. 1270-1277.
14. Cho S.H., Kim G.C., Jang Y.J., et. al.: Locally advanced rectal cancer: post-chemoradiotherapy ADC histogram analysis for predicting a complete response. Acta Radiol 2015; 56: pp. 1042-1050.
15. Zhang Y.D., Wang Q., Wu C.J., et. al.: The histogram analysis of diffusion-weighted Intravoxel Incoherent Motion (IVIM) imaging for differentiating the gleason grade of prostate cancer. Eur Radiol 2015; 25: pp. 994-1004.
16. Kang Y., Choi S.H., Kim Y.J., et. al.: Gliomas: histogram analysis of apparent diffusion coefficient maps with standard- or high-b-value diffusion-weighted MR imaging—correlation with tumor grade. Radiology 2011; 261: pp. 882-890.
17. Lu S.S., Kim S.J., Kim N., et. al.: Histogram analysis of apparent diffusion coefficient maps for differentiating primary CNS lymphomas from tumefactive demyelinating lesions. AJR Am J Roentgenol 2015; 204: pp. 827-834.
18. Priego G., Majos C., Climent F., et. al.: Orbital lymphoma: imaging features and differential diagnosis. Insights Imaging 2012; 3: pp. 3337-3344.
19. Tailor T.D., Gupta D., Dalley R.W., et. al.: Orbital neoplasms in adults: clinical, radiologic, and pathologic review. Radiographics 2013; 33: pp. 1739-1758.
20. Suh C.H., Kim H.S., Lee S.S., et. al.: Atypical imaging features of primary central nervous system lymphoma that mimics glioblastoma: utility of intravoxel incoherent motion MR imaging. Radiology 2014; 272: pp. 504-513.
21. Yuan Y., Kuai X.P., Chen X.S., et. al.: Assessment of dynamic contrast-enhanced magnetic resonance imaging in the differentiation of malignant from benign orbital masses. Eur J Radiol 2013; 82: pp. 1506-1511.