
Rationale and Objectives
Cartilage loss as determined by magnetic resonance imaging (MRI) or joint space narrowing as determined by x-ray is the result of cartilage erosion. However, metabolic processes within the cartilage that later result in cartilage loss may be a more sensitive assessment method for early changes. Recently, it was shown that cartilage homogeneity visualized by MRI representing the biochemical changes undergoing in the cartilage is a potential marker for early detection of knee osteoarthritis (OA) and is also able to significantly separate groups of healthy subjects from those with OA. The purpose of this study was twofold. First, we wished to evaluate whether the results on cartilage homogeneity from the previous study can be reproduced using an independent population. Second, based on the homogeneity framework, we present an automatic technique that partitions the region of interest in the cartilage that contributes most to discrimination between healthy and OA subjects and allows for identification of the most implicated areas in early OA. These findings may allow further investigation of whether cartilage homogeneity reveals a predisposition for OA or whether it evolves as a consequence to disease and thereby can be used as a progression biomarker.
Materials and Methods
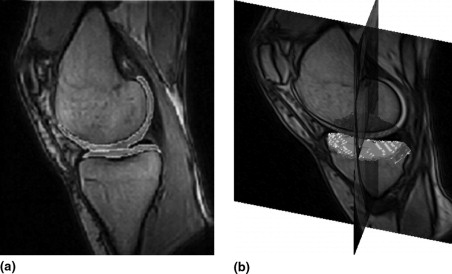
A total of 283 right and left knees from 159 subjects aged 21 to 81 years were scanned using a Turbo 3D T1 sequence on a 0.18-T MRI Esaote scanner. The medial compartment of the tibial cartilage sheet was segmented using a fully automatic voxel classification scheme based on supervised learning. From the segmented cartilage sheet, homogeneity was quantified by measuring entropy from the distribution of signal intensities inside the compartment. Each knee was examined by radiography, and the knees were categorized by the Kellgren and Lawrence (KL) Index. Next, based on a gradient descent optimization technique, the cartilage region that contributed to the maximum statistical significance of homogeneity in separating healthy subjects from the diseased was partitioned. The generalizability of the region was evaluated by testing for overfitting. Three different regularization techniques were evaluated for reducing overfitting errors.
Results
The P values for separating the different groups based on cartilage homogeneity were 2 × 10 −5 (KL 0 versus KL 1) and 1 × 10 −7 (KL 0 versus KL >0). Using the automatic gradient descent technique, the partitioned region was toward the peripheral part of the cartilage sheet. Using this region, the P values for separating the different groups based on homogeneity were 5 × 10 −9 (KL 0 versus KL 1) and 1 × 10 −15 (KL 0 versus KL >0). The precision of homogeneity for the partitioned region assessed as a test-retest root-mean-square coefficient of variation was 3.3%. Bootstrapping proved to be an effective regularization tool in reducing overfitting errors.
Conclusion
The validation study supported the use of cartilage homogeneity as a tool for the early detection of knee OA and for separating groups of healthy subjects from those who have disease. Our automatic, unbiased partitioning algorithm based on a general statistical framework outlined the cartilage region of interest that best separated healthy from OA conditions on the basis of homogeneity discrimination. We have shown that OA affects certain areas of the cartilage more distinctly, and these areas are located more toward the peripheral region of the cartilage. We propose that this region corresponds anatomically to cartilage covered by the meniscus in healthy subjects. This finding may provide valuable clues in the early detection and monitoring of OA and thus may improve treatment efficacy.
Osteoarthritis (OA) is a degenerative joint disease that is a major cause of disability. Degeneration of the articular cartilage in combination with an altered subchondral compartment are key features of OA ( ). In terms of quality of life and chronic disability, OA is second only to cardiovascular diseases ( ). It is estimated that more than one-third of the population above the age of 35 will at some point in their lives experience OA ( ). At present, there are no accepted treatments for OA as no drugs have been consistently shown to modify joint structure or even reverse joint pathology in face of the currently available treatments that are directed toward relief of symptoms ( ). Because the prevalence of OA increases with age, the increasing life span will increase the socioeconomic impact of OA. Radiographic evidence of knee OA, the most commonly affected weight-bearing joint, can be found in one-third of those above the age of 63 ( ). Research is ongoing to discover disease-modifying antiosteoarthritis drugs/agents (DMOADs) ( ). However, to assess the effectiveness of DMOADs, quantifications of the structural changes undergoing in the cartilage during the early stages of the disease is needed and for that early diagnosis of OA is essential, both for early identification as well as for monitoring of response to treatment in the development of novel interventions for OA.
The currently accepted standard for monitoring progression in knee OA is measurement of the joint space width (JSW) (between the femur and tibia on the knee joint) from radiographs ( ). This is an indirect evaluation as the cartilage is not visible on radiographs, and it is potentially prone to diagnosing the disease relatively late in its course ( ). A second technique available for detecting OA is arthroscopy—which, even though invasive, does not permit visualization of internal cartilage abnormalities. Recently, magnetic resonance imaging (MRI) has received much attention in assessment of the articular cartilage. This can be primarily attributed to the facts that MRI is noninvasive and provides good soft tissue contrast and high spatial resolution; moreover, the articular cartilage can be directly visualized and quantified from the MR scans ( ). This provides valuable information with regard to morphological, and possibly biochemical, parameters that may be associated with the integrity of the articular cartilage. Quantitative measurements from MRI like cartilage volume and thickness measures are now widely used to monitor progression of OA ( ).
Get Radiology Tree app to read full this article<
Get Radiology Tree app to read full this article<
Get Radiology Tree app to read full this article<
Get Radiology Tree app to read full this article<
Get Radiology Tree app to read full this article<
Materials and methods
Population
Get Radiology Tree app to read full this article<
Get Radiology Tree app to read full this article<
Get Radiology Tree app to read full this article<
Table 1
Characteristics of the Evaluation Set (283 Knees and 159 Participants)
Factor KL 0 KL 1 KL 2 KL 3 KL 4 No, of knees ( K ) 140 87 31 24 1 Age (yr) 48.0 ± 16.7 62.7 ± 11.3 65.9 ± 7.4 67.4 ± 4.8 72.7 Females 46% 54% 48% 42% 100% Weight (kg) 75.3 ± 13.7 76.3 ± 13.6 84.7 ± 14.6 82.5 ± 11.6 84.8 Height (m) 1.73 ± 0.09 1.7 ± 0.09 1.69 ± 0.09 1.7 ± 0.1 1.66 BMI (kg/m 2 ) 25.1 ± 4.0 26.4 ± 4.1 29.4 ± 3.7 28.8 ± 3.6 30.7
⁎ Unless otherwise indicated, values are given in mean ± SD. KL refers to the Kellgren and Lawrence index.
Get Radiology Tree app to read full this article<
Get Radiology Tree app to read full this article<
Get Radiology Tree app to read full this article<
Imaging Protocol
Get Radiology Tree app to read full this article<
Get Radiology Tree app to read full this article<
Get Radiology Tree app to read full this article<
Automatic Cartilage Segmentation
Get Radiology Tree app to read full this article<
Get Radiology Tree app to read full this article<
Quantification of Homogeneity
Get Radiology Tree app to read full this article<
Get Radiology Tree app to read full this article<
Get Radiology Tree app to read full this article<
E=−∑B−1i=0Hilog(Hi) E
=
−
∑
i
=
0
B
−
1
H
i
log
(
H
i
)
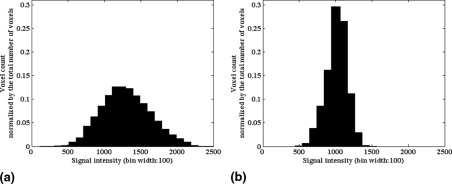
Entropy quantifies cartilage with fewer, more dominant intensities as being more homogeneous. In the extreme, the most homogeneous distribution will only have a single intensity present, such a histogram can be described with very little information and therefore has minimal information content and minimal entropy value. In contrast, the higher the entropy value, the more heterogeneous the cartilage will be. As an example, Figure 2 shows the histograms of knee cartilage with highest entropy as well as with the lowest entropy in the dataset. When assessing the information content, the specific intensities and their ordering in the histogram are irrelevant. The entropy value depends on whether many infrequent intensities are present (heterogeneous, high entropy) or whether relatively few frequent intensities are dominant (homogeneous, low entropy). Thereby, unlike a simpler, homogeneity-like measure like intensity standard deviation, entropy is not assuming that the intensity values follow a Gaussian distribution. Due to both the noise properties of MRI [that results in a Rician distribution ( )] and partial volume effects, a Gaussian assumption is wrong.
Get Radiology Tree app to read full this article<
Statistical Analysis
Get Radiology Tree app to read full this article<
Cartilage Region Partitioning
Get Radiology Tree app to read full this article<
Get Radiology Tree app to read full this article<
Get Radiology Tree app to read full this article<
Get Radiology Tree app to read full this article<
Get Radiology Tree app to read full this article<
Get Radiology Tree app to read full this article<
Get Radiology Tree app to read full this article<
Get Radiology Tree app to read full this article<
Get Radiology Tree app to read full this article<
Get Radiology Tree app to read full this article<
Get Radiology Tree app to read full this article<
Get Radiology Tree app to read full this article<
Results
Cartilage Volume and Homogeneity
Get Radiology Tree app to read full this article<
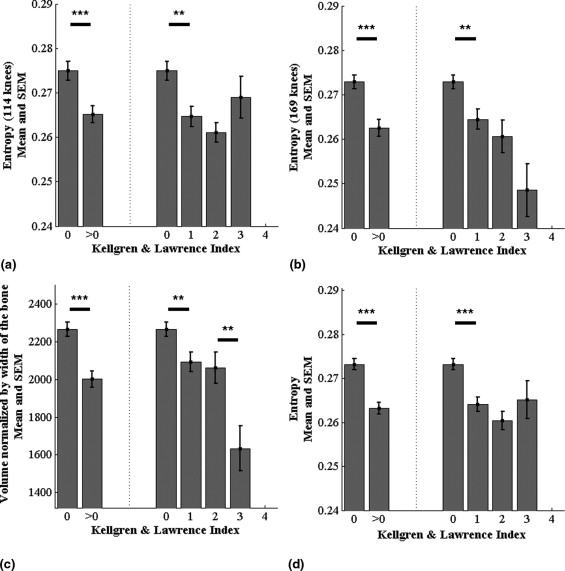
Table 2
P Values for Separating Groups of KL 0 from KL 1 and Groups of KL 0 from KL >0 Based on the Two Different Measures
Type Entropy (114 Knees) Entropy (169 Knees) Volume (283 Knees) Entropy (283 Knees) Entropy (Partitioned) (283 Knees) KL 0 versus KL 1 3 × 10 −3 2 × 10 −3 6 × 10 −3 2 × 10 −5 5 × 10 −9 KL 0 versus KL >0 8 × 10 −4 4 × 10 −5 7 × 10 −6 1 × 10 −7 1 × 10 −15
The first two columns of the table list the P values for the old dataset of 114 knees and the new dataset of 169 knees, respectively. The table also lists the P value for the partition region from Figure 6 .
Get Radiology Tree app to read full this article<
Get Radiology Tree app to read full this article<
Get Radiology Tree app to read full this article<
Get Radiology Tree app to read full this article<
Get Radiology Tree app to read full this article<
Cartilage Partitioning
Get Radiology Tree app to read full this article<
Table 3
Generalizability Evaluation of the Partitioning Algorithm without Regularization and with Bootstrap Regularization (Last Row)
Resolution 1 2 3 Train Test Train Test Train Test 5 × 5 3 × 10 −6 9 × 10 −7 1 × 10 −5 1 × 10 −6 4 × 10 −5 4 × 10 −7 10 × 20 7 × 10 −8 5 × 10 −7 9 × 10 −9 5 × 10 −9 1 × 10 −9 8 × 10 −7 80 × 140 1 × 10 −12 1 × 10 −6 1 × 10 −15 1 × 10 −5 3 × 10 −15 4 × 10 −4 Bootstrap regularization (80 × 140) 4 × 10 −8 7 × 10 −9 4 × 10 −8 5 × 10 −9 5 × 10 −9 7 × 10 −8
The P values are given for three different random trials (141 knees in each set).
Get Radiology Tree app to read full this article<
Get Radiology Tree app to read full this article<
Get Radiology Tree app to read full this article<
Get Radiology Tree app to read full this article<
Table 4
Bootstrap Regularization Using the Vote Map
Type_P_ Value Whole cartilage .0002 Regularized .000009
P values for the evaluation set of 142 knees. Even after regularization the significance level is still higher than using the whole cartilage as one single region.
Get Radiology Tree app to read full this article<
Get Radiology Tree app to read full this article<
Discussion
Get Radiology Tree app to read full this article<
Get Radiology Tree app to read full this article<
Get Radiology Tree app to read full this article<
Get Radiology Tree app to read full this article<
Get Radiology Tree app to read full this article<
Get Radiology Tree app to read full this article<
Get Radiology Tree app to read full this article<
Conclusion
Get Radiology Tree app to read full this article<
References
1. Ding C., Garnero P., Cicuttini F., Scott F., Cooley H., Jones G.: Knee cartilage defects: Association with early radiographic osteoarthritis, decreased cartilage volume, increased joint surface area and type II collagen breakdown. Osteoarthr Cartil 2005; 13: pp. 198-205.
2. Conaghan P.G., Felson D., Gold G., Lohmander S., Totterman S., Altman R.: MRI and non-cartilaginous structures in knee osteoarthritis. Osteoarthr Cartil 2006; 14: pp. A87-A94.
3. Haq I., Murphy E., Dacre J.: Osteoarthritis. Postgrad Med J 2003; 79: pp. 377-383.
4. McCauley T.R., Disler D.G.: MR imaging of the articular cartilage. Radiology 1998; 209: pp. 629-640.
5. Altman R.D.: Measurement of structure (disease) modification in osteoarthritis. Osteoarthr Cartil 2004; 12: pp. S69-S76.
6. Felson D.T., Naimark A., Anderson J.J., Kazis L., Castelli W., Meenan R.F.: The prevalence of knee osteoarthritis in the elderly: The Framingham Osteoarthritis Study. Arthritis Rheum 1987; 30: pp. 914-918.
7. Abadie E., Ethgen D., Avouac B., et. al.: Recommendations for the use of new methods to assess the efficacy of disease-modifying drugs in the treatment of osteoarthritis. Osteoarthr Cartil 2004; 12: pp. 263-268.
8. Altman R.D., Brandt K., Hochberg M., et. al.: Design and conduct of clinical trials in patients with osteoarthritis: Recommendations from a task force of the Osteoarthritis Research Society International. Osteoarthr Cartil 1996; 4: pp. 217-243.
9. Calvo E., Palacios I., Delgado E., et. al.: High-resolution MRI detects cartilage swelling at the early stages of experimental osteoarthritis. Osteoarthr Cartil 2001; 9: pp. 463-472.
10. Eckstein F., Cicuttini F., Raynauld J.P., Waterton J.C., Peterfy C.: Magnetic resonance imaging (MRI) of articular cartilage in knee osteoarthritis (OA): Morphological assessment. Osteoarthr Cartil 2006; 14: pp. A46-A75.
11. Pessis E., Drape J.L., Ravaud P., Chevrot A., Dougados M., Ayral X.: Assessment of progression in knee osteoarthritis: Results of a 1 year study comparing arthroscopy and MRI. Osteoarthr Cartil 2003; 11: pp. 361-369.
12. Folkesson J., Dam E.B., Olsen O.F., Pettersen P., Christiansen C.: Segmenting articular cartilage automatically using a voxel classification scheme. IEEE Trans Med Imaging 2007; 26: pp. 106-115.
13. Pakin S.K., Tamez-Pena J.G., Totterman S., Parker K.J.: Segmentation, surface extraction and thickness computation of articular cartilage. SPIE Med Imaging 2002; 4684: pp. 155-166.
14. Solloway S., Hutchinson C., Waterton J.C., Taylor C.J.: The use of active shape models for making thickness measurements of articular cartilage from MR images. Magn Reson Med 1997; 37: pp. 943-952.
15. Dam E.B., Folkesson J., Pettersen P., Christiansen C.: Automatic cartilage thickness quantification using a statistical shape model.Dam E.Majumdar S.Buckland-Wright J.C.MICCAI Joint Disease Workshop.2006.pp. 42-49.
16. Buckland-Wright C.: Subchondral bone changes in hand and knee osteoarthritis detected by radiography. Osteoarthr Cartil 2004; 12: pp. A10-A19.
17. Kellgren J.H., Lawrence J.S.: Radiological assessment of osteoarthritis. Ann Rheum Dis 1957; 16: pp. 494-501.
18. AlHadlaq H.A., Xia Y., Moody J.B., Matyas J.R.: Detecting structural changes in early experimental osteoarthritis of tibial cartilage by microscopic magnetic resonance imaging and polarised light microscopy. Ann Rheum Dis 2004; 63: pp. 709-717.
19. Maiotti M., Monteleone G., Tarantino U., Fasciglione G.F., Marini S., Coletta M.: Correlation between osteoarthritic cartilage damage and levels of proteinases and proteinase inhibitors in synovial fluid from the knee joint. Arthroscopy 2000; 16: pp. 522-526.
20. Calvo E., Palacios I., Delgado E., et. al.: Histopathological correlation of cartilage swelling detected by magnetic resonance imaging in early experimental osteoarthritis. Osteoarthr Cartil 2004; 12: pp. 878-886.
21. Qazi A.A., Olsen O.F., Dam E.B., Folkesson J., Pettersen P., Christiansen C.: Automatic quantification of knee cartilage homogeneity.Dam E.Majumdar S.Buckland-Wright J.C.MICCAI Joint Disease Workshop.2006.pp. 51-58.
22. Biswal S., Hastie T., Andriacchi T.P., Bergman G.A., Dillingham M.F., Lang P.: Risk factors for progressive cartilage loss in the knee: A longitudinal magnetic resonance imaging study in forty-three patients. Arthritis Rheum 2002; 46: pp. 2884-2992.
23. Amin S., LaValley M.P., Guermazi A., Grigoryan M., Hunter D.J., Clancy M.: The relationship between cartilage loss on magnetic resonance imaging and radiographic progression in men and women with knee osteoarthritis. Arthr Rheum 2005; 52: pp. 3152-3159.
24. Koo S., Gold G.E., Andriacchi T.P.: Considerations in measuring cartilage thickness using MRI: Factors influencing reproducibility and accuracy. Osteoarthr Cartil 2005; 13: pp. 782-789.
25. Dunn T., Lu Y., Jin H., Ries M., Majumdar S.: T2 relaxation time of cartilage at mr imaging: Comparison with severity of knee osteoarthritis. Radiology 2004; 232: pp. 592-598.
26. Folkesson J., Dam E.B., Olsen O.F., Pettersen P., Christiansen C.: Position normalization in automatic cartilage segmentation.Dam E.Majumdar S.Buckland-Wright J.C.MICCAI Joint Disease Workshop.2006.pp. 9-16.
27. Dam E.B., Folkesson J., Loog M., Pettersen P., Christiansen C.: Efficient automatic cartilage segmentation.Dam E.Majumdar S.Buckland-Wright J.C.MICCAI Joint Disease Workshop.2006.pp. 88-95.
28. Shannon C.E.: A mathematical theory of communication. Bell System Technical J 1948; 27: pp. 379-423.
29. Freedman D., Diaconis P.: On the histogram as a density estimator: L 2 theory. Prob Theory Relat Fields 1981; 57: pp. 453-476.
30. Gudbjartsson H., Patz S.: The Rician distribution of noisy MRI data. Magn Reson Med 1995; 34: pp. 910-914.
31. Cao F.: Geometric Curve Evolution and Image Processing (lecture notes in mathematics).2003.SpringerNew York
32. Gonzalez R.C., Woods R.E.: Digital Image Processing.2002.Prentice HallNew York:
33. Efron B., Tibshirani R.J.: An Introduction to the Bootstrap.1993.Chapman and HallLondon
34. Gluer C.C., Blake G., Lu Y., Blunt B.A., Jergas M., Genant H.K.: Accurate assessment of precision errors: How to measure the reproducibility of bone densitometry techniques. Osteoporosis Int 1995; 5: pp. 262-270.
35. Braunstein E.M., Brandt K.D., Albrecht M.: MRI demonstration of hypertrophic articular cartilage repair in osteoarthritis. Skelet Radiol 1990; 19: pp. 335-339.
36. Adams M.E., Brandt K.D.: Hypertrophic repair of canine articular cartilage in osteoarthritis after anterior cruciate ligament transection. Rheumatology 1991; 18: pp. 428-435.
37. Myers S.L., Brandt K.D., O’Connor B.L., Visco D.M., Albrecht M.E.: Synovitis and osteoarthritic changes in canine articular cartilage after anterior cruciate ligament transection. Arthritis Rheum 1990; 33: pp. 1406-1415.
38. Jeffrey D.R., Watt I.: Imaging hyaline cartilage. Br J Radiol 2003; 76: pp. 777-787.
39. Hollander A.P., Heathfield T.F., Webber C., et. al.: Increased damage to type II collagen in osteoarthritic articular cartilage detected by a new immunoassay. Clin Investig 1994; 93: pp. 1722-1732.
40. Disler D.G., Recht M.P., McCauley T.R.: MR imaging of articular cartilage. Skelet Radiol 2000; 29:
41. Messner K., Gao J.: The menisci of the knee joint. J Anat 1998; 193: pp. 161-178.
42. Bennett L.D., Buckland-Wright J.C.: Meniscal and articular cartilage changes in knee osteoarthritis: A cross-sectional double-contrast macroradiographic study. Rheumatology 2002; 41: pp. 917-923.
43. Berthiaume M.J., Raynauld J.P., Martel-Pelletier J., Labonté F., Beaudoin G., Bloch D.A.: Meniscal tear and extrusion are strongly associated with progression of symptomatic knee osteoarthritis as assessed by quantitative magnetic resonance imaging. Ann Rheum Dis 2005; 64: pp. 556-563.
44. Hunter D.J., Zhang Y.Q., Niu J.B., et. al.: The association of meniscal pathologic changes with cartilage loss in symptomatic knee osteoarthritis. Arthritis Rheum 2006; 54: pp. 795-801.
45. Thambyah A., Nather A., Goh J.: Mechanical properties of articular cartilage covered by the meniscus. Osteoarthr Cartil 2006; 14: pp. 580-588.