
Rationale and Objectives
To evaluate paired inspiratory/expiratory computed tomography (CT; iCT/eCT) and deformable image registration for quantitative and qualitative assessment of airflow limitation in smokers.
Materials and Methods
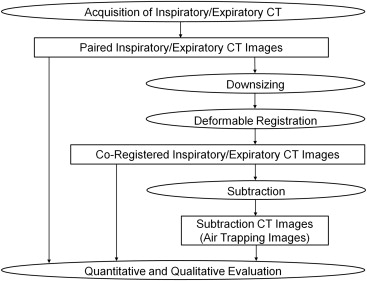
Paired iCT/eCT images acquired from 35 smokers (30 men and 5 women) were coregistered and subtraction images (air trapping CT images [aCT]) generated. To evaluate emphysema quantitatively, the percentage of low-attenuation volume (LAV%) on iCT was calculated at −950 HU, as were mean and kurtosis on aCT for quantitative assessment of air trapping. Parametric response maps of emphysema (PRMe) and of functional small airways disease (PRMs) were also obtained. For qualitative evaluation of emphysema, low-attenuation areas on iCT were scored by consensus of two radiologists using Goddard classification. To assess air trapping qualitatively, the degree of air trapping on aCT was scored. For each quantitative and qualitative index, the Spearman rank correlation coefficient for forced expiratory flow in 1 second was calculated, and differences in correlation coefficients were statistically tested.
Results
The correlation coefficients for the indices were as follows: mean on aCT, 0.800; kurtosis on aCT, −0.726; LAV%, −0.472; PRMe, −0.570; PRMs, −0.565; addition of PRMe and PRMs, −0.653; emphysema score, −0.502; air trapping score, −0.793. The indices showing significant differences were as follows: mean on aCT and addition of PRMe and PRMs ( P = 1.43 × 10 −8 ); air trapping score and emphysema score ( P = .0169).
Conclusions
Air trapping images yielded more accurate quantitative and qualitative evaluation of airflow limitation than did LAV%, PRMe, PRMs, and Goddard classification.
Chronic obstructive pulmonary disease (COPD) is characterized by chronic and progressive airflow limitation that is not fully reversible . According to a projection made in 2002, COPD is expected to become the fourth leading cause of death in the world by 2030 . Moreover, COPD is the only one with a steadily rising prevalence among the four major causes of mortality: cardiovascular disease, malignant neoplasm, cerebrovascular disease, and COPD .
Airflow limitation in COPD is caused by lung parenchymal destruction (emphysema) and small airways disease. Contributions of these two components to airflow limitation vary substantially from patient to patient, thus potentially affecting clinical presentation, disease severity, and therapeutic response . Furthermore, separate assessment of emphysema and small airways disease provides valuable information regarding disease heterogeneity for identification of COPD phenotypes .
Get Radiology Tree app to read full this article<
Get Radiology Tree app to read full this article<
Materials and methods
Get Radiology Tree app to read full this article<
Patients
Get Radiology Tree app to read full this article<
Pulmonary Function Test
Get Radiology Tree app to read full this article<
CT Scan Acquisition
Get Radiology Tree app to read full this article<
Deformable Image Registration
Get Radiology Tree app to read full this article<
Get Radiology Tree app to read full this article<
Get Radiology Tree app to read full this article<
Quantitative and Qualitative Evaluation
Get Radiology Tree app to read full this article<
density=1000+CT1000, density
=
1000
+
CT
1000
,
where CT is the CT attenuation of a lung voxel. They also showed that lung inflation (mL/g) could be calculated with the Equation (2) :
lunginflation=specificvolume−0.939, lung
inflation
=
specific
volume
−
0.939
,
where specific volume is the inverse value of density. Using Equations (1) and (2) and coregistered inspiratory/expiratory CT, the difference in lung inflation (mL/g) between inspiration and expiration can be calculated as Equation (3) :
differenceinlunginflation=10001000+CTi−10001000+CTe, difference
in
lung
inflation
=
1000
1000
+
CTi
−
1000
1000
+
CTe
,
where CTi and CTe are CT attenuation of lung voxels in co-registered inspiratory/expiratory CT. The Equation (3) can be converted to the Equation (4) :
differenceinlunginflation=1000×(CTe−CTi)(1000+CTi)×(1000+CTe). difference
in
lung
inflation
=
1000
×
(
CTe
−
CTi
)
(
1000
+
CTi
)
×
(
1000
+
CTe
)
.
The last equation clearly shows that the difference in CT attenuation between coregistered inspiratory and expiratory CT is directly related to the difference in lung inflation although the relationship is nonlinear. For this reason, we hereafter refer to subtraction CT images as air trapping images because of their potential to reflect the air trapping caused by small airways disease.
Get Radiology Tree app to read full this article<
Get Radiology Tree app to read full this article<
Get Radiology Tree app to read full this article<
Statistical Analysis
Get Radiology Tree app to read full this article<
Results
Get Radiology Tree app to read full this article<
Table 1
Summary of Pulmonary Function Test Results
Measure Median Interquartile Range Range VC (%) 92.6 84.5–102.9 60.1–114.9 RV (%) 108.5 90.9–129.8 59.2–237.9 FEV 1 /FVC (%) 59.7 51.2–67.2 32.7–79.4 FEV 1 (%) 66.7 53.2–78.7 18.3–109.4 DL CO (%) 65.5 53.7–81.6 20.2–109.8 DL CO /VA (%) 60.7 41.5–76.6 13.6–96.6
DL CO , diffusing capacity of carbon monoxide; DL CO /VA, ratio of diffusing capacity of carbon monoxide to effective alveolar volume; FEV 1 , forced expiratory flow in 1 second; FVC, forced vital capacity; RV, residual volume; VC, vital capacity.
In two patients, RV, DL CO , and DL CO /VA were not available.
All data, except for FEV 1 /FVC, are expressed as a percentage of predicted value.
Table 2
Summary of Quantitative and Qualitative Evaluation of Emphysema and Air Trapping
Measure Median Interquartile Range Range LAV% at −950 HU (%) 15.1 3.35–30.8 0.0847–59.4 Mean on air trapping image (HU) 82.2 53.3–97.5 10.4–184 Kurtosis on air trapping image 4.91 3.32–5.49 1.96–13.1 PRMe (%) 12.8 1.79–26.8 0.00889–59.4 PRMs (%) 23.4 16.7–31.6 0.127–41.7 Addition of PRMe and PRMs (%) 39.5 19.1–53.7 0.135–86.0 Emphysema score 10 0–39 0–59 Air trapping score 41 32–48 7–64
HU, Hounsfield units; LAV%, percentage of low-attenuation lung volume; PRMe, parametric response map of emphysema; PRMs, parametric response map of functional small airways disease.
Get Radiology Tree app to read full this article<
Get Radiology Tree app to read full this article<
Table 3
Summary of Spearman Rank Correlation Coefficients Between Various CT Indices and Airflow Limitation
Measure Coefficient_P_ Value LAV% at −950 HU (%) −0.472 4.17 × 10 −3 Mean on air trapping image 0.800 8.38 × 10 −9 Kurtosis on air trapping image −0.726 7.80 × 10 −7 PRMe −0.570 3.50 × 10 −4 PRMs −0.565 4.10 × 10 −4 Addition of PRMe and PRMs −0.653 2.14 × 10 −5 Emphysema score −0.502 2.12 × 10 −3 Air trapping score −0.793 1.39 × 10 −8
CT, computed tomography; HU, Hounsfield units; LAV%, percentage of low-attenuation lung volume; PRMe, parametric response map of emphysema; PRMs, parametric response map of functional small airways disease.
Get Radiology Tree app to read full this article<
Get Radiology Tree app to read full this article<
Discussion
Get Radiology Tree app to read full this article<
Get Radiology Tree app to read full this article<
Get Radiology Tree app to read full this article<
Get Radiology Tree app to read full this article<
Get Radiology Tree app to read full this article<
Get Radiology Tree app to read full this article<
Get Radiology Tree app to read full this article<
References
1. Rabe K.F., Hurd S., Anzueto A., et. al.: Global strategy for the diagnosis, management, and prevention of chronic obstructive pulmonary disease: GOLD executive summary. Am J Respir Crit Care Med 2007; 176: pp. 532-555.
2. Mathers C.D., Loncar D.: Projections of global mortality and burden of disease from 2002 to 2030. PLoS Med 2006; 3: pp. e442.
3. Heron M.P., Tejada-Vera B.: Deaths: leading causes for 2005. Natl Vital Stat Rep 2009; 58:
4. Han M.K., Agusti A., Calverley P.M., et. al.: Chronic obstructive pulmonary disease phenotypes: the future of COPD. Am J Respir Crit Care Med 2010; 182: pp. 598-604.
5. Müller N.L., Staples C.A., Miller R.R., et. al.: “Density mask”: an objective method to quantitate emphysema using computed tomography. Chest 1988; 94: pp. 782-787.
6. Mets O.M., Murphy K., Zanen P., et. al.: The relationship between lung function impairment and quantitative computed tomography in chronic obstructive pulmonary disease. Eur Radiol 2012; 22: pp. 120-128.
7. Matsuoka S., Kurihara Y., Yagihashi K., et. al.: Airway dimensions at inspiratory and expiratory multisection CT in chronic obstructive pulmonary disease: correlation with airflow limitation. Radiology 2008; 248: pp. 1042-1049.
8. Matsuoka S., Kurihara Y., Yagihashi K., et. al.: Quantitative assessment of air trapping in chronic obstructive pulmonary disease using inspiratory and expiratory volumetric MDCT. AJR Am J Roentgenol 2008; 190: pp. 762-769.
9. Yamashiro T., Matsuoka S., Estépar R.S., et. al.: Kurtosis and skewness of density histograms on inspiratory and expiratory CT scans in smokers. COPD 2011; 8: pp. 13-20.
10. Akira M., Toyokawa K., Inoue Y., et. al.: Quantitative CT in chronic obstructive pulmonary disease: inspiratory and expiratory assessment. AJR Am J Roentgenol 2009; 192: pp. 267-272.
11. Yamamoto T., Kabus S., Klinder T., et. al.: Investigation of four-dimensional computed tomography-based pulmonary ventilation imaging in patients with emphysematous lung regions. Phys Med Biol Phys Med Biol 2011; 56: pp. 2279-2298.
12. Barbosa E.M., Song G., Tustison N., et. al.: Computational analysis of thoracic multidetector row HRCT for segmentation and quantification of small airway air trapping and emphysema in obstructive pulmonary disease. Acad Radiol 2011; 18: pp. 1258-1269.
13. Galbán C.J., Han M.K., Boes J.L., et. al.: Computed tomography-based biomarker provides unique signature for diagnosis of COPD phenotypes and disease progression. Nat Med 2012; 18: pp. 1711-1715.
14. Goddard P.R., Nicholson E.M., Laszlo G., et. al.: Computed tomography in pulmonary emphysema. Clin Radiol 1982; 33: pp. 379-387.
15. Guideline of respiratory function tests—spirometry, flow-volume curve, diffusion capacity of the lung. Nihon Kokyuki Gakkai Zasshi 2004; pp. 1-56.
16. Lee JJ, Kim N, Seo JB, et al. Automatic non-rigid lung registration method for the visualization of regional air trapping in chest CT scans. In Proceedings of the 11th International Conference on Medical Imaging Computing and Computer-Assisted Intervention (MICCAI), 2008; 195–201.
17. Murphy K., van Ginneken B., Reinhardt J.M., et. al.: Evaluation of registration methods on thoracic CT: the EMPIRE10 challenge. IEEE Trans Med Imaging 2011; 30: pp. 1901-1920.
18. Song G, Tustison N, Avants B, et al. Lung CT image registration using diffeomorphic transformation models. Medical image analysis for the clinic: a rand challenge, 2010; 23–32.
19. Yuan R., Hogg J.C., Paré P.D., et. al.: Prediction of the rate of decline in FEV 1 in smokers using quantitative computed tomography. Thorax 2009; 64: pp. 944-999.
20. Koyama H., Ohno Y., Yamazaki Y., et. al.: Quantitative and qualitative assessments of lung destruction and pulmonary functional loss from reduced-dose thin-section CT in pulmonary emphysema patients. Acad Radiol 2010; 17: pp. 163-168.
21. Meng X.L., Rosenthal R., Rubin D.B.: Comparing correlated correlation coefficients. Psychol Bull 1992; 111: pp. 172-175.
22. Akaike H.: A new look at the statistical model identification. IEEE Trans Automat Contr 1974; 19: pp. 716-723.
23. Yamaoka K., Nakagawa T., Uno T.: Application of Akaike’s information criterion (AIC) in the evaluation of linear pharmacokinetic equations. J Pharmacokinet Biopharm 1978; 6: pp. 165-175.
24. Sakamoto Y., Ishiguro M., Kitagawa G.: Jouhouryou Toukei Gaku (Information statistics).1983.Kyoritu ShuppanTokyo
25. Nakaya T.: An information statistical approach to the modifiable areal unit problem in incidence rate maps. Environ Plan A 2000; 32: pp. 91-109.
26. Dirksen A., Piitulainen E., Parr D.G., et. al.: Exploring the role of CT densitometry: a randomised study of augmentation therapy in alpha1-antitrypsin deficiency. Eur Respir J 2009; 33: pp. 1345-1353.
27. Tanabe N., Muro S., Hirai T., et. al.: Impact of exacerbations on emphysema progression in chronic obstructive pulmonary disease. Am J Respir Crit Care Med 2011; 183: pp. 1653-1659.
28. Nakano Y., Wong J.C., de Jong P.A., et. al.: The prediction of small airway dimensions using computed tomography. Am J Respir Crit Care Med 2005; 171: pp. 142-146.
29. McDonough J.E., Yuan R., Suzuki M., et. al.: Small-airway obstruction and emphysema in chronic obstructive pulmonary disease. N Engl J Med 2011; 365: pp. 1567-1575.
30. Madani A., Zanen J., de Maertelaer V., et. al.: Pulmonary emphysema: objective quantification at multi-detector row CT— comparison with macroscopic and microscopic morphometry. Radiology 2006; 238: pp. 1036-1043.
31. van Noord J.A., Buhl R., Laforce C., et. al.: QVA149 demonstrates superior bronchodilation compared with indacaterol or placebo in patients with chronic obstructive pulmonary disease. Thorax 2010; 65: pp. 1086-1091.
32. Vogelmeier C.F., Bateman E.D., Pallante J., et. al.: Efficacy and safety of once-daily QVA149 compared with twice-daily salmeterol-fluticasone in patients with chronic obstructive pulmonary disease (ILLUMINATE): a randomised, double-blind, parallel group study. Lancet Respir Med 2013; 1: pp. 51-60.
33. Willemink M.J., Leiner T., de Jong P.A., et. al.: Iterative reconstruction techniques for computed tomography part 2: initial results in dose reduction and image quality. Eur Radiol 2013; 23: pp. 1632-1642.
34. Mets O.M., Willemink M.J., de Kort F.P., et. al.: The effect of iterative reconstruction on computed tomography assessment of emphysema, air trapping and airway dimensions. Eur Radiol 2012; 22: pp. 2103-2109.