
Rationale and Objectives
From dynamic contrast-enhanced magnetic resonance imaging, it is known that microcirculation patterns in multiple myeloma differ depending on the infiltration pattern. The purpose of this study was to evaluate histogram analysis of dynamic contrast-enhanced magnetic resonance imaging in MM to monitor early treatment response on the basis of microcirculation patterns.
Materials and Methods
A total of 51 patients with multiple myeloma requiring therapy were examined. Dynamic contrast-enhanced magnetic resonance imaging of the lumbar spine was performed before and after conventional or high-dose chemotherapy with autologous stem cell transplantation. Statistical analysis included 245 vertebrae and dynamic microcirculation parameters as displayed in histograms. Resulting parameters (amplitude, exchange rate constant, skewness, kurtosis, and left shift) were correlated with therapeutic response.
Results
More than 70% of histograms derived from the microcirculation parameters showed a difference between the maximum peak before and after therapy (left shift). However, there was no significant difference between the particular treatment. Significantly different skewness of amplitude in 98% and kurtosis of exchange rate constant (94.1% and 98%) were seen in the patients who responded to treatment ( P for each < .05).
Conclusions
Histogram analysis revealed early changes after therapy resulting in a shift toward more (kurtosis) and lower values (skewness) of microcirculation parameters. Therefore, histogram analysis can determine and describe if a chosen therapy works at all. However, there were no differences between the chosen therapies. This needs to be reevaluated in a larger number of treated patients. Histogram analysis can also be an adjunct to a subjective visual analysis but is hampered by heterogeneous infiltration pattern seen in multiple myeloma.
Multiple myeloma (MM) is a malignant lymphoproliferative B-cell disorder characterized by a growth and accumulation of monoclonal plasma cells in the bone marrow. Myeloma cells show focal or diffuse distribution in the bone marrow of spine, ribs, sternum, pelvis, and skull. The diagnosis is made on the basis of criteria of the International Myeloma Working Group . MM may be either asymptomatic and not requiring systemic treatment or symptomatic, defined by the presence of end-organ damage to bone, kidneys, or hematopoietic bone marrow. The latter patients therefore deserve treatment with conventional chemotherapy or high-dose chemotherapy (HDCT) in combination with novel agents as bortezomib, thalidomide or lenalidomide .
For staging, the system proposed by Durie and Salmon is widely accepted. It includes laboratory parameters and the presence or absence of lytic bone lesions at x-ray plain film skeletal surveys . A recently proposed staging system (Durie/Salmon PLUS) uses as a criterion the degree of bone marrow changes as seen on magnetic resonance imaging (MRI) or positron emission tomography .
Get Radiology Tree app to read full this article<
Get Radiology Tree app to read full this article<
Get Radiology Tree app to read full this article<
Get Radiology Tree app to read full this article<
Get Radiology Tree app to read full this article<
Materials and methods
Patients
Get Radiology Tree app to read full this article<
Get Radiology Tree app to read full this article<
Get Radiology Tree app to read full this article<
Treatment
Get Radiology Tree app to read full this article<
Table 1
Therapy Regimen of Conventional Chemotherapy and Combined HDCT with ABSCT Followed by Different Maintenance Therapies
Regimen Number of Patients Maintenance Therapy Conventional chemotherapy Total 8 Bortezomib Alexanian 6 2 VISTA 1 1 VAD 1 1 HDCT with ABSCT Total 43 Bortezomib Thalidomide Interferon GMMG-HD4 trial 26 9 14 — 2× melphalan + ABSCT 3 1 — 3 1× melphalan + ABSCT 14 — 1 8
ABSCT, autologous blood stem cell transplantation; GMMG, German-Speaking Myeloma Multicenter Group; HDCT, high-dose chemotherapy; VAD, vincristine, doxorubicin, and dexamethasone; VISTA, Velcade as Initial Standard Therapy in Multiple Myeloma: Assessment with Melphalan and Prednisone.
Get Radiology Tree app to read full this article<
Get Radiology Tree app to read full this article<
Get Radiology Tree app to read full this article<
MRI Protocol
Get Radiology Tree app to read full this article<
Get Radiology Tree app to read full this article<
Table 2
MRI Protocol with Sequence Characteristics
Sequence Characteristic T1-weighted SE T2-weighted TIRM FLASH 2D Perfusion T1-weighted SE Fat Saturated Orientation Sagittal Sagittal Sagittal Sagittal TR (ms) 500 5120/3500 ∗ 79 531 TE (ms) 14 67/30 ∗ 4.76 11 Slices 17 15 9 15 Slice thickness (mm) 4 4 8 3 FOV (mm) 280 280/340 ∗ 380 280 Voxel size (mm 3 ) 1.1 × 1.1 × 4 1.1 × 1.1 × 4/1.2 × 0.9 × 4 ∗ 1.5 × 1.5 × 8 1.1 × 1.1 × 3 Flip angle (°) 90 150 80 90 Time 4 min 2 s 6 min 55 s/3 min 42 s ∗ 5 min 54 s 5 min 13 s
FLASH, fast low-angle shot; FOV, field of view; MRI, magnetic resonance imaging; SE, spin echo; TE, echo time; TIRM, turbo inversion recovery magnitude; TR, repetition time; 2D, two-dimensional.
Get Radiology Tree app to read full this article<
Get Radiology Tree app to read full this article<
Get Radiology Tree app to read full this article<
Get Radiology Tree app to read full this article<
Evaluation
Get Radiology Tree app to read full this article<
Get Radiology Tree app to read full this article<
Get Radiology Tree app to read full this article<
Get Radiology Tree app to read full this article<
Get Radiology Tree app to read full this article<
Get Radiology Tree app to read full this article<
Get Radiology Tree app to read full this article<
Get Radiology Tree app to read full this article<
Get Radiology Tree app to read full this article<
Get Radiology Tree app to read full this article<
Statistical Analysis
Get Radiology Tree app to read full this article<
Results
Clinical Response to Treatment
Get Radiology Tree app to read full this article<
Histogram-based Response to Treatment
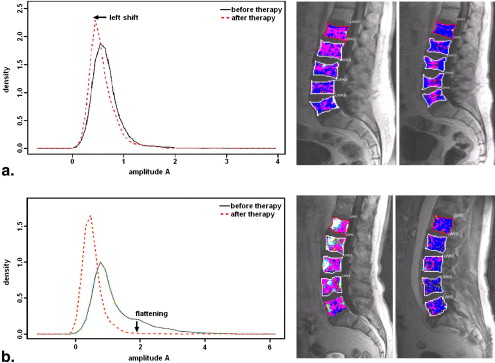
Left shift
Get Radiology Tree app to read full this article<
Table 3
Numbers and Percentages of Left Shifts after Different Therapies Showing That the Choice of Therapy is Independent of a Particular Therapy Regimen
Regimen ∗ A__k ep All therapies 34/46 (73.9%) 36/46 (78.3%) Alexanian 3/4 (75%) 3/4 (75%) HDCT 6/8 (75%) 7/8 (87.5%) Thalidomide 10/15 (66.7%) 12/15 (80%) Bortezomib 8/9 (88.9%) 8/9 (88.9%) Interferon 7/10 (70%) 6/10 (60%)
A , amplitude; HDCT, high-dose chemotherapy; k ep , exchange rate constant.
Get Radiology Tree app to read full this article<
Get Radiology Tree app to read full this article<
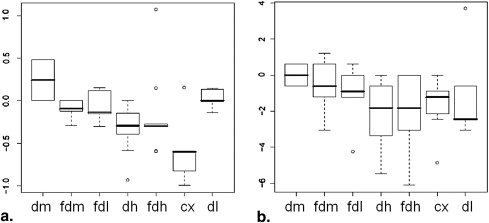
Skewness
Get Radiology Tree app to read full this article<
Get Radiology Tree app to read full this article<
Get Radiology Tree app to read full this article<
Kurtosis
Get Radiology Tree app to read full this article<
Remission status
Get Radiology Tree app to read full this article<
Visual Pattern–based Response to Treatment
Get Radiology Tree app to read full this article<
Table 4
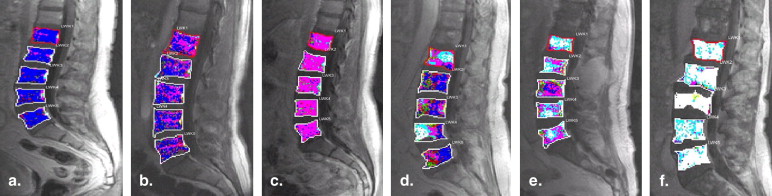
Microcirculation Patterns as Described in Figure 2 before and after Therapy
Pattern on First MRI Study Number of Vertebrae Pattern on Second MRI Number of Vertebrae dl 49 (20.0%) dl 41 (83.7%) dh 3 (5.8%) dm 4 (8.2%) fdl 1 (2.0%) dm 26 (10.6%) dl 16 (61.5%) dh 3 (11.5%) cx 1 (3.9%) fdm 1 (3.9%) dm 3 (11.5%) fdl 2 (7.7%) dh 99 (41.4%) dl 52 (52.5%) dh 33 (33.3%) dm 12 (12.1%) fdl 1 (1.0%) fdm 1 (1.0%) fdl 7 (2.9%) dl 6 (85.7%) dm 1 (14.3%) fdm 4 (1.6%) dl 1 (25%) fdm 1 (25%) fdl 2 (50%) fdh 26 (10.6%) dl 15 (57.7%) dh 9 (34.6%) dm 1 (3.9%) fdl 1 (3.9%) cx 34 (13.9%) dl 6 (17.7%) dh 4 (11.8%) cx 9 (26.5%) fdm 1 (2.9%) dm 3 (8.8%) fdh 11 (32.4%)
cx, confluent; dh, diffuse-high; dl, diffuse-low; dm, diffuse-medium; fdh, focal in diffuse-high in L2, L4, and L5; fdl, focal in diffuse-low in L4; fdm, focal in diffuse-medium in L1; MRI, magnetic resonance imaging.
The “decrease” in diffuse infiltration after therapy (eg, initially 99 vertebrae with dh pattern and after therapy 52 and 33 vertebrae with dm and dl microcirculation patterns, respectively).
Get Radiology Tree app to read full this article<
Get Radiology Tree app to read full this article<
Get Radiology Tree app to read full this article<
Get Radiology Tree app to read full this article<
Get Radiology Tree app to read full this article<
Comparison of Histogram and Visual Pattern–based Response to Treatment
Get Radiology Tree app to read full this article<
Discussion
Get Radiology Tree app to read full this article<
Get Radiology Tree app to read full this article<
Get Radiology Tree app to read full this article<
Get Radiology Tree app to read full this article<
Get Radiology Tree app to read full this article<
Get Radiology Tree app to read full this article<
Get Radiology Tree app to read full this article<
Get Radiology Tree app to read full this article<
Get Radiology Tree app to read full this article<
Get Radiology Tree app to read full this article<
Get Radiology Tree app to read full this article<
Get Radiology Tree app to read full this article<
Get Radiology Tree app to read full this article<
Get Radiology Tree app to read full this article<
Get Radiology Tree app to read full this article<
Get Radiology Tree app to read full this article<
Conclusions
Get Radiology Tree app to read full this article<
Get Radiology Tree app to read full this article<
References
1. Criteria for the classification of monoclonal gammopathies, multiple myeloma and related disorders: a report of the International Myeloma Working Group. Br J Haematol 2003; 121: pp. 749-757.
2. Durie B.G., Salmon S.E.: A clinical staging system for multiple myeloma. Correlation of measured myeloma cell mass with presenting clinical features, response to treatment, and survival. Cancer 1975; 36: pp. 842-854.
3. Durie B.G., Harousseau J.L., Miguel J.S., et. al.: International uniform response criteria for multiple myeloma. Leukemia 2006; 20: pp. 1467-1473.
4. Baur A., Stabler A., Nagel D., et. al.: Magnetic resonance imaging as a supplement for the clinical staging system of Durie and Salmon?. Cancer 2002; 95: pp. 1334-1345.
5. Brasch R., Pham C., Shames D., et. al.: Assessing tumor angiogenesis using macromolecular MR imaging contrast media. J Magn Reson Imaging 1997; 7: pp. 68-74.
6. Passe T.J., Bluemke D.A., Siegelman S.S.: Tumor angiogenesis: tutorial on implications for imaging. Radiology 1997; 203: pp. 593-600.
7. Griebel J., Mayr N.A., de Vries A., et. al.: Assessment of tumor microcirculation: a new role of dynamic contrast MR imaging. J Magn Reson Imaging 1997; 7: pp. 111-119.
8. Brix G., Semmler W., Port R., et. al.: Pharmacokinetic parameters in CNS Gd-DTPA enhanced MR imaging. J Comput Assist Tomogr 1991; 15: pp. 621-628.
9. Hillengass J., Zechmann C.M., Nadler A., et. al.: Gain of 1q21 and distinct adverse cytogenetic abnormalities correlate with increased microcirculation in multiple myeloma. Int J Cancer 2008; 122: pp. 2871-2875.
10. Moehler T.M., Hawighorst H., Neben K., et. al.: Bone marrow microcirculation analysis in multiple myeloma by contrast-enhanced dynamic magnetic resonance imaging. Int J Cancer 2001; 93: pp. 862-868.
11. Hillengass J., Zechmann C., Bauerle T., et. al.: Dynamic contrast-enhanced magnetic resonance imaging identifies a subgroup of patients with asymptomatic monoclonal plasma cell disease and pathologic microcirculation. Clin Cancer Res 2009; 15: pp. 3118-3125.
12. Scherer A., Wittsack H.J., Strupp C., et. al.: Vertebral fractures in multiple myeloma: first results of assessment of fracture risk using dynamic contrast-enhanced magnetic resonance imaging. Ann Hematol 2002; 81: pp. 517-521.
13. Alexanian R., Haut A., Khan A.U., et. al.: Treatment for multiple myeloma. Combination chemotherapy with different melphalan dose regimens. JAMA 1969; 208: pp. 1680-1685.
14. Nosas-Garcia S., Moehler T., Wasser K., et. al.: Dynamic contrast-enhanced MRI for assessing the disease activity of multiple myeloma: a comparative study with histology and clinical markers. J Magn Reson Imaging 2005; 22: pp. 154-162.
15. Rahmouni A., Montazel J.L., Divine M., et. al.: Bone marrow with diffuse tumor infiltration in patients with lymphoproliferative diseases: dynamic gadolinium-enhanced MR imaging. Radiology 2003; 229: pp. 710-717.
16. Rahmouni A., Divine M., Mathieu D., et. al.: MR appearance of multiple myeloma of the spine before and after treatment. AJR Am J Roentgenol 1993; 160: pp. 1053-1057.
17. Hillengass J., Wasser K., Delorme S., et. al.: Lumbar bone marrow microcirculation measurements from dynamic contrast-enhanced magnetic resonance imaging is a predictor of event-free survival in progressive multiple myeloma. Clin Cancer Res 2007; 13: pp. 475-481.
18. Bowman A.W., Azzalini A.: R package “sm”: nonparametric smoothing methods (version 2.2).Applied smoothing techniques for data analysis: the kernel approach with S-Plus illustrations.1997.Oxford University PressOxford, UK:pp. 53-61.
19. Stäbler A., Baur A., Bartl R., et. al.: Contrast enhancement and quantitative signal analysis in MR imaging of multiple myeloma: assessment of focal and diffuse growth patterns in marrow correlated with biopsies and survival rates. AJR Am J Roentgenol 1996; 167: pp. 1029-1036.
20. Raab M.S., Podar K., Breitkreutz I., et. al.: Multiple myeloma. Lancet 2009; 374: pp. 324-339.
21. Oh H.S., Choi J.H., Park C.K., et. al.: Comparison of microvessel density before and after peripheral blood stem cell transplantation in multiple myeloma patients and its clinical implications: multicenter trial. Int J Hematol 2002; 76: pp. 465-470.
22. Singhal S., Mehta J., Desikan R., et. al.: Antitumor activity of thalidomide in refractory multiple myeloma. N Engl J Med 1999; 341: pp. 1565-1571.
23. Li K.L., Wilmes L.J., Henry R.G., et. al.: Heterogeneity in the angiogenic response of a BT474 human breast cancer to a novel vascular endothelial growth factor-receptor tyrosine kinase inhibitor: assessment by voxel analysis of dynamic contrast-enhanced MRI. J Magn Reson Imaging 2005; 22: pp. 511-519.
24. Hayes C., Padhani A.R., Leach M.O.: Assessing changes in tumour vascular function using dynamic contrast-enhanced magnetic resonance imaging. NMR Biomed 2002; 15: pp. 154-163.
25. Chang Y.C., Huang C.S., Liu Y.J., et. al.: Angiogenic response of locally advanced breast cancer to neoadjuvant chemotherapy evaluated with parametric histogram from dynamic contrast-enhanced MRI. Phys Med Biol 2004; 49: pp. 3593-3602.
26. de Lussanet Q.G., Backes W.H., Griffioen A.W., et. al.: Dynamic contrast-enhanced magnetic resonance imaging of radiation therapy-induced microcirculation changes in rectal cancer. Int J Radiat Oncol Biol Phys 2005; 63: pp. 1309-1315.
27. Checkley D., Tessier J.J., Kendrew J., et. al.: Use of dynamic contrast-enhanced MRI to evaluate acute treatment with ZD6474, a VEGF signalling inhibitor, in PC-3 prostate tumours. Br J Cancer 2003; 89: pp. 1889-1895.
28. Ludwig H., Beksac M., Bladé J., et. al.: Current multiple myeloma treatment strategies with novel agents: a European perspective. Oncologist 2010; 15: pp. 6-25.
29. Jain R.K.: Normalization of tumor vasculature: an emerging concept in antiangiogenic therapy. Science 2005; 307: pp. 58-62.
30. Baish J.W., Jain R.K.: Fractals and cancer. Cancer Res 2000; 60: pp. 3683-3688.
31. Hobbs S.K., Monsky W.L., Yuan F., et. al.: Regulation of transport pathways in tumor vessels: role of tumor type and microenvironment. Proc Natl Acad Sci U S A 1998; 95: pp. 4607-4612.
32. Hashizume H., Baluk P., Morikawa S., et. al.: Openings between defective endothelial cells explain tumor vessel leakiness. Am J Pathol 2000; 156: pp. 1363-1380.
33. Zwick S., Brix G., Tofts P.S., et. al.: Simulation-based comparison of two approaches frequently used for dynamic contrast-enhanced MRI. Eur Radiol 2010; 20: pp. 432-442.