
Rationale and Objectives
The longitudinal relationship between regional air trapping and emphysema remains unexplored. We have sought to demonstrate the utility of parametric response mapping (PRM), a computed tomography (CT)–based biomarker, for monitoring regional disease progression in chronic obstructive pulmonary disease (COPD) patients, linking expiratory- and inspiratory-based CT metrics over time.
Materials and Methods
Inspiratory and expiratory lung CT scans were acquired from 89 COPD subjects with varying Global Initiative for Chronic Obstructive Lung Disease (GOLD) status at 30 days ( n = 13) or 1 year ( n = 76) from baseline as part of the Subpopulations and Intermediate Outcome Measures in COPD Study (SPIROMICS) clinical trial. PRMs of CT data were used to quantify the relative volumes of normal parenchyma (PRM Normal ), emphysema (PRM Emph ), and functional small airways disease (PRM fSAD ). PRM measurement variability was assessed using the 30-day interval data. Changes in PRM metrics over a 1-year period were correlated to pulmonary function (forced expiratory volume at 1 second [FEV1]). A theoretical model that simulates PRM changes from COPD was compared to experimental findings.
Results
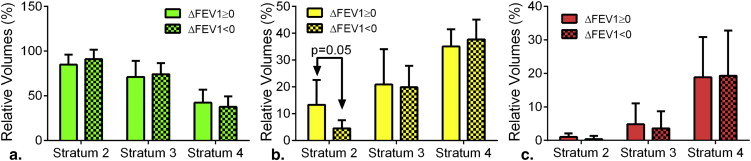
PRM metrics varied by ∼6.5% of total lung volume for PRM Normal and PRM fSAD and 1% for PRM Emph when testing 30-day repeatability. Over a 1-year interval, only PRM Emph in severe COPD subjects produced significant change (19%–21%). However, 11 of 76 subjects showed changes in PRM fSAD greater than variations observed from analysis of 30-day data. Mathematical model simulations agreed with experimental PRM results, suggesting fSAD is a transitional phase from normal parenchyma to emphysema.
Conclusions
PRM of lung CT scans in COPD patients provides an opportunity to more precisely characterize underlying disease phenotypes, with the potential to monitor disease status and therapy response.
Chronic obstructive pulmonary disease (COPD) is a complex syndrome with multiple underlying phenotypes. As the third leading cause of mortality in the United States, research in COPD has intensified with the focus toward accurately phenotyping this complex disease . Physiologic assessment and patient-reported parameters such as dyspnea and health status continue to be the standard of care for diagnosis but have limited prognostic value as only global assessment of COPD is obtained . Although there have been considerable strides in understanding the underlying biology, limited progress has been made in improving our ability to routinely define and longitudinally monitor the varying components of COPD. As such, there is a need to develop and evaluate patient-specific biomarker surrogates of clinical status and outcome in COPD patients.
A biomarker must be technically measureable, unattainable by other methods, and useful for the effective management of patients . For COPD patients, the most widely used measure that fits this definition continues to be forced expiratory volume in 1 second (FEV1). Improvements have been made through the inclusion of FEV1 in multidimensional assessments (eg, body mass index, obstruction, dyspnea, exercise [BODE]) , which have improved prognostication over FEV1 alone. Nevertheless, these measures have limited capability in identifying the underlying biological components that make up the varying COPD phenotypes. Although biological components of COPD are subject to molecular and genetic heterogeneity , they do provide unique imageable characteristics including regional distribution of emphysema , air trapping , airway remodeling , regional alterations in texture , lung mechanics , and more recently measures of perfusion heterogeneity and altered pulmonary vascular dimensions .
Get Radiology Tree app to read full this article<
Get Radiology Tree app to read full this article<
Methods
Study Population
Get Radiology Tree app to read full this article<
Table 1
Subject Characteristics
Parameter Stratum 2 Stratum 3 Stratum 4 Number 15 41 20 Gender (M/F) 9/6 19/22 9/11 Age (years) 62 (10) 65 (8) 64 (7) Height (cm) 174 (10) 168 (10) 166 (11) Weight (kg) 86 (20) 83 (17) 74 (15) BMI (kg/cm 2 ) 28 (5) 29 (5) 27 (3) Pack years 42 (18) 51 (18) 52 (16)
BMI, body mass index; F, female; M, male.
Values are in mean (standard deviation).
Get Radiology Tree app to read full this article<
Computed Tomography Acquisition and Analysis
Get Radiology Tree app to read full this article<
Parametric Response Mapping (PRM)
Get Radiology Tree app to read full this article<
Computational Model
Get Radiology Tree app to read full this article<
PRMNormal⇄kfSAD→NormalkNormal→fSADPRMfSAD⇄kEmph→fSADkfSAD→EmphPRMEmph PRM
Normal
⇄
k
fSAD
→
Normal
k
Normal
→
fSAD
PRM
fSAD
⇄
k
Emph
→
fSAD
k
fSAD
→
Emph
PRM
Emph
Get Radiology Tree app to read full this article<
Get Radiology Tree app to read full this article<
Data and Statistical Analysis
Get Radiology Tree app to read full this article<
One-Year Interval Data
Get Radiology Tree app to read full this article<
Thirty-Day Interval Data
Get Radiology Tree app to read full this article<
Results
Get Radiology Tree app to read full this article<
Get Radiology Tree app to read full this article<
Table 2
FEV1 at Baseline and 1-Year Follow-up by Group
Strata ΔFEV1 ( n ) FEV1 BL FU Δ 2 ↑(6) 2.75 (1.07) 2.87 (1.03) 0.08 (0.08) ↓(9) 3.23 (0.86) 3.02 (0.82) −0.33 (0.62) 3 ↑(18) 1.93 (0.70) 2.03 (0.69) 0.13 (0.15) ↓(23) 2.06 (0.54) 1.75 (0.74) −0.21 (0.12) 4 ↑(8) 0.85 (0.25) 0.94 (0.26) 0.09 (0.05) ↓(12) 0.93 (0.28) 0.84 (0.30) −0.09 (0.05)
BL, baseline; FEV1, forced expiratory volume at 1 second; FU, follow-up; Δ, change from baseline to follow-up.
Values are in mean (standard deviation) liters. ↑FEV1 increase and ↓FEV decrease at 1 year.

Get Radiology Tree app to read full this article<
Get Radiology Tree app to read full this article<
Table 3
Prevalence of Change in Parametric Response Mapping Metrics
Strata PRM Normal (%) PRM fSAD (%) PRM Emph (%) PRM (%) ↑ ↓ ↑ ↓ ↑ ↓ ↑ or ↓ 2 1 (7) 0 0 1 (7) 0 0 1 of 15 (7) 3 4 (10) 8 (20) 4 (10) 4 (10) 5 (12) 3 (7) 17 of 41 (41) 4 2 (10) 1 (5) 0 2 (10) 10 (50) 2 (10) 13 of 20 (65) Total 31 of 76 (41)
Emph, emphysema; fSAD, functional small airways disease; PRM, parametric response mapping.
Indicated for each parametric response mapping metric and group is the population with positive (↑) and negative (↓) change values beyond the change in 95% interval threshold identified using test–retest cohort and also the percentage (%) within the stratum.
Get Radiology Tree app to read full this article<
Get Radiology Tree app to read full this article<
![Figure 3, Capture of chronic obstructive pulmonary disease progression by parametric response mapping (PRM). Scatter plot of subjects' PRM fSAD and PRM Emph values over a 1-year interval. Arrows indicate subjects with significant changes in PRM fSAD ( yellow ), PRM Emph ( red ), or both ( orange ). Black dots are the mean baseline and follow-up PRM values for subjects with changes in PRM smaller than the predetermined thresholds from 30-day interval computed tomography data. Cases with decreasing emphysema are represented as dots (N = 5; Table 3 ). The gray region indicates simulation bounds generated from the compartment model with rate constants [k Normal→fSAD , k fSAD→Normal , k fSAD→Emph ] equal to [1, 1, 1] and [1, 0.33, 0.33] for the lower and upper bound, respectively. Emphysema was assumed irreversible for all simulations (ie, k Emph→fSAD = 0), and all rate constants were normalized to k Normal→fSAD . *, †, and ‡ indicate the three cases represented in Figures 1a, 1b, and 4 , respectively. Emph, emphysema; fSAD, functional small airways disease; PRM, parametric response mapping.](https://storage.googleapis.com/dl.dentistrykey.com/clinical/ParametricResponseMappingMonitorsTemporalChangesonLungCTScansintheSubpopulationsandIntermediateOutcomeMeasuresinCOPDStudySPIROMICS/2_1s20S1076633214003419.jpg)
Get Radiology Tree app to read full this article<
Get Radiology Tree app to read full this article<
Discussion
Get Radiology Tree app to read full this article<
Get Radiology Tree app to read full this article<
Get Radiology Tree app to read full this article<
Get Radiology Tree app to read full this article<
Acknowledgments
Get Radiology Tree app to read full this article<
Appendix
Computational Model
Get Radiology Tree app to read full this article<
PRMNormal⇄kY→GkG→YPRMfSAD⇄kR→YkY→RPRMEmph PRM
Normal
⇄
k
Y
→
G
k
G
→
Y
PRM
fSAD
⇄
k
R
→
Y
k
Y
→
R
PRM
Emph
Get Radiology Tree app to read full this article<
Get Radiology Tree app to read full this article<
⎧⎩⎨⎪⎪⎪⎪⎪⎪⎪⎪dG(t)dt=kYG∗Y(t)−kGY∗G(t)dY(t)dt=kGY∗G(t)−(kYG+kYR)∗Y(t)+kRY∗R(t)dR(t)dt=kYR∗Y(t)−kRY∗R(t) {
dG
(
t
)
dt
=
k
YG
∗
Y
(
t
)
−
k
GY
∗
G
(
t
)
dY
(
t
)
dt
=
k
GY
∗
G
(
t
)
−
(
k
YG
+
k
YR
)
∗
Y
(
t
)
+
k
RY
∗
R
(
t
)
dR
(
t
)
dt
=
k
YR
∗
Y
(
t
)
−
k
RY
∗
R
(
t
)
Get Radiology Tree app to read full this article<
Get Radiology Tree app to read full this article<
G(t)=1,Y(t)=0,R(t)=0@t=0 G
(
t
)
=
1
,
Y
(
t
)
=
0
,
R
(
t
)
=
0
@
t
=
0
where G , Y , and R represent PRM__Normal , PRM__fSAD , and PRM__Emph , respectively.
Get Radiology Tree app to read full this article<
Get Radiology Tree app to read full this article<
⎧⎩⎨⎪⎪⎪⎪⎪⎪⎪⎪⎪⎪G(t)=kYGkRYγ−kGYλ3(kYR+kRY+λ2)γ(λ2−λ3)eλ2t+kGYλ2(kYR+kRY+λ3)γ(λ2−λ3)eλ3tY(t)=kGYkRYγ+kGYλ3(kRY+λ2)γ(λ2−λ3)eλ2t−kGYλ2(kRY+λ3)γ(λ2−λ3)eλ3tR(t)=kGYkYRγ+kGYkYRλ3γ(λ2−λ3)eλ2t+kGYkYRλ2γ(λ2−λ3)eλ3t {
G
(
t
)
=
k
YG
k
RY
γ
−
k
GY
λ
3
(
k
YR
+
k
RY
+
λ
2
)
γ
(
λ
2
−
λ
3
)
e
λ
2
t
+
k
GY
λ
2
(
k
YR
+
k
RY
+
λ
3
)
γ
(
λ
2
−
λ
3
)
e
λ
3
t
Y
(
t
)
=
k
GY
k
RY
γ
+
k
GY
λ
3
(
k
RY
+
λ
2
)
γ
(
λ
2
−
λ
3
)
e
λ
2
t
−
k
GY
λ
2
(
k
RY
+
λ
3
)
γ
(
λ
2
−
λ
3
)
e
λ
3
t
R
(
t
)
=
k
GY
k
YR
γ
+
k
GY
k
YR
λ
3
γ
(
λ
2
−
λ
3
)
e
λ
2
t
+
k
GY
k
YR
λ
2
γ
(
λ
2
−
λ
3
)
e
λ
3
t
where
⎧⎩⎨⎪⎪⎪⎪⎪⎪⎪⎪⎪⎪λ1=0λ2=−Σ−Σ2−4γ√2λ3=−Σ+Σ2−4γ√2 {
λ
1
=
0
λ
2
=
−
Σ
−
Σ
2
−
4
γ
2
λ
3
=
−
Σ
+
Σ
2
−
4
γ
2
where,
Σ=kGY+kYG+kYR+kRYγ=kGYkYR+kGYkRY+kYGkRY Σ
=
k
GY
+
k
YG
+
k
YR
+
k
RY
γ
=
k
GY
k
YR
+
k
GY
k
RY
+
k
YG
k
RY
Get Radiology Tree app to read full this article<
Get Radiology Tree app to read full this article<
⎧⎩⎨⎪⎪⎪⎪⎪⎪⎪⎪⎪⎪G(t)=−kGYλ3(kYR+λ2)γ(λ2−λ3)eλ2t+kGYλ2(kYR+λ3)γ(λ2−λ3)eλ3tY(t)=kGYλ3λ2γ(λ2−λ3)eλ2t−kGYλ2λ3γ(λ2−λ3)eλ3tR(t)=kGYkYRγ+kGYkYRλ3γ(λ2−λ3)eλ2t+kGYkYRλ2γ(λ2−λ3)eλ3t {
G
(
t
)
=
−
k
GY
λ
3
(
k
YR
+
λ
2
)
γ
(
λ
2
−
λ
3
)
e
λ
2
t
+
k
GY
λ
2
(
k
YR
+
λ
3
)
γ
(
λ
2
−
λ
3
)
e
λ
3
t
Y
(
t
)
=
k
GY
λ
3
λ
2
γ
(
λ
2
−
λ
3
)
e
λ
2
t
−
k
GY
λ
2
λ
3
γ
(
λ
2
−
λ
3
)
e
λ
3
t
R
(
t
)
=
k
GY
k
YR
γ
+
k
GY
k
YR
λ
3
γ
(
λ
2
−
λ
3
)
e
λ
2
t
+
k
GY
k
YR
λ
2
γ
(
λ
2
−
λ
3
)
e
λ
3
t
Get Radiology Tree app to read full this article<
Get Radiology Tree app to read full this article<
Supplementary Data
Get Radiology Tree app to read full this article<
![Figure 1S, Modeling of chronic obstructive pulmonary disease progression by parametric response mapping (PRM). Scatter plot of the relative lung volumes of PRM fSAD and PRM Emph (a) with arrows indicating subjects with significant changes in PRM fSAD ( yellow ), PRM Emph ( red ), or both ( orange ). Black dots are the mean baseline and follow-up PRM values. Cases with decreasing emphysema were presented by dots (N = 5; Table 2 ). The gray region indicates bounds of the compartment model simulations with rate constants [1, 1, 1] for the lower bound, [1, 0.66, 0.66] for the middle line, and [1, 0.33, 0.33] for the upper bound ([k G→Y , k Y→G , k Y→R ], respectively). Emphysema was assumed irreversible for all simulations (ie, k R→Y = 0), and all rate constants were normalized to k G→Y . A range of solutions to G(t), Y(t), and R(t) are shown in (b) corresponding to the gray lines in (a) plotted on an arbitrary time axis. Varying rates of transition can result in varying relative volumes of PRM Normal , PRM fSAD , and PRM Emph tissues. Note that using this model, slower rates of transition to emphysema result in >50% of the lungs being classified as PRM fSAD . Emph, emphysema; fSAD, functional small airways disease; PRM, parametric response mapping.](https://storage.googleapis.com/dl.dentistrykey.com/clinical/ParametricResponseMappingMonitorsTemporalChangesonLungCTScansintheSubpopulationsandIntermediateOutcomeMeasuresinCOPDStudySPIROMICS/4_1s20S1076633214003419.jpg)
Get Radiology Tree app to read full this article<
Get Radiology Tree app to read full this article<
References
1. Mannino D.M., Buist A.S.: Global burden of COPD: risk factors, prevalence, and future trends. Lancet 2007; 370: pp. 765-773.
2. Bousquet J., Dahl R., Khaltaev N.: Global alliance against chronic respiratory diseases. Eur Respir J 2007; 29: pp. 233-239.
3. Vestbo J., Hurd S.S., Agusti A.G., et. al.: Global strategy for the diagnosis, management, and prevention of chronic obstructive pulmonary disease: GOLD executive summary. Am J Respir Crit Care Med 2013; 187: pp. 347-365.
4. Agusti A., Sobradillo P., Celli B.: Addressing the complexity of chronic obstructive pulmonary disease: from phenotypes and biomarkers to scale-free networks, systems biology, and P4 medicine. American journal of respiratory and critical care medicine 2011; 183: pp. 1129-1137.
5. Morrow D.A., de Lemos J.A.: Benchmarks for the assessment of novel cardiovascular biomarkers. Circulation 2007; 115: pp. 949-952.
6. Celli B.R., Cote C.G., Marin J.M., et. al.: The body-mass index, airflow obstruction, dyspnea, and exercise capacity index in chronic obstructive pulmonary disease. N Engl J Med 2004; 350: pp. 1005-1012.
7. Puhan M.A., Garcia-Aymerich J., Frey M., et. al.: Expansion of the prognostic assessment of patients with chronic obstructive pulmonary disease: the updated BODE index and the ADO index. Lancet 2009; 374: pp. 704-711.
8. Barnes P.J.: Immunology of asthma and chronic obstructive pulmonary disease. Nat Rev Immunol 2008; 8: pp. 183-192.
9. Bergin C., Muller N., Nichols D.M., et. al.: The diagnosis of emphysema. A computed tomographic-pathologic correlation. Am Rev Respir Dis 1986; 133: pp. 541-546.
10. Mishima M., Hirai T., Itoh H., et. al.: Complexity of terminal airspace geometry assessed by lung computed tomography in normal subjects and patients with chronic obstructive pulmonary disease. Proceedings of the National Academy of Sciences of the United States of America 1999; 96: pp. 8829-8834.
11. Mohamed Hoesein F.A., van Rikxoort E., van Ginneken B., et. al.: Computed tomography-quantified emphysema distribution is associated with lung function decline. European Respiratory Journal 2012; 40: pp. 844-850.
12. Yilmaz C., Dane D.M., Patel N.C., et. al.: Quantifying heterogeneity in emphysema from high-resolution computed tomography: a lung tissue research consortium study. Acad Radiol 2013; 20: pp. 181-193.
13. Newman K.B., Lynch D.A., Newman L.S., et. al.: Quantitative computed tomography detects air trapping due to asthma. Chest 1994; 106: pp. 105-109.
14. Matsuoka S., Kurihara Y., Yagihashi K., et. al.: Quantitative assessment of air trapping in chronic obstructive pulmonary disease using inspiratory and expiratory volumetric MDCT. AJR Am J Roentgenol 2008; 190: pp. 762-769.
15. Busacker A., Newell J.D., Keefe T., et. al.: A multivariate analysis of risk factors for the air-trapping asthmatic phenotype as measured by quantitative CT analysis. CHEST Journal 2009; 135: pp. 48-56.
16. Nakano Y., Muro S., Sakai H., et. al.: Computed tomographic measurements of airway dimensions and emphysema in smokers. Correlation with lung function. Am J Respir Crit Care Med 2000; 162: pp. 1102-1108.
17. Hackx M., Bankier A.A., Gevenois P.A.: Chronic obstructive pulmonary disease: CT quantification of airways disease. Radiology 2012; 265: pp. 34-48.
18. Xu Y., Sonka M., McLennan G., et. al.: MDCT-based 3-D texture classification of emphysema and early smoking related lung pathologies. Medical Imaging, IEEE Transactions on 2006; 25: pp. 464-475.
19. Ginsburg S.B., Lynch D.A., Bowler R.P., et. al.: Automated texture-based quantification of centrilobular nodularity and centrilobular emphysema in chest CT images. Acad Radiol 2012; 19: pp. 1241-1251.
20. Castaldi P.J., San Jose Estepar R., Mendoza C.S., et. al.: Distinct quantitative computed tomography emphysema patterns are associated with physiology and function in smokers. Am J Respir Crit Care Med 2013; 188: pp. 1083-1090.
21. Reinhardt J.M., Ding K., Cao K., et. al.: Registration-based estimates of local lung tissue expansion compared to xenon CT measures of specific ventilation. Med Image Anal 2008; 12: pp. 752-763.
22. Murphy K., Pluim J.P., van Rikxoort E.M., et. al.: Toward automatic regional analysis of pulmonary function using inspiration and expiration thoracic CT. Medical physics 2012; 39: pp. 1650-1662.
23. Alford S.K., van Beek E.J., McLennan G., et. al.: Heterogeneity of pulmonary perfusion as a mechanistic image-based phenotype in emphysema susceptible smokers. Proceedings of the National Academy of Sciences 2010; 107: pp. 7485-7490.
24. Matsuoka S., Washko G.R., Dransfield M.T., et. al.: Quantitative CT measurement of cross-sectional area of small pulmonary vessel in COPD: correlations with emphysema and airflow limitation. Acad Radiol 2010; 17: pp. 93-99.
25. Wells J.M., Washko G.R., Han M.K., et. al.: Pulmonary arterial enlargement and acute exacerbations of COPD. New England Journal of Medicine 2012; 367: pp. 913-921.
26. Estepar R.S., Kinney G.L., Black-Shinn J.L., et. al.: Computed tomographic measures of pulmonary vascular morphology in smokers and their clinical implications. Am J Respir Crit Care Med 2013; 188: pp. 231-239.
27. Lynch D.A., Al-Qaisi M.A.: Quantitative computed tomography in chronic obstructive pulmonary disease. J Thorac Imaging 2013; 28: pp. 284-290.
28. Galbán C.J., Han M.K., Boes J.L., et. al.: Computed tomography-based biomarker provides unique signature for diagnosis of COPD phenotypes and disease progression. Nat Med 2012; 18: pp. 1711-1715.
29. McDonough J.E., Yuan R., Suzuki M., et. al.: Small-airway obstruction and emphysema in chronic obstructive pulmonary disease. N Engl J Med 2011; 365: pp. 1567-1575.
30. Couper D., LaVange L.M., Han M., et. al.: Design of the Subpopulations and Intermediate Outcomes in COPD Study (SPIROMICS). Thorax 2013; thoraxjnl-2013–203897
31. Rabe K.F., Hurd S., Anzueto A., et. al.: Global strategy for the diagnosis, management, and prevention of chronic obstructive pulmonary disease: GOLD executive summary. American journal of respiratory and critical care medicine 2007; 176: pp. 532-555.
32. Sieren J.P., Newell J.D., Judy P.F., et. al.: Reference standard and statistical model for intersite and temporal comparisons of CT attenuation in a multicenter quantitative lung study. Medical physics 2012; 39: pp. 5757-5767.
33. Janssens J.P.: Aging of the respiratory system: impact on pulmonary function tests and adaptation to exertion. Clin Chest Med 2005; 26: pp. 469-484. vi-vii
34. Turner J.M., Mead J., Wohl M.E.: Elasticity of human lungs in relation to age. J Appl Physiol 1968; 25: pp. 664-671.
35. Hoffman E.A., Ahmed F.S., Baumhauer H., et. al.: Variation in the percent of emphysema-like lung in a healthy, nonsmoking multiethnic sample. The MESA Lung Study. Annals of the American Thoracic Society 2014; 11: pp. 898-907.
36. Barnes P.J.: New anti-inflammatory targets for chronic obstructive pulmonary disease. Nat Rev Drug Discov 2013; 12: pp. 543-559.