
Rationale and Objectives
Studies have demonstrated a relationship between mammographic parenchymal texture and breast cancer risk. Although promising, texture analysis in mammograms is limited by tissue superposition. Digital breast tomosynthesis (DBT) is a novel tomographic x-ray breast imaging modality that alleviates the effect of tissue superposition, offering superior parenchymal texture visualization compared to mammography. The aim of this study was to investigate the potential advantages of DBT parenchymal texture analysis for breast cancer risk estimation.
Materials and Methods
DBT and digital mammographic (DM) images of 39 women were analyzed. Texture features, shown in previous studies with mammograms to correlate with cancer risk, were computed from the retroareolar breast region. The relative performances of the DBT and DM texture features were compared in correlating with two measures of breast cancer risk: (1) the Gail and Claus risk estimates and (2) mammographic breast density. Linear regression was performed to model the association between texture features and increasing levels of risk.
Results
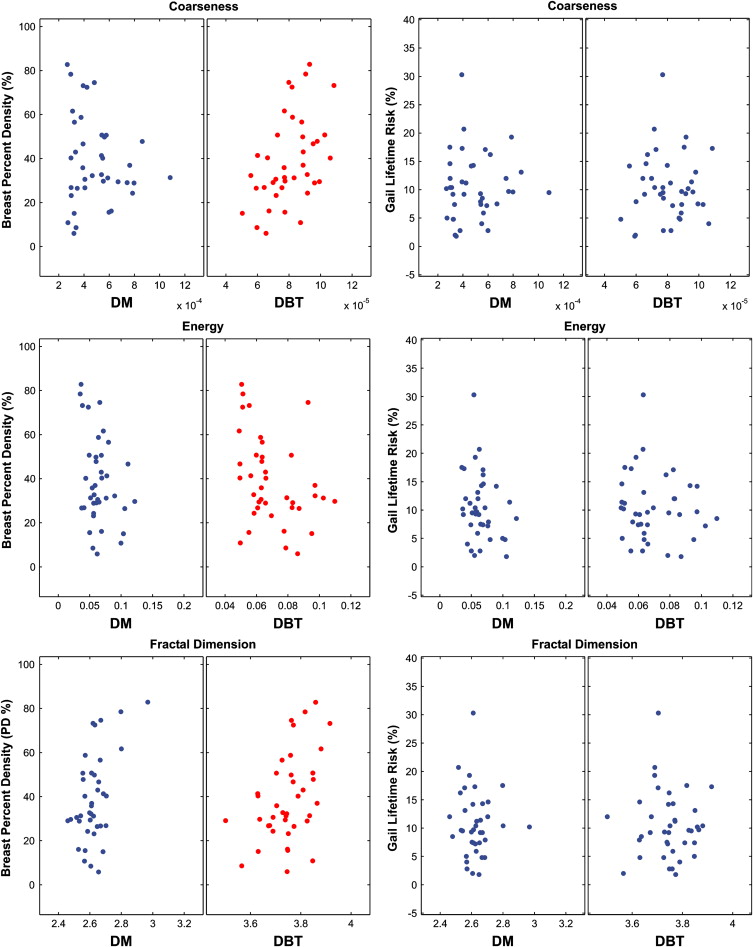
No significant correlation was detected between parenchymal texture and the Gail and Claus risk estimates. Significant correlations were observed between texture features and breast density. Overall, the DBT texture features demonstrated stronger correlations with breast percent density than DM features ( P ≤ .05). When dividing the study population into groups of increasing breast percent density, the DBT texture features appeared to be more discriminative, having regression lines with overall lower P values, steeper slopes, and higher R 2 estimates.
Conclusion
Although preliminary, the results of this study suggest that DBT parenchymal texture analysis could provide more accurate characterization of breast density patterns, which could ultimately improve breast cancer risk estimation.
The ability to estimate a woman’s risk of developing breast cancer risk is becoming increasingly important in clinical practice. Breast cancer risk assessment is used as a criterion to form guidelines for offering customized screening recommendations , to tailor individual breast cancer treatments , and to form preventive strategies , especially for women associated with higher risk. Currently, breast cancer risk assessment is limited both by the existing epidemiologic risk estimation models and by the breast imaging methods that have been considered to date.
The current gold standards for breast cancer risk estimation, the Gail and Claus models , are multivariate statistical models based primarily on nonmodifiable demographic, clinical, and hereditary risk factors. With the exception of childbirth as a modifiable risk factor, the Gail model estimates the risk for breast cancer on the basis of factors such as age at menarche, first-degree relatives with breast cancer, and number of prior biopsies . The Claus model relies on the assumption that susceptibility to breast cancer is regulated primarily by a rare autosomal dominant allele and therefore estimates the risk for breast cancer only on the basis of familial history of breast cancer, including ages at onset of relatives affected by breast cancer . Evaluation of the Gail model has shown that despite its good calibration for population-based risk assessment, it has modest discriminatory accuracy at the individual level . Studies evaluating the accuracy of models that predict genetic susceptibility to breast cancer, including the Claus model, have shown that there is a potential to overestimate the expected number of women at high risk for genetic mutations . Considering also that individual risk can be reduced by interventions such as chemoprevention , the Gail and Claus models lack the desired flexibility to estimate adjustments to risk levels.
Get Radiology Tree app to read full this article<
Get Radiology Tree app to read full this article<
Get Radiology Tree app to read full this article<
Get Radiology Tree app to read full this article<
 Open full size image
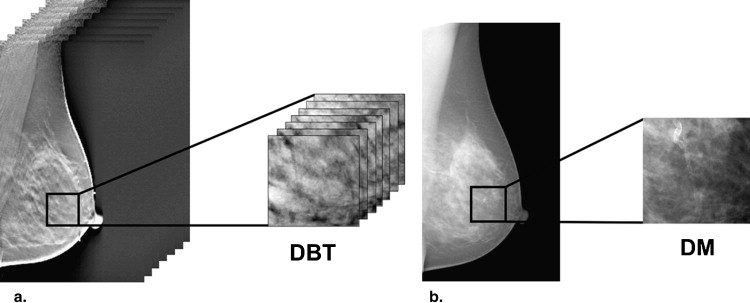
Figure 1
Illustrative example of (a) digital breast tomosynthesis acquisition geometry with (b) the reconstructed tomographic breast image. 3D , three-dimensional.
 Open full size image
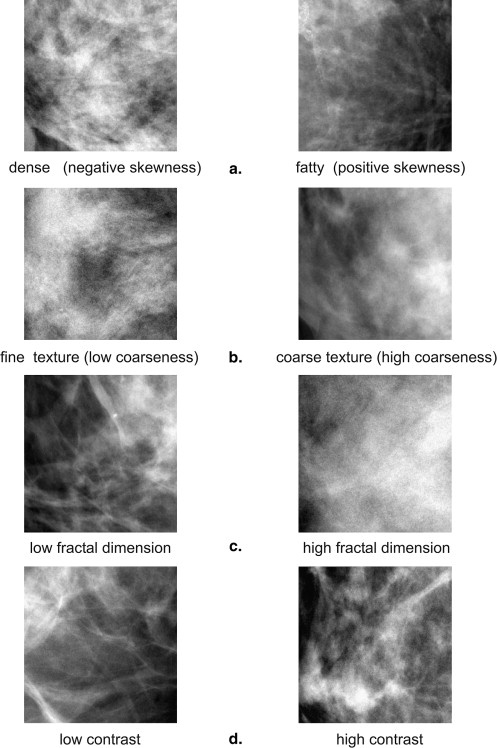
Figure 2
Differences in parenchymal texture in (a) a digital mammogram (DM) and (b,c) the digital breast tomosynthesis (DBT) tomographic slices for the same breast, where (b) the superficial skin layer is separated from (c) the deeper fibroglandular tissue layers.
Get Radiology Tree app to read full this article<
Get Radiology Tree app to read full this article<
Materials and methods
Patient Recruitment
Get Radiology Tree app to read full this article<
Get Radiology Tree app to read full this article<
∗ The goal of this clinical trial was to develop an understanding of the relative performance of new-generation breast imaging modalities. Eligible participants included women at high risk (>25% Gail and Claus lifetime risk), women with recently detected abnormalities, and previous patients with breast cancer undergoing follow-up. All women were volunteers who provided written informed consent. From March 2002 to August 2007, a total of 886 women enrolled in the trial. Within the same day, the women were imaged with digital mammography, whole-breast ultrasound, magnetic resonance imaging, positron emission tomography, and optical imaging. The individual imaging results were reviewed in a consensus meeting of expert radiologists to determine the relative performance of the breast imaging modalities; the associated clinical information for each woman, such as pathology, likelihood of malignancy, and Breast Imaging Reporting and Data System lesion characterization, was also recorded as part of the study. From August 2004 to August 2005, a prototype DBT system was operating under research investigation, and DBT was offered as an option to the women participating in the clinical trial. During this period, a total of 52 women agreed to also undergo DBT imaging.
Get Radiology Tree app to read full this article<
Breast Imaging
Get Radiology Tree app to read full this article<
Study Population and Risk Evaluation
Get Radiology Tree app to read full this article<
Get Radiology Tree app to read full this article<
Get Radiology Tree app to read full this article<
Get Radiology Tree app to read full this article<
Image Analysis
Get Radiology Tree app to read full this article<
Get Radiology Tree app to read full this article<
Get Radiology Tree app to read full this article<
Get Radiology Tree app to read full this article<
Get Radiology Tree app to read full this article<
Get Radiology Tree app to read full this article<
Tomographic (2D) Texture Analysis
Get Radiology Tree app to read full this article<
Get Radiology Tree app to read full this article<
skewness=w3w3/22,wk=∑gmaxi=0ni(i−i¯)k/N,N=∑gmaxi=0ni,i¯=∑gmaxi=0(ini/N), skewness
=
w
3
w
2
3
/
2
,
w
k
=
∑
i
=
0
g
max
n
i
(
i
−
i
¯
)
k
/
N
,
N
=
∑
i
=
0
g
max
n
i
,
i
¯
=
∑
i
=
0
g
max
(
i
n
i
/
N
)
,
where n__i represents the number of times that gray-level value i occurs in the image region, g__max is the maximum gray-level value, and N is the total number of image pixels.
Get Radiology Tree app to read full this article<
Get Radiology Tree app to read full this article<
coarseness=(∑gmaxi=0piv(i))−1andv(i)={∑∣∣i−L¯¯¯i∣∣fori∈{ni}ifni≠00otherwise}, coarseness
=
(
∑
i
=
0
g
max
p
i
v
(
i
)
)
−
1
and
v
(
i
)
=
{
∑
|
i
−
L
¯
i
|
for
i
∈
{
n
i
}
if
n
i
≠
0
0
otherwise
}
,
where v ( i ) is the NGTDM. In the above formulas, g__max is the maximum gray-level value, p__i is the probability that gray level i occurs, and { n__i } is the set of pixels having gray-level values equal to i , and L¯¯¯i L
¯
i is given by
L¯¯¯i=1S−1∑tk=−t∑tl=−tj(x+k,y+l), L
¯
i
=
1
S
−
1
∑
k
=
−
t
t
∑
l
=
−
t
t
j
(
x
+
k
,
y
+
l
)
,
where j ( x , y ) is the pixel located at ( x , y ) with gray-level value i , ( k , l ) ≠ (0,0), and S = (2 t + 1) 2 , with t = 1 specifying the neighborhood size around the pixel located at ( x , y ).
Get Radiology Tree app to read full this article<
Get Radiology Tree app to read full this article<
contrast=∑gmaxi=0∑gmaxj=0|i−j|2C(i,j), contrast
=
∑
i
=
0
g
max
∑
j
=
0
g
max
|
i
−
j
|
2
C
(
i
,
j
)
,
energy=∑gmaxi=0∑gmaxj=0C(i,j)2, energy
=
∑
i
=
0
g
max
∑
j
=
0
g
max
C
(
i
,
j
)
2
,
and
homogeneity=∑gmaxi=0∑gmaxj=0C(i,j)1+|i−j|, homogeneity
=
∑
i
=
0
g
max
∑
j
=
0
g
max
C
(
i
,
j
)
1
+
|
i
−
j
|
,
where g__max is the maximum gray-level value, and C is the normalized co-occurrence matrix . To optimize the computation of the gray-level co-occurrence statistics, gray-level quantization was implemented . The co-occurrence frequencies were calculated symmetrically in the four directions around each pixel using a displacement vector, d = ( dx , dy ), along x and y dimensions, where dx = dy = 1 pixel offset. The texture features calculated in each of these four directions were averaged to create a single measure that was used in our experiments.
Get Radiology Tree app to read full this article<
Get Radiology Tree app to read full this article<
F(u,v)=∑M−1m=0∑N−1n=0I(m,n)e−j(2π/M)ume−j(2π/N)vn,u=0,1,…M−1,v=0,1,…N−1, F
(
u
,
v
)
=
∑
m
=
0
M
−
1
∑
n
=
0
N
−
1
I
(
m
,
n
)
e
−
j
(
2
π
/
M
)
u
m
e
−
j
(
2
π
/
N
)
v
n
,
u
=
0
,
1
,
…
M
−
1
,
v
=
0
,
1
,
…
N
−
1
,
where I is the 2D image region of size ( M , N ), and u and v are the spatial frequencies in the x and y directions. The power spectral density, P , was estimated from F ( u , v ) as
P(u,v)=|F(u,v)|2. P
(
u
,
v
)
=
|
F
(
u
,
v
)
|
2
.
To compute the FD, P was averaged over radial slices spanning the FFT frequency domain. The frequency space was uniformly divided in 24 directions, with each direction uniformly sampled at 30 points along the radial component. To calculate the FD, the least-squares fit of log( P__f ) versus log( f ) was estimated, where f=u2+v2−−−−−−√ f
=
u
2
+
v
2 denotes the radial frequency . The FD is related to the slope, β, of this log-log plot by
FD=3DT+2−β2=8−β2, FD
=
3
D
T
+
2
−
β
2
=
8
−
β
2
,
where D__T is the topologic dimension, equal to 2 for a 2D image.
Get Radiology Tree app to read full this article<
Volumetric (3D) Texture Analysis
Get Radiology Tree app to read full this article<
Get Radiology Tree app to read full this article<
Get Radiology Tree app to read full this article<
L¯¯¯i=1S−1∑tk=−t∑tl=−t∑tq=−tj(x+k,y+l,z+q), L
¯
i
=
1
S
−
1
∑
k
=
−
t
t
∑
l
=
−
t
t
∑
q
=
−
t
t
j
(
x
+
k
,
y
+
l
,
z
+
q
)
,
where j ( x , y , z ) is the voxel located at ( x , y , z ) with gray-level value i , ( k , l , z ) ≠ (0,0,0), and S = (2 t + 1) 3 , with t = 1 specifying the 3D voxel window around ( x , y , z ).
Get Radiology Tree app to read full this article<
Get Radiology Tree app to read full this article<
Get Radiology Tree app to read full this article<
F(u,v,w)=∑M−1m=0∑N−1n=0∑K−1k=0I(m,n,k)e−j(2π/M)ume−j(2π/N)vne−j(2π/K)wk, F
(
u
,
v
,
w
)
=
∑
m
=
0
M
−
1
∑
n
=
0
N
−
1
∑
k
=
0
K
−
1
I
(
m
,
n
,
k
)
e
−
j
(
2
π
/
M
)
u
m
e
−
j
(
2
π
/
N
)
v
n
e
−
j
(
2
π
/
K
)
w
k
,
where I is the 3D image region of size ( M , N , K ), and u , v , and w are the spatial frequencies in the x , y , and z directions, respectively. The power spectral density was estimated as
P(u,v,w)=|F(u,v,w)|2. P
(
u
,
v
,
w
)
=
|
F
(
u
,
v
,
w
)
|
2
.
To compute the FD, P was averaged over radial sectors spanning the 3D FFT frequency domain. The frequency space was evenly divided in 24 azimuth and 12 zenith directions, and each direction was uniformly sampled at 30 points along the radial component. To calculate the FD, the least-squares fit of log( P__f ) versus log( f ) was estimated, where f=u2+v2+w2−−−−−−−−−−√ f
=
u
2
+
v
2
+
w
2 denotes the radial frequency in spherical coordinates . The FD is related to the slope, β, of this log-log plot as defined in Equation 7 , and for D__T = 3 in three dimensions:
FD=11−β2. FD
=
11
−
β
2
.
Get Radiology Tree app to read full this article<
Texture Association with Gail and Claus Risk
Get Radiology Tree app to read full this article<
Texture Association with Breast Density
Get Radiology Tree app to read full this article<
Get Radiology Tree app to read full this article<
Results
Descriptive Statistics
Get Radiology Tree app to read full this article<
Correlation Between DBT and DM Texture Features
Get Radiology Tree app to read full this article<
Table 1
Pearson’s Correlation Coefficients ( P Values) Between DBT and DM Parenchymal Texture Features
Variable 2D DBT vs DM 3D DBT vs DM 2D DBT vs 3D DBT Skewness −0.07 (.65) −0.08 (.59) 0.99 (<.001) Coarseness 0.37 (.02) 0.25 (.12) 0.97 (<.001) Contrast 0.46 (.003) 0.41 (.008) 0.98 (<.001) Energy 0.16 (.31) 0.37 (.02) 0.79 (<.001) Homogeneity 0.50 (<.001) 0.51 (<.001) 0.98 (<.001) Fractal dimension 0.73 (<.001) 0.27 (.09) 0.01 (.91)
DBT, digital breast tomosynthesis; DM, digital mammographic; 3D, three-dimensional; 2D, two-dimensional.
Get Radiology Tree app to read full this article<
Texture Correlation with Gail and Claus Risk Estimates
Get Radiology Tree app to read full this article<
Table 2
Pearson’s Correlation Coefficients ( P Values) Between DM and DBT Parenchymal Texture Features and the Gail and Claus Lifetime Breast Cancer Risk Estimates
Gail Risk Claus Risk Variable DM 2D DBT 3D DBT DM 2D DBT 3D DBT Skewness 0.01 (.97) 0.04 (.81) 0.05 (.74) −0.07 (.69) 0.32 (.05) ∗ 0.33 (.04) ∗ Coarseness 0.06 (.72) 0.03 (.83) 0.03 (.86) −0.08 (.61) 0.14 (.39) 0.15 (.35) Contrast 0.00 (.99) −0.03 (.86) −0.04 (.80) −0.11 (.50) −0.09 (.57) −0.10 (.55) Energy −0.24 (.14) −0.03 (.85) −0.11 (.50) −0.24 (.13) −0.20 (.13) −0.16 (.34) Homogeneity 0.01 (.95) 0.02 (.92) 0.02 (.88) 0.20 (.22) 0.09 (.60) 0.10 (.53) Fractal dimension 0.02 (.92) 0.19 (.24) −0.01 (.95) −0.02 (.88) −0.01 (.94) 0.03 (.85)
DBT, digital breast tomosynthesis; DM, digital mammography; 3D, three-dimensional; 2D, two-dimensional.
Get Radiology Tree app to read full this article<
Get Radiology Tree app to read full this article<
Texture Correlation with Breast Density
Get Radiology Tree app to read full this article<
Table 3
Pearson’s Correlation Coefficients ( P Values) Between DM and DBT Parenchymal Texture Features and Breast PD
Breast PD Variable DM 2D DBT 3D DBT Skewness −0.18 (.26) 0.18 (.26) 0.18 (.26) Coarseness −0.15 (.34) 0.40 (.01) 0.46 (.003) Contrast −0.25 (.13) −0.23 (.15) −0.31 (.05) Energy −0.29 (.07) −0.20 (.21) −0.36 (.03) Homogeneity 0.39 (.01) 0.16 (.32) 0.26 (.11) Fractal dimension 0.50 (.001) 0.23 (.16) 0.45 (.004)
DBT, digital breast tomosynthesis; DM, digital mammographic; PD, percent density; 3D, three-dimensional; 2D, two-dimensional.
Get Radiology Tree app to read full this article<
Get Radiology Tree app to read full this article<
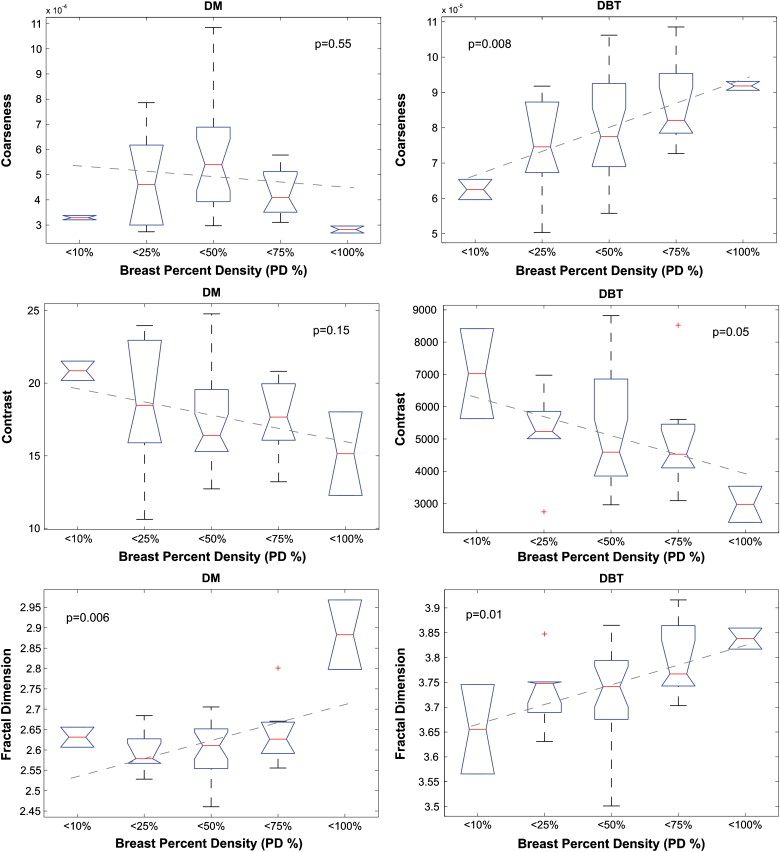
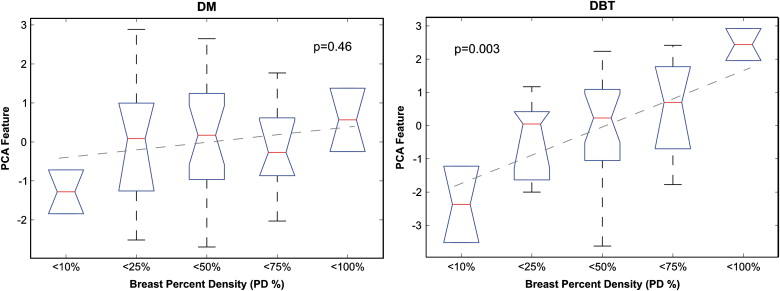
Table 4
Beta b Coefficients, R 2 Values, and P Values for the Fitted Regression Models of Each DM and DBT Texture Descriptor
DM 3D DBT Variable_b__R_ 2 P__b__R 2 P Skewness −0.08 0.01 .50 0.06 0.03 .33 Coarseness −0.2 × 10 −4 0.01 .55 0.7×10 −5 0.17 .008 Contrast −0.91 0.05 .15 −588 0.10 .05 Energy −0.006 0.06 .14 −0.005 0.07 .09 Homogeneity 0.005 0.10 .04 0.009 0.08 .09 Fractal dimension 0.04 0.18 .006 0.04 0.16 .01 PCA 0.19 0.01 .46 0.84 0.21 .003
DBT, digital breast tomosynthesis; DM, digital mammography; PCA, principal-component analysis; 3D, three-dimensional.
Get Radiology Tree app to read full this article<
Discussion
Get Radiology Tree app to read full this article<
Get Radiology Tree app to read full this article<
Get Radiology Tree app to read full this article<
Get Radiology Tree app to read full this article<
Get Radiology Tree app to read full this article<
Get Radiology Tree app to read full this article<
Get Radiology Tree app to read full this article<
Get Radiology Tree app to read full this article<
Get Radiology Tree app to read full this article<
Acknowledgments
Get Radiology Tree app to read full this article<
Get Radiology Tree app to read full this article<
References
1. Lehman C.D., Blume J.D., Weatherall P., et. al.: Screening women at high risk for breast cancer with mammography and magnetic resonance imaging. Cancer 2005; 103: pp. 1898-1905.
2. Lehman C.D., Isaacs C., Schnall M.D., et. al.: Cancer yield of mammography, MR, and US in high-risk women: prospective multi-institution breast cancer screening study. Radiology 2007; 224: pp. 381-388.
3. Smith K.L., Isaacs C.: Management of women at increased risk for hereditary breast cancer. Breast Dis 2006–2007; 27: pp. 51-67.
4. Gail M.H., Brinton L.A., Byar D.P., et. al.: Projecting individualized probabilities of developing breast cancer for white females who are being examined annually. J Natl Cancer Inst 1989; 81: pp. 1879-1886.
5. Claus E.B., Risch N., Thompson W.D., Carter D.: Relationship between breast histopathology and family history of breast cancer. Cancer 1993; 71: pp. 147-153.
6. Rockhill B., Spiegelman D., Byrne C., Hunter D.J., Colditz G.A.: Validation of the Gail et al. model of breast cancer risk prediction and implications for chemoprevention. J Natl Cancer Inst 2001; 93: pp. 358-366.
7. Jones J.L., Hughes K.S., Kopans D.B., et. al.: Evaluation of hereditary risk in a mammography population. Clin Breast Cancer 2005; 6: pp. 38-44.
8. Fisher B., Costantino J.P., Wickerham D.L., et. al.: Tamoxifen for the prevention of breast cancer: current status of the National Surgical Adjuvant Breast and Bowel Project P-1 study. J Natl Cancer Inst 2005; 97: pp. 1652-1662.
9. Chlebowski R.T., McTiernan A.: Biological significance of interventions that change breast density. J Natl Cancer Inst 2003; 95: pp. 4-5.
10. Greendale G.A., Reboussin B.A., Slone S., Wasilauskas C., Pike M.C., Ursin G.: Postmenopausal hormone therapy and change in mammographic density. J Natl Cancer Inst 2003; 95: pp. 30-37.
11. Byrne C., Schairer C., Wolfe J., et. al.: Mammographic features and breast cancer risk: effects with time, age, and menopause status. J Natl Cancer Inst 1995; 87: pp. 1622-1629.
12. Fabian C.J., Kimler B.F.: Mammographic density: use in risk assessment and as a biomarker in prevention trials. J Nutr 2006; 136: pp. 2705S-2708S.
13. Wolfe J.N.: Risk for breast cancer development determined by mammographic parenchymal pattern. Cancer 1976; 37: pp. 2486-2492.
14. McCormack V.A., dos Santos Silva I.: Breast density and parenchymal patterns as markers of breast cancer risk: a meta-analysis. Cancer Epidemiol Biomarker Prev 2006; 15: pp. 1159-1169.
15. Kaufhold J., Thomas J.A., Eberhard J.W., Galbo C.E., Trotter D.E.: A calibration approach to glandular tissue composition estimation in digital mammography. Med Phys 2002; 28: pp. 1867-1880.
16. Heine J.J., Malhotra P.: Mammographic tissue, breast cancer risk, serial image analysis, and digital mammography. Part 1. Tissue and related risk factors. Acad Radiol 2002; 9: pp. 298-316.
17. Heine J.J., Malhotra P.: Mammographic tissue, breast cancer risk, serial image analysis, and digital mammography. Part 2. Serial breast tissue change and related temporal influences. Acad Radiol 2002; 9: pp. 317-335.
18. Martin L.J., Boyd N.F.: Mammographic density. Potential mechanisms of breast cancer risk associated with mammographic density: hypotheses based on epidemiological evidence. Breast Cancer Res 2008; 10: pp. 201.
19. Boyd N.F., Guo H., Martin L.J., et. al.: Mammographic density and the risk and detection of breast cancer. N Engl J Med 2007; 356: pp. 227-236.
20. Vachon C.M., van Gils C.H., Sellers T.A., et. al.: Mammographic density, breast cancer risk and risk prediction. Breast Cancer Res 2007; 9: pp. 217.
21. Harvey J.A., Bovbjerg V.E.: Quantitative assessment of mammographic breast density: relationship with breast cancer risk. Radiology 2004; 230: pp. 29-41.
22. Tice J.A., Cummings S.R., Ziv E., Kerlikowske K.: Mammographic breast density and the Gail model for breast cancer risk prediction in a screening population. Breast Cancer Res Treat 2005; 94: pp. 115-122.
23. Chen J., Pee D., Ayyagari R., et. al.: Projecting absolute invasive breast cancer risk in white women with a model that includes mammographic density. J Natl Cancer Inst 2006; 98: pp. 1215-1226.
24. Tice J.A., Cummings S.R., Smith-Bindman R., Ichikawa L., Barlow W.E., Kerlikowske K.: Using clinical factors and mammographic breast density to estimate breast cancer risk: development and validation of a new predictive model. Ann Intern Med 2008; 148: pp. 337-347.
25. Caldwell C.B., Stapleton S.J., Holdsworth D.W., et. al.: Characterization of mammographic parenchymal pattern by fractal dimension. Phys Med Biol 1990; 35: pp. 235-247.
26. Tahoces P.G., Correa J., Souto M., Gomez L., Vidal J.J.: Computer-assisted diagnosis: the classification of mammographic breast parenchymal patterns. Phys Med Biol 1995; 40: pp. 103-117.
27. Huo Z., Giger M.L., Wolverton D.E., Zhong W., Cumming S., Olopade O.I.: Computerized analysis of mammographic parenchymal patterns for breast cancer risk assessment: feature selection. Med Phys 2000; 27: pp. 4-12.
28. Huo Z., Giger M.L., Olopade O.I., et. al.: Computerized analysis of digitized mammograms of BRCA1 and BRCA2 gene mutation carriers. Radiology 2002; 225: pp. 519-526.
29. Li H., Giger M.L., Olopade O.I., Margolis A., Lan L., Chinander M.R.: Computerized texture analysis of mammographic parenchymal patterns of digitized mammograms. Acad Radiol 2005; 12: pp. 863-873.
30. Li H., Giger M.L., Huo Z., et. al.: Computerized analysis of mammographic parenchymal patterns for assessing breast cancer risk: effect of ROI size and location. Med Phys 2004; 31: pp. 549-555.
31. Li H., Giger M.L., Olopade O.I., Lan L.: Fractal analysis of mammographic parenchymal patterns in breast cancer risk assessment. Acad Radiol 2007; 14: pp. 513-521.
32. Kopans D.B.: Basic physics and doubts about relationship between mammographically determined tissue density and breast cancer risk. Radiology 2008; 246: pp. 348-353.
33. Niklason L.T., Christian B.T., Niklason L.E., et. al.: Digital tomosynthesis in breast imaging. Radiology 1997; 205: pp. 399-406.
34. Park J.M., Franken E.A., Garg M., Fajardo L.L., Niklason L.T.: Breast tomosynthesis: present considerations and future applications. RadioGraphics 2007; 27: pp. S231-S240.
35. Rafferty E.A.: Digital mammography: novel applications. Radiol Clin North Am 2007; 45: pp. 831-843.
36. Poplack S.P., Tosteson T.D., Kogel C.A., Nagy H.M.: Digital breast tomosynthesis: initial experience in 98 women with abnormal digital screening mammography. AJR Am J Roentgenol 2007; 189: pp. 616-623.
37. American College of Radiology.2003.American College of Radiology
38. Kontos D., Bakic P.R., Maidment A.D.A.: Analysis of parenchymal texture properties in breast tomosynthesis images.Giger M.L.Karssemeijer N.SPIE medical imaging: computer aided diagnosis.2007.SPIESan Diego, CA:pp. 6514.
39. Bakic P.R., Kontos D., Zhang C., Yaffe M.J., Maidment A.D.A.: Analysis of percent density estimates from digital breast tomosynthesis projection images.Giger M.L.Karssemeijer N.SPIE medical imaging: computer aided diagnosis.2007.SPIESan Diego, CA:pp. 6514.
40. Wu T., Moore R.H., Rafferty E.A., Kopans D.B.: A comparison of reconstruction algorithms for breast tomosynthesis. Med Phys 2004; 31: pp. 2636-2647.
41. Radiological Society of North America. The RSNA Medical Imaging Resource Center (MIRC). Available at: http://www.rsna.org/mirc/ Accessed May 13, 2007
42. Kontos D., Bakic P.R., Maidment A.D.A.: Texture in digital breast tomosynthesis: a comparison between mammographic and tomographic characterization of parenchymal properties.Giger M.L.Karssemeijer N.SPIE medical imaging: computer aided diagnosis.2007.SPIESan Diego, CA:pp. 6915.
43. National Cancer Institute : Breast Cancer Risk Assessment Tool. Available at: http://www.cancer.gov/bcrisktool/ Accessed October 10, 2008
44. Byng J.W., Yaffe M.J., Jong R.A., et. al.: Analysis of mammographic density and breast cancer risk from digitized mammograms. RadioGraphics 1998; 18: pp. 1587-1598.
45. Byng J.W., Boyd N.F., Fishell E., Jong R.A., Yaffe M.J.: The quantitative analysis of mammographic densities. Phys Med Biol 1994; 39: pp. 1629-1638.
46. Bakic P.R., Kontos D., Carton A.K., Maidment A.D.A.: Breast percent density estimation from 3D reconstructed digital breast tomosynthesis images.Hsieh J.Samei E.SPIE medical imaging: physics of medical imaging.2008.SPIESan Diego, CA:pp. 6913.
47. Bakic PR, Carton AK, Zhang C, Yaffe M, Maidment ADA. Inter- and intra-observer agreement in breast percent density estimation from mammograms and central DBT projections. Presented at: Annual meeting of the Radiological Society of North America; Chicago, IL; 2007.
48. Li H., Giger M.L., Olopade O.I., Chinander M.R.: Power spectral analysis of mammographic parenchymal patterns for breast cancer risk assessment. J Digit Imaging 2008; 21: pp. 145-152.
49. Amadasum M., King R.: Textural features corresponding to textural properties. IEEE Trans Syst Man Cybernet 1989; 19: pp. 1264-1274.
50. Castellano G., Bonilha L., Li L.M., Cendes F.: Texture analysis of medical images. Clin Radiol 2004; 59: pp. 1061-1069.
51. Kurani A, Xu D-H, Furst J, Raicu D. Co-occurence matrices for volumetric data. Presented at: 7th IASTED International Conference on Computer Graphics and Imaging; 2004.
52. Mahmoud-Ghoneim D., Toussaint G., Constans J.M., de Certaines J.D.: Three dimensional texture analysis in MRI: a preliminary evaluation in gliomas. Magn Res Imaging 2003; 21: pp. 983-987.
53. Showalter C., Clymer B.D., Richmond B., Powell K.: Three-dimensional texture analysis of cancellous bone cores evaluated at clinical CT resolutions. Osteoporos Int 2006; 17: pp. 259-266.
54. Chen W., Giger M.L., Li H., Bick U., Newstead G.M.: Volumetric texture analysis of breast lesions on contrast-enhanced magnetic resonance images. Magn Reson Med 2007; 58: pp. 562-571.
55. Haralick R.M., Shanmugam K., Dinstein I.: Textural features for image classification. IEEE Trans Syst Man Cybernet 1973; 3: pp. 610-621.
56. Russ J.C.: Fractal surfaces.1994.PlenumNew York
57. Petrie A., Sabin C.: Medical statistics at a glance.2000.BlackwellOxford, UK
58. Glantz S.: Primer of biostatistics.2005.McGraw-HillNew York
59. Duda R., Hart P., Stork D.: Pattern classification.2000.John WileyNew York
60. Rousseau R.: Jaccard similarity leads to the Marczewski-Steinhaus topology for information retrieval. Inform Process Manage 1998; 34: pp. 87-94.
61. Martin K.E., Helvie M.A., Zhou C., et. al.: Mammographic density measured with quantitative computer-aided method: comparison with radiologists’ estimates and BI-RADS categories. Radiology 2006; 240: pp. 656-665.
62. Zhou C., Chan H.P., Petrick N., et. al.: Computerized image analysis: estimation of breast density on mammograms. Med Phys 2001; 28: pp. 1056-1069.
63. Kovalev V., Petrou M.: Texture anisotropy in 3-D images. IEEE Trans Image Process 1999; 8: pp. 346-360.
64. Kontos D., Zhang C., Ruiter N.V., Bakic P.R., Maidment A.D.A.: Evaluating the effect of tomosynthesis acquisition parameters on image texture: a study based on an anthropomorphic breast tissue software model.Krupinski E.A.International Workshop on Digital Mammography (IWDM) 2008.2008.Springer-VerlagBerlin, Germany::pp. 491-498.
65. Palomares M.R., Machia J.R., Lehman C.D., Daling J.R., McTiernan A.: Mammographic density correlation with Gail model breast cancer risk estimates and component risk factors. Cancer Epidemiol Biomarker Prevent 2006; 15: pp. 1324-1330.
66. Santen R.J., Boyd N.F., Chlebowski R.T., et. al.: Critical assessment of new risk factors for breast cancer: considerations for development of an improved risk prediction model. Endocrine Relat Cancer 2007; 14: pp. 169-187.
67. Karellas A.: Mammographic pattern analysis: an emerging risk assessment tool. Acad Radiol 2007; 14: pp. 511-512.
68. Kerlikowske K.: The mammogram that cried Wolfe. N Engl J Med 2007; 356: pp. 297-300.
69. Barlow W.E., White E., Ballard-Barbash R., et. al.: Prospective breast cancer risk prediction model for women undergoing screening mammography. J Natl Cancer Inst 2006; 98: pp. 1204-1214.
70. Zhang Y., Chan H.P., Sahiner B., et. al.: A comparative study of limited-angle cone-beam reconstruction methods for breast tomosynthesis. Med Phys 2006; 33: pp. 3781-3795.
71. Rafferty E.A.: Tomosynthesis: new weapon in breast cancer fight. Decis Imaging Econ 2004; pp. 17.