
Rationale and Objectives
Early-stage diagnosis of Parkinson’s disease (PD) is essential in making decisions related to treatment and prognosis. However, there is no specific diagnostic test for the diagnosis of PD. The aim of this study was to evaluate the role of texture analysis (TA) of magnetic resonance images in detecting subtle changes between the hemispheres in various brain structures in patients with early symptoms of parkinsonism. In addition, functional TA parameters for detecting textural changes are presented.
Materials and Methods
Fifty-one patients with symptoms of PD and 20 healthy controls were imaged using a 3-T magnetic resonance device. Co-occurrence matrix–based TA was applied to detect changes in textures between the hemispheres in the following clinically interesting areas: dentate nucleus, basilar pons, substantia nigra, globus pallidus, thalamus, putamen, caudate nucleus, corona radiata, and centrum semiovale. The TA results were statistically evaluated using the Mann-Whitney U test.
Results
The results showed interhemispheric textural differences among the patients, especially in the area of basilar pons and midbrain. Concentrating on this clinically interesting area, the four most discriminant parameters were defined: co-occurrence matrix correlation, contrast, difference variance, and sum variance. With these parameters, differences were also detected in the dentate nucleus, globus pallidus, and corona radiata.
Conclusions
On the basis of this study, interhemispheric differences in the magnetic resonance images of patients with PD can be identified by the means of co-occurrence matrix–based TA. The detected areas correlate with the current pathophysiologic and neuroanatomic knowledge of PD.
Parkinson’s disease (PD) is a progressive disorder of the central nervous system. Signs of PD include rest tremor, bradykinesia, rigidity, and the loss of postural reflexes . There is no specific diagnostic test for PD, and therefore the disease is diagnosed on the basis of clinical symptoms. Early-stage diagnosis of PD or other degenerative causes of parkinsonism is essential for deciding on treatment and prognosis, but early-stage disease may be difficult to recognize because it usually begins subtly. In addition, diagnosis is complicated because symptoms of other neurologic conditions resemble those of PD.
Among other symptoms, PD is characterized pathophysiologically by the loss of dopaminergic neurons in the substantia nigra (SN) pars compacta . The structure participates in controlling voluntary movements, and when information transfer is disturbed by the loss of neurotransmitter dopamine, the consequences can be seen as symptoms of PD . The identification of the midbrain dopaminergic regions is useful for evaluating the structural changes associated with PD .
Get Radiology Tree app to read full this article<
Get Radiology Tree app to read full this article<
Get Radiology Tree app to read full this article<
Get Radiology Tree app to read full this article<
Materials and methods
Patients and Controls
Get Radiology Tree app to read full this article<
Get Radiology Tree app to read full this article<
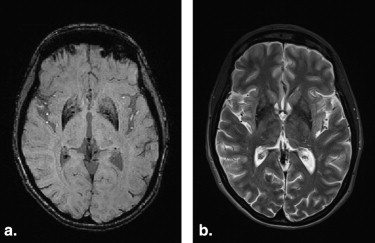
MRI
Get Radiology Tree app to read full this article<
Table 1
MRI Sequences and Imaging Parameters for Patients and Controls at 3 T
Sequence TR (ms) TE (ms) TI (ms) Slice Thickness (mm)/Slice Gap (mm) Matrix Size (Pixels) FOV (mm) Flip Angle (°) Axial T2-weighted SPACE 3200 354 — 3.0/0 384 × 290 230 120 Axial 3D SWI 27 20 — 1.5/0 256 × 128 230 15
FOV, field of view; MRI, magnetic resonance imaging; SPACE, sampling perfection with application-optimized contrasts using different flip-angle evolutions; SWI, susceptibility-weighted imaging; TE, echo time; TI, inversion time; TR, repetition time.
Get Radiology Tree app to read full this article<
Image Selection
Get Radiology Tree app to read full this article<
Get Radiology Tree app to read full this article<
Region of Interest (ROI) Localization
Get Radiology Tree app to read full this article<
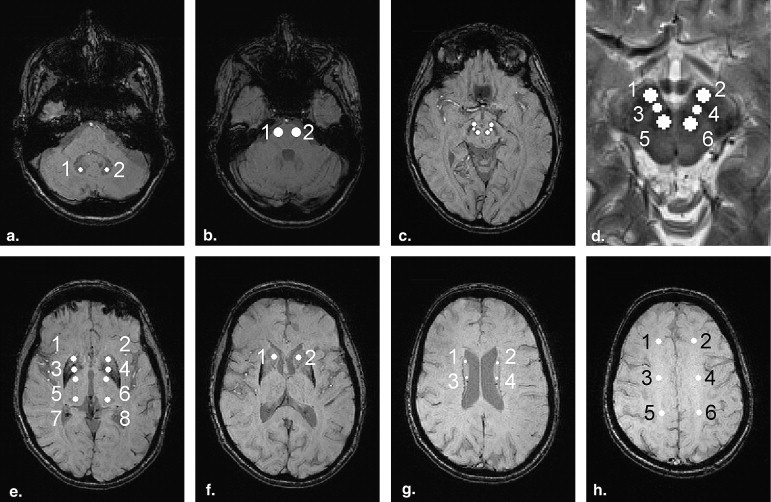
Table 2
Image Levels and ROIs
Level ROI 1 ROI 2 ROI 3 ROI 4 ROI 5 ROI 6 ROI 7 ROI 8 Axial 1 Dentate nucleus dex Dentate nucleus sin Axial 2 Basilar pons dex Basilar pons sin Axial 3 SN pars reticulata dex SN pars reticulata sin SN pars compacta dex SN pars compacta sin Red nucleus dex Red nucleus sin Axial 4 Putamen dex Putamen sin Globus pallidus dex Globus pallidus sin Thalamus ant dex Thalamus ant sin Thalamus post dex Thalamus post sin Axial 5 Caudate nucleus dex Caudate nucleus sin Axial 6 Corona radiata ant dex Corona radiata ant sin Corona radiata post dex Corona radiata post sin Axial 7 Centrum semiovale ant dex Centrum semiovale ant sin Centrum semiovale med dex Centrum semiovale med sin Centrum semiovale post dex Centrum semiovale post sin
Ant, anterior; dex, dexter; post, posterior; ROI, region of interest; sin, sinister; SN, substantia nigra.
Get Radiology Tree app to read full this article<
TA
Get Radiology Tree app to read full this article<
Get Radiology Tree app to read full this article<
Statistical Analysis
Get Radiology Tree app to read full this article<
Results
Textural Differences Between Hemispheres Using All COM Parameters
Get Radiology Tree app to read full this article<
Table 3
Occurrence of Significant P Values (P < .01) When Comparing Tissues Between Hemispheres Using COM Parameters Calculated in Different Directions Among Patients (n = 51)
Structure SPACE SWI Horizontal and Vertical Diagonals Horizontal and Vertical Diagonals_n_ Occurrence of Significant P Values_n_ Occurrence of Significant P Values_n_ Occurrence of Significant P Values_n_ Occurrence of Significant P Values Dentate nucleus 110 ○ 66 ○ 110 ○ 66 ○ Basilar pons 110 ○ 110 ● 110 ○ 110 ○ SN pars reticulata 44 ○ 66 ○ 110 ○ 66 ○ SN pars compacta 110 ○ 22 ● 44 ○ 22 ● Red nucleus 110 ○ 66 ○ 110 ○ 66 ○ Putamen 110 ○ 110 ○ 110 ○ 110 ○ Globus pallidus 110 ○ 110 ○ 110 ○ 110 ○ Thalamus ant 110 ○ 110 ○ 110 ○ 110 ● Thalamus post 110 ○ 110 ○ 110 ○ 110 ○ Caudate nucleus 110 ○ 110 ● 110 ○ 110 ○ Corona radiata ant 44 ○ 22 ○ 44 ○ 22 ○ Corona radiata post 44 ○ 22 ○ 44 ○ 22 ○ Centrum semiovale ant 110 ○ 110 ○ 110 ○ 110 ○ Centrum semiovale med 110 ○ 110 ○ 110 ○ 110 ○ Centrum semiovale post 110 ○ 110 ○ 110 ○ 110 ○
In structures marked with black circles (●), ≥40% of the evaluated parameters had P values < .01. White circles (○) indicate that <40% of the parameters showed significant changes in the region.
Ant, anterior; co-occurrence matrix; n , number of analyzed texture parameters; post, posterior; SN, substantia nigra; SPACE, sampling perfection with application-optimized contrasts using different flip-angle evolutions; SWI, susceptibility-weighted imaging.
Get Radiology Tree app to read full this article<
Get Radiology Tree app to read full this article<
TA Results From Clinically Significant Areas in Patient Images
Get Radiology Tree app to read full this article<
Table 4
Occurrence of Significant P Values (P < .01) When Comparing Tissues Between Hemispheres Using Selected COM Parameters Calculated in Diagonal Directions Among Patients (n = 51)
Structure_n_ SPACE SWI Occurrence of Significant P Values Correlation Contrast Difference Variance Sum Variance Correlation Contrast Difference Variance Sum Variance Dentate nucleus 6 ● ● ● ○ ○ ○ ○ ○ Basilar pons 10 ● ● ● ● ○ ● ● ○ SN pars reticulata 6 ● ● ○ ○ ● ● ● ● SN pars compacta 2 ● ● ● ● ● ○ ● ● Red nucleus 6 ○ ○ ○ ○ ● ● ○ ● Putamen 10 ○ ○ ○ ○ ○ ○ ○ ○ Globus pallidus 10 ● ● ○ ● ○ ○ ○ ○ Thalamus ant 10 ● ● ● ● ● ● ● ● Thalamus post 10 ○ ○ ○ ○ ○ ○ ○ ○ Caudate nucleus 10 ● ● ● ● ○ ○ ○ ○ Corona radiata ant 2 ○ ○ ○ ○ ○ ○ ○ ○ Corona radiata post 2 ○ ○ ○ ○ ● ● ● ● Centrum semiovale ant 10 ○ ○ ○ ○ ○ ○ ○ ○ Centrum semiovale med 10 ○ ○ ○ ○ ○ ○ ○ ○ Centrum semiovale post 10 ○ ○ ○ ○ ○ ○ ○ ○
In structures marked with black circles (●), ≥40% of the evaluated parameters had P values < .01. White circles (○) indicate that <40% of the parameters showed significant changes in the region.
Ant, anterior; co-occurrence matrix; n , number of analyzed texture parameters; post, posterior; SN, substantia nigra; SPACE, sampling perfection with application-optimized contrasts using different flip-angle evolutions; SWI, susceptibility-weighted imaging.
Get Radiology Tree app to read full this article<
Get Radiology Tree app to read full this article<
Get Radiology Tree app to read full this article<
TA Results From the Control Group Using the Four Most Discriminative Parameters
Get Radiology Tree app to read full this article<
Table 5
Occurrence of Significant P Values (P < .01) When Comparing Tissues Between Hemispheres Using Selected COM Parameters Calculated in Diagonal Directions Among Healthy Controls (n = 20)
Structure_n_ SPACE SWI Occurrence of Significant P Values Correlation Contrast Difference Variance Sum Variance Correlation Contrast Difference Variance Sum Variance Dentate nucleus 6 ○ ● ○ ○ ○ ○ ○ ○ Basilar pons 10 ● ● ● ● ○ ○ ○ ○ SN pars reticulata 6 ○ ○ ○ ○ ○ ● ○ ○ SN pars compacta 2 ● ● ● ● ● ● ● ● Red nucleus 6 ○ ○ ○ ○ ○ ○ ○ ○ Putamen 10 ○ ○ ○ ○ ○ ○ ○ ○ Globus pallidus 10 ○ ○ ○ ○ ○ ○ ○ ○ Thalamus ant 10 ○ ○ ○ ○ ● ● ● ○ Thalamus post 10 ○ ○ ○ ○ ○ ● ○ ○ Caudate nucleus 10 ● ● ● ● ○ ○ ○ ○ Corona radiata ant 2 ○ ○ ○ ○ ○ ○ ○ ○ Corona radiata post 2 ● ○ ○ ● ○ ○ ○ ○ Centrum semiovale ant 10 ○ ○ ○ ○ ○ ○ ○ ○ Centrum semiovale med 10 ○ ○ ○ ○ ○ ○ ○ ○ Centrum semiovale post 10 ○ ○ ○ ○ ○ ○ ○ ○
In structures marked with black circles (●), ≥40% of the evaluated parameters had P values < .01. White circles (○) indicate that <40% of the parameters showed significant changes in the region.
Ant, anterior; co-occurrence matrix; n , number of analyzed texture parameters; post, posterior; SN, substantia nigra; SPACE, sampling perfection with application-optimized contrasts using different flip-angle evolutions; SWI, susceptibility-weighted imaging.
Get Radiology Tree app to read full this article<
Get Radiology Tree app to read full this article<
Discussion
Get Radiology Tree app to read full this article<
Get Radiology Tree app to read full this article<
Get Radiology Tree app to read full this article<
Get Radiology Tree app to read full this article<
Get Radiology Tree app to read full this article<
Get Radiology Tree app to read full this article<
Get Radiology Tree app to read full this article<
Get Radiology Tree app to read full this article<
Get Radiology Tree app to read full this article<
Get Radiology Tree app to read full this article<
Get Radiology Tree app to read full this article<
Conclusions
Get Radiology Tree app to read full this article<
Get Radiology Tree app to read full this article<
Get Radiology Tree app to read full this article<
Get Radiology Tree app to read full this article<
References
1. Lees A.J., Hardy J., Revesz T.: Parkinson’s disease. Lancet 2009; 373: pp. 2055-2066.
2. Hornykiewicz O.: Parkinson’s disease: from brain homogenate to treatment. Fed Proc 1973; 32: pp. 183-190.
3. Hornykiewicz O.: Biochemical aspects of Parkinson’s disease. Neurology 1998; 51: pp. S2-S9.
4. Eapen M., Zald D.H., Gatenby J.C., et. al.: Using high-resolution MR imaging at 7T to evaluate the anatomy of the midbrain dopaminergic system. AJNR Am J Neuroradiol 2010; 32: pp. 688-694.
5. Graham J.M., Paley M.N.J., Grünewald R.A., et. al.: Brain iron deposition in Parkinson’s disease imaged using the PRIME magnetic resonance sequence. Brain 2000; 123: pp. 2423-2431.
6. Brar S., Henderson D., Schenck J., et. al.: Iron accumulation in the substantia nigra of patients with Alzheimer disease and parkinsonism. Arch Neurol 2009; 66: pp. 371-374.
7. Vymazal J., Righini A., Brooks R.A., et. al.: T1 and T2 in the brain of healthy subjects, patients with Parkinson disease, and patients with multiple system atrophy: relation to iron content. Radiology 1999; 211: pp. 489-495.
8. Zhang J., Zhang Y., Wang J., et. al.: Characterizing iron deposition in Parkinson’s disease using susceptibility-weighted imaging: an in vivo MR study. Brain Res 2010; 1330: pp. 124-130.
9. Martin W.R., Wieler M., Gee M.: Midbrain iron content in early Parkinson disease: A potential biomarker of disease status. Neurology 2008; 70: pp. 1411-1417.
10. Dexter D.T., Carayon A., Javoy-Agid F., et. al.: Alterations in the levels of iron, ferritin and other trace metals in Parkinson’s disease and other neurodegenerative diseases affecting the basal ganglia. Brain 1991; 114: pp. 1953-1975.
11. Wallis L.I., Paley M.N.J., Graham J.M., et. al.: MRI assessment of basal ganglia iron deposition in Parkinson’s disease. J Magn Reson Imaging 2008; 28: pp. 1061-1067.
12. Youdim M.B., Riederer P.: The role of iron in senescence of dopaminergic neurons in Parkinson’s disease. J Neural Transm Suppl 1993; 40: pp. 57-67.
13. Ryvlin P., Broussolle E., Piollet H., et. al.: Magnetic resonance imaging evidence of decreased putamenal iron content in idiopathic Parkinson’s disease. Arch Neurol 1995; 52: pp. 583-588.
14. Antonini A., Leenders K.L., Meier D., et. al.: T2 relaxation time in patients with Parkinson’s disease. Neurology 1993; 43: pp. 697-700.
15. Griffiths P.D., Dobson B.R., Jones G.R., et. al.: Iron in the basal ganglia in Parkinson’s disease. Brain 1999; 122: pp. 667-673.
16. Menke R.A., Scholz J., Miller K.L., et. al.: MRI characteristics of the substantia nigra in Parkinson’s disease: a combined quantitative T1 and DTI study. Neuroimage 2009; 47: pp. 435-441.
17. Drayer B., Burger P., Darwin R., et. al.: MRI of brain iron. AJR Am J Roentgenol 1986; 147: pp. 103-110.
18. Martin W.R., Roberts T.E., Ye F.Q., et. al.: Increased basal ganglia iron in striatonigral degeneration: In vivo estimation with magnetic resonance. Can J Neurol Sci 1998; 25: pp. 44-47.
19. Kosta P., Argyropoulou M.I., Markoula S., et. al.: MRI evaluation of the basal ganglia size and iron content in patients with Parkinson’s disease. J Neurol 2006; 253: pp. 26-32.
20. Piccini P., Brooks D.J.: New developments of brain imaging for Parkinson’s disease and related disorders. Movement Disord 2006; 21: pp. 2035-2041.
21. Lee C.S., Schulzer M., Mak E., et. al.: Patterns of asymmetry do not change over the course of idiopathic parkinsonism: implications for pathogenesis. Neurology 1995; 45: pp. 435-439.
22. Lewis M.M., Smith A.B., Styner M., et. al.: Asymmetrical lateral ventricular enlargement in Parkinson’s disease. Eur J Neurol 2009; 16: pp. 475-481.
23. Huang X., Lee Y.Z., McKeown M., et. al.: Asymmetrical ventricular enlargement in Parkinson’s disease. Movement Disord 2007; 22: pp. 1657-1660.
24. Harrison L.C.V., Raunio M., Holli K.K., et. al.: MRI texture analysis in multiple sclerosis: toward a clinical analysis protocol. Acad Radiol 2010; 17: pp. 696-707.
25. Mathias J.M., Tofts P.S., Losseff N.A.: Texture analysis of spinal cord pathology in multiple sclerosis. Magnet Reson Med 1999; 42: pp. 929-935.
26. Freeborough P.A., Fox N.C.: MR image texture analysis applied to the diagnosis and tracking of Alzheimer’s disease. IEEE Trans Med Imaging 1998; 17: pp. 475-478.
27. Bonilha L., Kobayashi E., Castellano G., et. al.: Texture analysis of hippocampal sclerosis. Epilepsia 2003; 44: pp. 1546-1550.
28. Zhang J., Tong L., Wang L., et. al.: Texture analysis of multiple sclerosis: a comparative study. Magn Reson Imaging 2008; 26: pp. 1160-1166.
29. Kjaer L., Ring P., Thomsen C., et. al.: Texture analysis in quantitative MR imaging tissue characterisation of normal brain and intracranial tumours at 1.5 T. Acta Radiol 1995; 36: pp. 127-135.
30. Herlidou-Meme S., Constans J.M., Carsin B., et. al.: MRI texture analysis on texture test objects, normal brain and intracranial tumors. Magn Reson Imaging 2003; 21: pp. 989-993.
31. Mahmoud-Ghoneim D., Toussaint G., Constans J.-M., et. al.: Three dimensional texture analysis in MRI: a preliminary evaluation in gliomas. Magn Reson Imaging 2003; 21: pp. 983-987.
32. Schad L.R., Bluml S., Zuna I.: MR tissue characterization of intracranial tumors by means of texture analysis. Magn Reson Imaging 1993; 11: pp. 889-896.
33. Jirak D., Dezortova M., Taimr P., et. al.: Texture analysis of human liver. J Magn Reson Imaging 2002; 15: pp. 68-74.
34. Holli K., Lääperi A.L., Harrison L., et. al.: Characterization of breast cancer types by texture analysis of magnetic resonance images. Acad Radiol 2010; 17: pp. 135-141.
35. Gibbs P., Turnbull L.W.: Textural analysis of contrast-enhanced MR images of the breast. Magnet Reson Med 2003; 50: pp. 92-98.
36. Harrison L.C., Luukkaala T., Pertovaara H., et. al.: Non-hodgkin lymphoma response evaluation with MRI texture classification. J Exp Clin Cancer Res 2009; 28: pp. 87.
37. Haralick R.M.: Statistical and structural approaches to texture. Proc IEEE 1979; 67: pp. 786-804.
38. Kassner A., Thornhill R.E.: Texture analysis: a review of neurologic MR imaging applications. AJNR Am J Neuroradiol 2010; 31: pp. 809-816.
39. Hájek M.Dezortova M.Materka A.Lerski R.A.Texture Analysis for Magnetic Resonance Imaging.2006.Med4PublishingPrague, Czech Republic:
40. Collewet G., Strzelecki M., Mariette F.: Influence of MRI acquisition protocols and image intensity normalization methods on texture classification. Magn Reson Imaging 2004; 22: pp. 81-91.
41. Loizou C.P., Murray V., Pattichis M.S., et. al.: Multiscale amplitude-modulation frequency-modulation (AMFM) texture analysis of multiple sclerosis in brain MRI images. IEEE Trans Inf Technol B 2011; 15: pp. 119-129.
42. Kassner A., Liu F., Thornhill R.E., et. al.: Prediction of hemorrhagic transformation in acute ischemic stroke using texture analysis of postcontrast T1-weighted MR images. J Magn Reson Imaging 2009; 30: pp. 933-941.
43. Holli K.K., Waljas M., Harrison L., et. al.: Mild traumatic brain injury: Tissue texture analysis correlated to neuropsychological and DTI findings. Acad Radiol 2010; 17: pp. 1096-1102.
44. Holli K.K., Harrison L., Dastidar P., et. al.: Texture analysis of MR images of patients with mild traumatic brain injury. BMC Med Imaging 2010; 10: pp. 8.
45. Peran P., Cherubini A., Assogna F., et. al.: Magnetic resonance imaging markers of Parkinson’s disease nigrostriatal signature. Brain 2010; 133: pp. 3423-3433.
46. Molnar G.F., Pilliar A., Lozano A.M., et. al.: Differences in neuronal firing rates in pallidal and cerebellar receiving areas of thalamus in patients with Parkinson’s disease, essential tremor, and pain. J Neurophysiol 2005; 93: pp. 3094-3101.
47. Chen H., Zhuang P., Miao S.-H., et. al.: Neuronal firing in the ventrolateral thalamus of patients with Parkinson’s disease differs from that with essential tremor. Chin Med J 2010; 123: pp. 695-701.
48. Mandir A.S., Vaughan C.: Pathophysiology of Parkinson’s disease. Int Rev Psychiatr 2000; 12: pp. 270-280.
49. Fearnley J.M., Lees A.J.: Ageing and Parkinson’s disease: substantia nigra regional selectivity. Brain 1991; 114: pp. 2283-2301.
50. Damier P., Hirsch E.C., Agid Y., et. al.: The substantia nigra of the human brain: II. Patterns of loss of dopamine-containing neurons in Parkinson’s disease. Brain 1999; 122: pp. 1437-1448.