
Rationale and Objectives
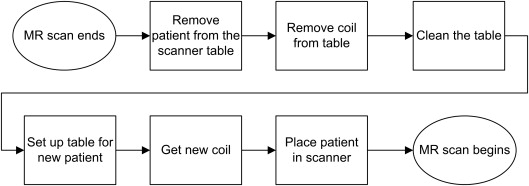
The aim of this study was to evaluate the feasibility of partnering with engineering students and critically examining the merit of the problem identification and analyses students generated in identifying sources impeding effective turnaround in a large university department of diagnostic radiology. Turnaround involves the time and activities beginning when a patient enters the magnetic resonance scanner room until the patient leaves, minus the time the scanner is conducting the protocol.
Materials and Methods
A prospective observational study was conducted, in which four senior undergraduate industrial and operations engineering students interviewed magnetic resonance staff members and observed all shifts. On the basis of 150 hours of observation, the engineering students identified 11 process steps (eg, changing coils). They charted machine use for all shifts, providing a breakdown of turnaround time between appropriate process and non-value-added time. To evaluate the processes occurring in the scanning room, the students used a work-sampling schedule in which a beeper sounded 2.5 times per hour, signaling the technologist to identify which of 11 process steps was occurring. This generated 2147 random observations over a 3-week period.
Results
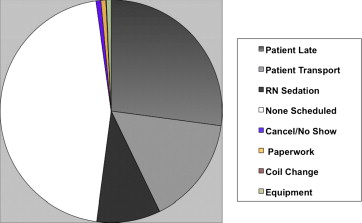
The breakdown of machine use over 105 individual studies showed that non-value-added time accounted for 62% of turnaround time. Analysis of 2147 random samples of work showed that scanners were empty and waiting for patients 15% of the total time. Analyses showed that poor communication delayed the arrival of patients and that no one had responsibility for communicating when scanning was done.
Conclusions
Engineering students used rigorous study design and sampling methods to conduct interviews and observations. This led to data-driven definition of problems and potential solutions to guide systems-based improvement.
The costs associated with magnetic resonance (MR) imaging services have come under increasing scrutiny in the drive to control health care expenditures. In an effort to curb the proliferation of underutilized MR scanners, some state regulations require certificates of need for each MR scanner. Resultant demand has meant that health care systems sometimes run their service on a 24-hour basis to accommodate planned diagnostic and emergent studies for a diverse range of patients. In our academic study setting, the MR service, departmental operations committees, department chair, and residents recognized the need to increase the efficiency of scanner utilization and decrease patient care delays. The technologists exerted great efforts to stay on schedule but were chronically behind, eliciting complaints from patients and referring physicians. Even during peak use, the scanners were often seen to be empty, even though our scheduled utilization rate was 95%.
Potential causes for delays varied according to the stakeholders questioned. Many technologists attributed delay to periodic coil changes between patients. The clerical staff thought paperwork and patients’ late arrivals were at fault. Some faculty members concurred with the technologists, which led to a demand to reduce the frequency of coil changes by overhauling the scheduling system. Other faculty members blamed late patient cancellations and censured referring physicians for not informing their patients of the need for early cancellations. Few data existed to support any of these competing hypotheses. Metrics available to describe MR processes were collected primarily to address insurance reimbursement. Although these data can be successfully mined for many practice management questions , the existing data could not address the problem of throughput bottlenecks we sought to address. No data were available identifying MR processes and associated utilization of time.
Get Radiology Tree app to read full this article<
Get Radiology Tree app to read full this article<
Materials and methods
Get Radiology Tree app to read full this article<
Get Radiology Tree app to read full this article<
Get Radiology Tree app to read full this article<
Get Radiology Tree app to read full this article<
Results
Get Radiology Tree app to read full this article<
Get Radiology Tree app to read full this article<
Table 1
Examples of Data in a Value Stream Map (Activities Supporting MR Care of Patients)
Example 1 Example 2 Process activities Technologist enters room and removes patient from scanner Technologist sets up contrast power injector Personnel and setting involved MR technologist, MR room MR technologist, MR room Process time (mean ± standard deviation) 51 ± 12 s 5:55 ± 2:42 min Percentage of procedures in which the process occurs 100% 21%
Table 2
Engineering Students’ Observation-based Summary of Each Step of the Turnaround Process (Based on 105 Total Observations)
Process Step Mean ± Standard Deviation Time (min) Percentage of Total Process Time Technologist enters room and removes patient from scanner 0:31 ± 0:17 3.1% Remove coil ∗ 0:39 ± 0:26 3.8% Transport patient out of room 1:34 ± 1:30 9.3% Remove pads and linens 0:46 ± 0:36 4.5% Set up contrast power injector ∗ 3:53 ± 2:42 22.9% Set up new linens 0:43 ± 0:45 4.2% Set up coil on scanner 0:47 ± 0:39 4.6% Patient arrives and lies on table 1:00 ± 1:06 5.9% Technologist administers intravenous contrast ∗ 3:10 ± 2:32 18.7% Technologist places coil on patient 1:14 ± 0:50 7.3% Technologist slides patient into scanner 1:26 ± 1:52 8.5% Scan begins 1:13 ± 1:24 7.2%
Get Radiology Tree app to read full this article<
Table 3
Summary of the Turnaround Process (Based on 105 Total Observations)
Mean ± Standard Deviation Time (min) Percentage of Total Time Total turnaround time 26:46 ± 20:47 100% Process time 10:14 ± 4:54 38% Non-value-added time 16:32 ± 19:21 62%
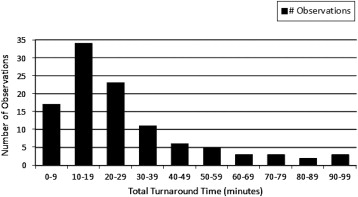
Table 4
Time Standard Applied to Work-sampling Study Results
Overall MR Machine Utilization Percentage of Total Minutes per Scan Patient in room Scanning 72.43% 67:43 Not scanning 7.45% 6:04 Prepping or setting up room 4.66% 4:03 Total 84.54% 77:55 Room empty Waiting: no patient scheduled 7.08% 6:04 Waiting: patient late/changing 4.05% 3:02 Waiting: patient transport 2.28% 2:01 Waiting: registered nurse sedation 1.63% 1:01 Waiting: cancel/no-show 0.23% 0:00 Waiting: incomplete paperwork 0.09% 0:00 Total 15.37% 12:08 MR down Scheduled maintenance 0.00% 0:00 Unexpected maintenance 0.09% 0:00 Total 0.09% 0:00
MR, magnetic resonance.
Get Radiology Tree app to read full this article<
Get Radiology Tree app to read full this article<
Get Radiology Tree app to read full this article<
Discussion
Get Radiology Tree app to read full this article<
Get Radiology Tree app to read full this article<
Get Radiology Tree app to read full this article<
Get Radiology Tree app to read full this article<
Get Radiology Tree app to read full this article<
Get Radiology Tree app to read full this article<
Get Radiology Tree app to read full this article<
Get Radiology Tree app to read full this article<
Get Radiology Tree app to read full this article<
Conclusions
Get Radiology Tree app to read full this article<
Acknowledgments
Get Radiology Tree app to read full this article<
References
1. Woodcock E.W.: Using the data you already have. J Ambul Care Manage 2000; 23: pp. 31-39.
2. Johnson C.D., Krecke K.N., Miranda R., et. al.: Quality initiatives: developing a radiology quality and safety program: a primer. Radiographics 2009; 29: pp. 951-959.
3. Kruskal J.B., Anderson S., Yam C.S., et. al.: Strategies for establishing a comprehensive quality and performance improvement program in a radiology department. Radiographics 2009; 29: pp. 315-329.
4. Kim CS, Lukela MP, Parekh VI, et al. Teaching internal medicine residents quality improvement and patient safety: a lean thinking approach. Am J Med Qual; 25:211–217.
5. Guglielmino M.G., Celano G., Costa A., et. al.: Modelling a radiology department service using a VDL integrated approach. J Health Organ Manag 2009; 23: pp. 376-395.
6. Rath F.: Tools for developing a quality management program: proactive tools (process mapping, value stream mapping, fault tree analysis, and failure mode and effects analysis). Int J Radiat Oncol Biol Phys 2008; 71: pp. S187-S190.
7. Varkey P., Reller M.K., Resar R.K.: Basics of quality improvement in health care. Mayo Clin Proc 2007; 82: pp. 735-739.
8. Joffe S., Drew D., Bansal M., et. al.: Radiology operations: what you don’t know could be costing you millions. Radiol Manage 2007; 29: pp. 20-24.
9. Day T.E., Goldlust E.J., True W.R.: Commentary: the role of mentored internships for systems engineering in improving health care delivery. Acad Med 2010; 85: pp. 1405-1407.
10. Chan S.: Management education during radiology residency: development of an educational practice. Acad Radiol 2004; 11: pp. 1308-1317.
11. Varkey P., Karlapudi S.P., Bennet K.E.: Teaching quality improvement: a collaboration project between medicine and engineering. Am J Med Qual 2008; 23: pp. 296-301.
12. Association of Program Directors in Radiology. 2005 Association of Program Directors in Radiology (APDR) annual survey results. Available at: http://www.apdr.org/sitemap.cfm Accessed October 20, 2011.
13. Graham M.J., Naqvi Z., Encandela J., et. al.: Systems-based practice defined: taxonomy development and role identification for competency assessment of residents. J Grad Med Educ 2009; 1: pp. 49-60.
14. Jenson H.B., Dorner D., Hinchey K., et. al.: Integrating quality improvement and residency education: insights from the AIAMC National Initiative about the roles of the designated institutional official and program director. Acad Med 2009; 84: pp. 1749-1756.
15. Lurie S.J., Mooney C.J., Lyness J.M.: Measurement of the general competencies of the accreditation council for graduate medical education: a systematic review. Acad Med 2009; 84: pp. 301-309.
16. Panek R.C., Deloney L.A., Park J., et. al.: Interdepartmental problem-solving as a method for teaching and learning systems-based practice. Acad Radiol 2006; 13: pp. 1150-1154.
17. Armstrong E.G., Mackey M., Spear S.J.: Medical education as a process management problem. Acad Med 2004; 79: pp. 721-728.
18. Holland R., Meyers D., Hildebrand C., et. al.: Creating champions for health care quality and safety. Am J Med Qual 2010; 25: pp. 102-108.
19. Reid P.P., Compton W.D., Grossman J.H., et. al.: Building a better delivery system: a new engineering/health care partnership.2005.National Academies PressWashington, DC