
Rationale and Purpose
To evaluate the performance of a patient size–compensated automatic tube current modulation (PSC-AutomA) technique from the perspectives of image quality and radiation dose in multi-detector-row computed tomography (MDCT) scan of the abdomen and pelvis.
Materials and Methods
Institutional review board approval was obtained and the study was Health Insurance Portability and Accountability Act–compliant. One hundred and seventeen patients (mean age: 48.8 years; range: 17–89 years; male/female: 57/60) underwent abdominal-pelvic CT scan on a 64-slice MDCT using the noise indexes (NI) recommended by the PSC-AutomA technique. Two radiologists independently evaluated all examinations for noise, streak artifacts, and diagnostic acceptability at the dome of liver, porta hepatis, and the upper margin of acetabulum. The CT dose index (CTDI) volume and effective dose of the CT performed using a recommended NI were compared to the CT performed using a fixed NI of 12. Statistical analysis of the data was performed with nonparametric tests.
Results
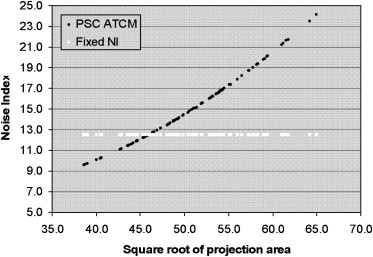
The NI recommended by the PSC-AutomA technique was strongly correlated with patient size ( r = 0.98, P < .001) with a mean NI of 14.2 HU. The recommended NI of 98.2% (115/117) patients was different from the fixed NI of 12. Approximately 71.8% (84/117) subjects were scanned with a NI higher than 12, whereas 26.5% (31/117) subjects were scanned with a NI lower than 12. All examinations (100%; 117/117) were graded as possessing diagnostic image quality. Compared with the CT performed by using a fixed NI 12, the overall CTDI and effective dose reduction by the PSC-AutomA technique were 11.1% and 11.8%, respectively.
Conclusion
The PSC-AutomA technique can recommend an appropriate NI in MDCT scan of the abdomen and pelvis according to patient size, allowing a balanced optimization of both radiation dose and image quality, simultaneously.
Automatic tube current modulation (ATCM) techniques are important methods to reduce radiation exposure without compromising image quality . Z-axis modulation (AutomA) is one of these techniques that attempt to adjust the tube current adaptively for each section in the scanning range according to patient size, shape, and attenuation to obtain a constant noise level (noise index, NI) in each image . Previous studies have documented that, with a given NI, AutomA can help to reduce radiation dose and maintain a desirable image quality in a variety of multi-detector computed tomography (MDCT) examinations, such as the CT evaluations of head, neck, chest, abdomen, and pelvis .
NI is a critical factor in the AutomA technique that identifies an adequate image noise level to be maintained while lowering radiation dose . It is well-known that a reduction in radiation dose leads to increase in image noise while an increase in radiation dose can reduce the image noise. Hence, selecting an ideal NI allows a balance between image noise and radiation dose. Based on previous studies and vendor recommendation, different NI values have been suggested for abdominal and pelvic MDCT studies. A higher NI was recommended for a large size patient to avoid a higher radiation exposure , and a lower NI for smaller patients was also suggested by a previous investigation . Some of these studies have shown that there is an influence of patient weight on image quality and dose when a constant NI is chosen for all patient sizes. Kalra et al showed that smaller patients (in their study, defined as having weight less than 68 kg and corresponding to smaller transverse and anteroposterior diameters) had subjective image quality scores lower than larger patients (weights greater than 68 kg) despite using a fixed NI. Other studies have shown that weight is not the ideal factor for required dose calculations, as two patients with the same weight can have different regional dimensions and tissue attenuation properties on CT scanning, which can affect the image quality significantly . Schindera et al found that a phantom with increased anthropomorphic size received significantly increased skin and deep organ dose than a smaller sized phantom for fixed NI.
Get Radiology Tree app to read full this article<
Get Radiology Tree app to read full this article<
Materials and methods
Patients
Get Radiology Tree app to read full this article<
Get Radiology Tree app to read full this article<
Scanning Protocol
Get Radiology Tree app to read full this article<
Get Radiology Tree app to read full this article<
PSC-AutomA Technique
Get Radiology Tree app to read full this article<
Get Radiology Tree app to read full this article<
Get Radiology Tree app to read full this article<
CT Image Analysis
Get Radiology Tree app to read full this article<
Get Radiology Tree app to read full this article<
Get Radiology Tree app to read full this article<
Quantitative Data and Radiation Dose Comparison
Get Radiology Tree app to read full this article<
Get Radiology Tree app to read full this article<
Statistical Analysis
Get Radiology Tree app to read full this article<
Get Radiology Tree app to read full this article<
Results
Patient Size and Noise Index
Get Radiology Tree app to read full this article<
Table 1
The Mean ± SE of SqrtPA and Recommended NI
Number SqrtPA NI All patients 117 50.1 ± 0.5 (38.8–2.8) 14.2 ± 0.3 (9.3–21.5) Small patients 31 43 ± 0.4 (38.8–45.9) 10.7 ± 0.1(9.3–11.8) Average patients 2 46 12 Larger patients 84 52.8 ± 0.35 (46.2–62.8) 15.5 ± 0.3 (12.1–21.5)
NI, noise index; SqrtPA, square root of projection area.
Small patients: SqrtPA <46; average patients: SqrtPA = 46; larger patients: SqrtPA >46.
Get Radiology Tree app to read full this article<
Image Quality
Get Radiology Tree app to read full this article<
Table 2
Results of Independent Evaluation of Image Noise by Two Readers
Reader 1 Reader 2 Score D P A D P A 1 18 17 37 19 20 30 2 60 46 54 53 35 59 3 36 42 23 42 50 25 4 3 12 4 3 12 3 5 0 0 0 0 0 0
D, dome of liver; P, porta hepatic; A, acetabulum.
Score: 1. excellent, 2. above average, 3. acceptable, 4. suboptimal, 5. Unacceptable.
Table 3
Results of Independent Evaluation of Diagnostic Acceptability by Two Readers
Reader 1 Reader 2 Score D P A D P A 1 83 71 85 80 75 91 2 34 46 32 37 42 26 3 0 0 0 0 0 0
D, dome of liver; P, porta hepatic; A, acetabulum.
Score: 1. excellent, 2. above average, 3. acceptable, 4. suboptimal, 5. Unacceptable.
Table 4
Results of Independent Evaluation of Streak Artifacts by Two Readers
Reader 1 Reader 2 Score D P A D P A 1 78 68 76 84 70 73 2 39 49 41 33 47 44 3 0 0 0 0 0 0
D, dome of liver; P, porta hepatic; A, acetabulum.
Score: 1. excellent, 2. above average, 3. acceptable, 4. suboptimal, 5. Unacceptable.
Get Radiology Tree app to read full this article<
Get Radiology Tree app to read full this article<
Get Radiology Tree app to read full this article<
Radiation Dose
Get Radiology Tree app to read full this article<
Table 5
The Mean ± SE of CTDI, DLP, and Effective Dose in CT Performed by Using a Recommended NI and Using a Fixed NI of 12
Recommended NI NI of 12 CTDI 11 ± 0.5 (4.5–16.9) 13.3 ± 0.4 (4.7–18.6) DLP 559.6 ± 14.3 (145.7–1076) 688.4 ± 20.4 (266.3–1072.9) Effective dose 8.4 ± 0.2 (2.2–16.1) 10.3 ± 0.3 (4–16.1)
CT, computed tomography; CTDI, CT dose index; DLP, dose-length product; NI, noise index.
Unit: CTDI: mGy; DLP: mGy-cm; effective dose (E): mSv.
Table 6
CT Dose Descriptor of CTDI and Effective Dose (E) Percentage (%) Changes Between Two CT Scans
Number CTDI Effective Dose (E) All patients 117 11.1 ± 2.2 (−54, 54.6) 11.8 ± 2.2 (−56.3, 74.7) Small patients 31 −22.3 ± 2.5 (0.08–54) −22.9 ± 3.6 (−5.7, 56.3) Average patients 2 2.1 ± 1.9 (0.28–4) 2.4 ± 2.8 (−0.4, 5.2) Larger patients 84 23.9 ± 1.4 (0.9–54.6) 24.8 ± 1.8 (−5.3, 74.7)
CT, computed tomography; CTDI, CT dose index.
Unit: CTDI: mGy; effective dose (E): mSv.
Smaller patients increase CTDI and effective dose, and larger patients decrease CTDI and effective dose.
Get Radiology Tree app to read full this article<
Discussion
Get Radiology Tree app to read full this article<
Get Radiology Tree app to read full this article<
Get Radiology Tree app to read full this article<
Get Radiology Tree app to read full this article<
Get Radiology Tree app to read full this article<
Get Radiology Tree app to read full this article<
Get Radiology Tree app to read full this article<
Get Radiology Tree app to read full this article<
Get Radiology Tree app to read full this article<
Get Radiology Tree app to read full this article<
Get Radiology Tree app to read full this article<
Get Radiology Tree app to read full this article<
References
1. Tack D., De Maertelaer V., Gevenois P.A.: Dose reduction in multidetector CT using attenuation-based online tube current modulation. AJR Am J Roentgenol 2003; 181: pp. 331-334.
2. Mulkens T.H., Bellinck P., Baeyaert M., et. al.: Use of an automatic exposure control mechanism for dose optimization in multi-detector row CT examinations: clinical evaluation. Radiology 2005; 237: pp. 213-223.
3. Rizzo S.M., Kalra M.K., Schmidt B.: Automatic exposure control techniques for individual dose adaptation. Radiology 2005; 235: pp. 335-336. author reply 336
4. Greess H., Wolf H., Suess C., et. al.: [Automatic exposure control to reduce the dose in subsecond multislice spiral CT: phantom measurements and clinical results]. Rofo 2004; 176: pp. 862-869.
5. Kalra M.K., et. al.: Strategies for CT radiation dose optimization. Radiology 2004; 230: pp. 619-628.
6. Kalra M.K., Maher M.M., Toth T.L., et. al.: Techniques and applications of automatic tube current modulation for CT. Radiology 2004; 233: pp. 649-657.
7. Namasivayam S., Kalra M.K., Pottala K.M., et. al.: Optimization of Z-axis automatic exposure control for multidetector row CT evaluation of neck and comparison with fixed tube current technique for image quality and radiation dose. AJNR Am J Neuroradiol 2006; 27: pp. 2221-2225.
8. Kalra M.K., Maher M.M., Kamath R.S., et. al.: Sixteen-detector row CT of abdomen and pelvis: study for optimization of Z-axis modulation technique performed in 153 patients. Radiology 2004; 233: pp. 241-249.
9. Kalra M.K., Rizzo S., Maher M.M., et. al.: Chest CT performed with z-axis modulation: scanning protocol and radiation dose. Radiology 2005; 237: pp. 303-308.
10. Kalra M.K., Maher M.M., D’Souza R.V., et. al.: Detection of urinary tract stones at low-radiation-dose CT with z-axis automatic tube current modulation: phantom and clinical studies. Radiology 2005; 235: pp. 523-529.
11. Kalra M.K., Maher M.M., Prasad S.R., et. al.: Correlation of patient weight and cross-sectional dimensions with subjective image quality at standard dose abdominal CT. Korean J Radiol 2003; 4: pp. 234-238.
12. Schindera S.T., Nelson R.C., Toth T.L., et. al.: Effect of patient size on radiation dose for abdominal MDCT with automatic tube current modulation: phantom study. AJR Am J Roentgenol 2008; 190: pp. W100-W105.
13. Tang X., Hsieh J., Hagiwara A., et. al.: A three-dimensional weighted cone beam filtered backprojection (CB-FBP) algorithm for image reconstruction in volumetric CT under a circular source trajectory. Phys Med Biol 2005; 50: pp. 3889-3905.
14. Tang X., Hsieh J., Nilsen R.A., et. al.: A three-dimensional-weighted cone beam filtered backprojection (CB-FBP) algorithm for image reconstruction in volumetric CT-helical scanning. Phys Med Biol 2006; 51: pp. 855-874.
15. Toth T., Ge Z., Daly M.P.: The influence of patient centering on CT dose and image noise. Med Phys 2007; 34: pp. 3093-3101.
16. McCollough C.H., Schueler B.A.: Calculation of effective dose. Med Phys 2000; 27: pp. 828-837.
17. Landis J.R., Koch G.G.: The measurement of observer agreement for categorical data. Biometrics 1977; 33: pp. 159-174.
18. Kalender W.A., Wolf H., Suess C., et. al.: Dose reduction in CT by on-line tube current control: principles and validation on phantoms and cadavers. Eur Radiol 1999; 9: pp. 323-328.
19. Kalra M.K., Naz N., Rizzo S.M., et. al.: Computed tomography radiation dose optimization: scanning protocols and clinical applications of automatic exposure control. Curr Probl Diagn Radiol 2005; 345: pp. 171-181.
20. Matsubara K., Koshida K., Suzuki M., et. al.: Comparison between 3-D and z-axis automatic tube current modulation technique in multidetector-row CT. Radiat Prot Dosimetry 2008; 128: pp. 106-111.
21. McCollough C.H., Bruesewitz M.R., Kofler J.M.: CT dose reduction and dose management tools: overview of available options. Radiographics 2006; 26: pp. 503-512.
22. Rizzo S., Kalra M., Schmidt B., et. al.: Comparison of angular and combined automatic tube current modulation techniques with constant tube current CT of the abdomen and pelvis. AJR Am J Roentgenol 2006; 186: pp. 673-679.
23. Li J., Udayasankar U.K., Toth T.L., et. al.: Automatic patient centering for MDCT: effect on radiation dose. AJR Am J Roentgenol 2007; 188: pp. 547-552.