
Rationale and Objectives
Phase-contrast (PC) magnetic resonance imaging (MRI) technique has important clinical applications in blood flow quantification and pressure gradient estimation by velocity measurement. Parallel imaging using sensitivity encoding (SENSE) may substantially reduce scan time. We demonstrate the utility of PC-MRI measurements accelerated by SENSE under clinical conditions.
Materials and Methods
Accuracy and repeatability of a SENSE-PC implementation was evaluated by comparison with a commercial PC sequence with five normal volunteers. Twenty-six patients were then scanned with SENSE-PC at reduction factors (R = 1, 2, and 3). Blood flow and peak velocity were measured in the aorta and pulmonary trunk in 16 patients and peak velocity was measured at the coarctation of 10 patients. Quantitative flow, shunt ratio, and peak velocity measurements obtained with different reduction factors were compared using correlation, linear regression, and Bland-Altman statistics. All studies were approved by an Institutional Review Board, and informed consent was acquired from all subjects.
Results
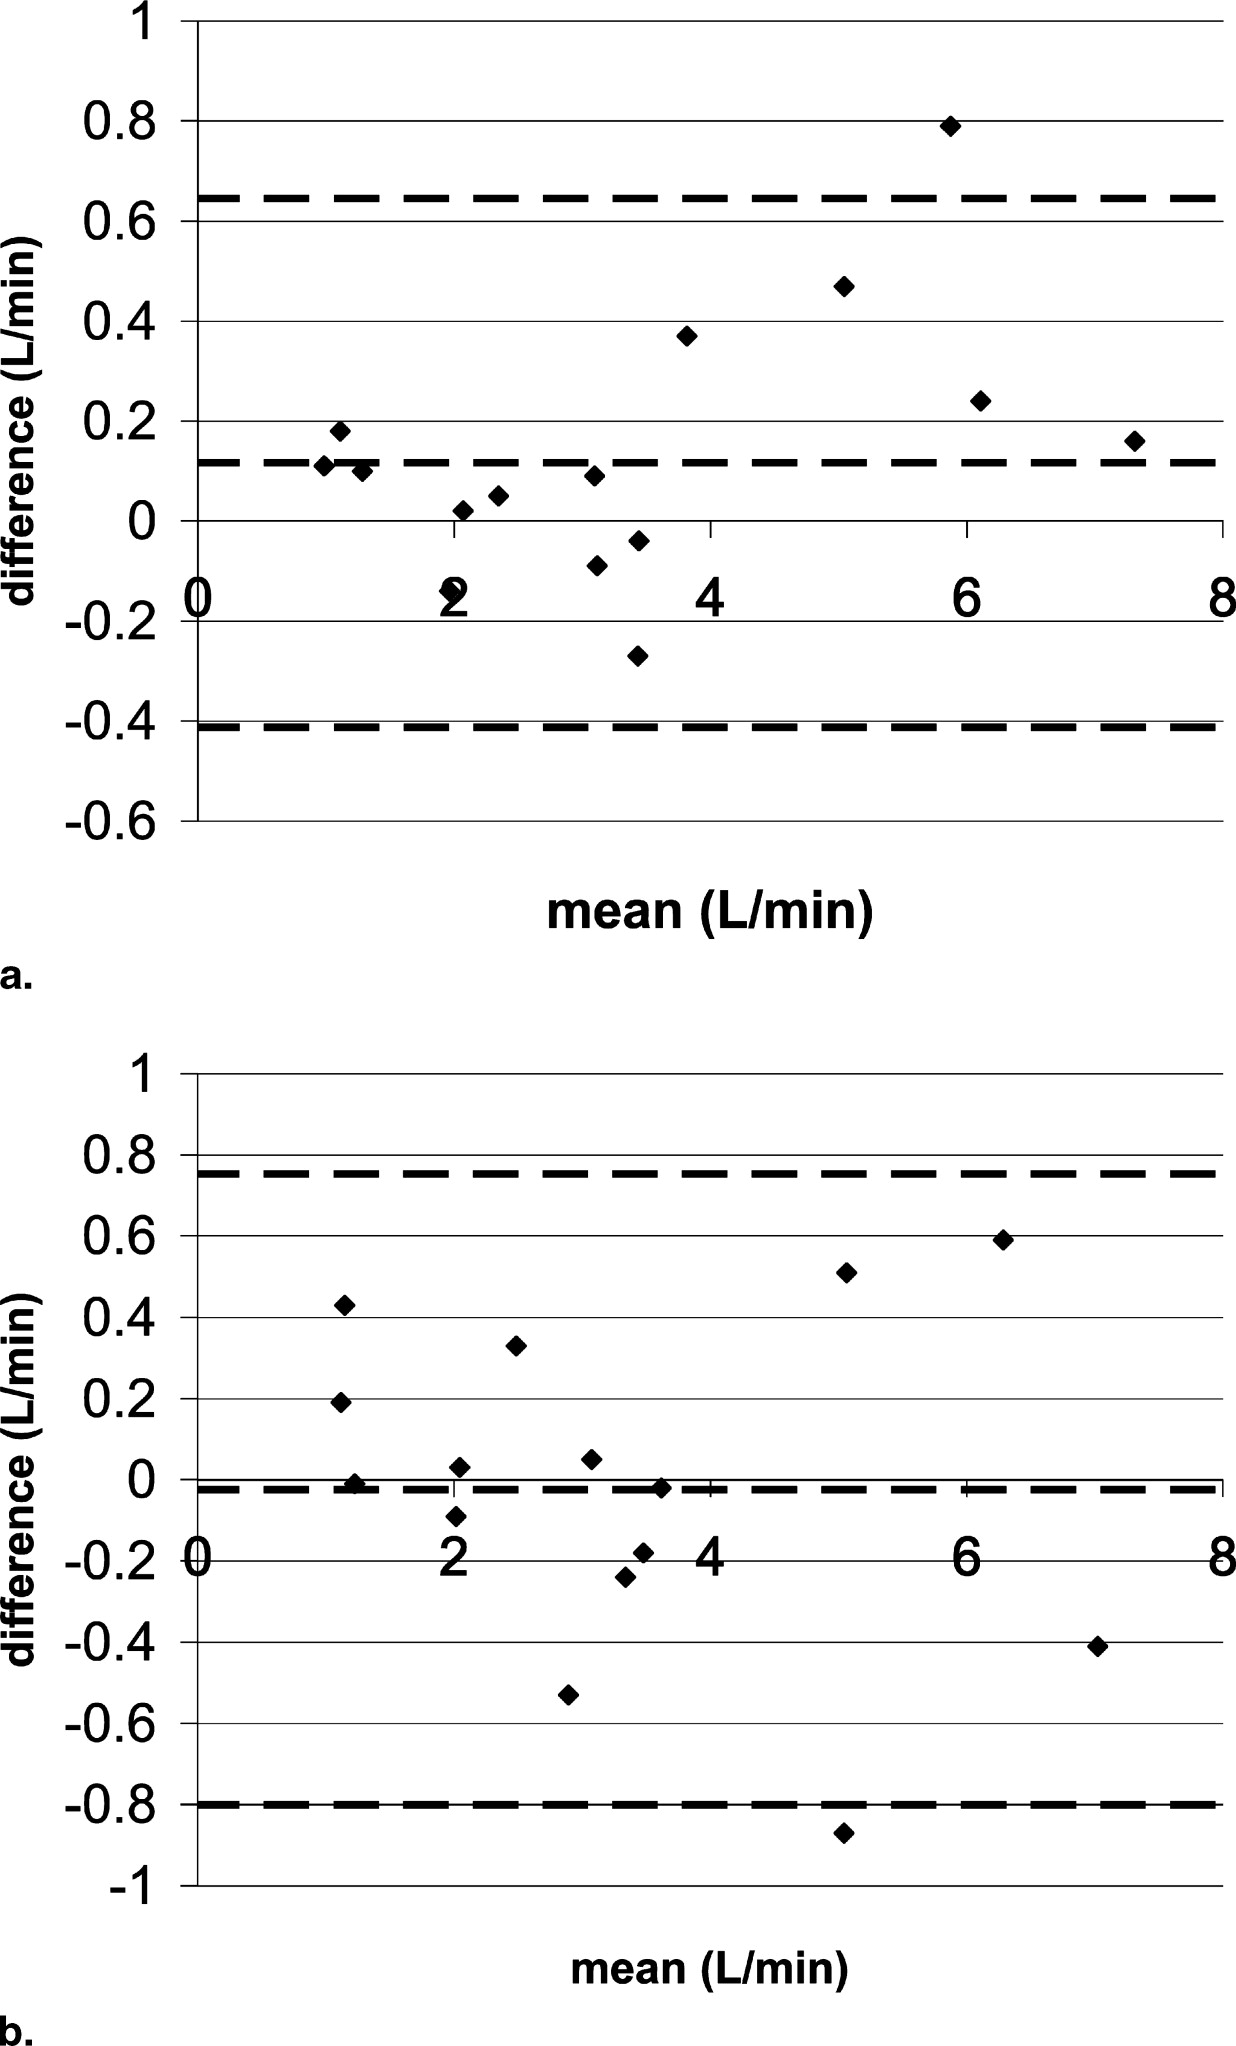
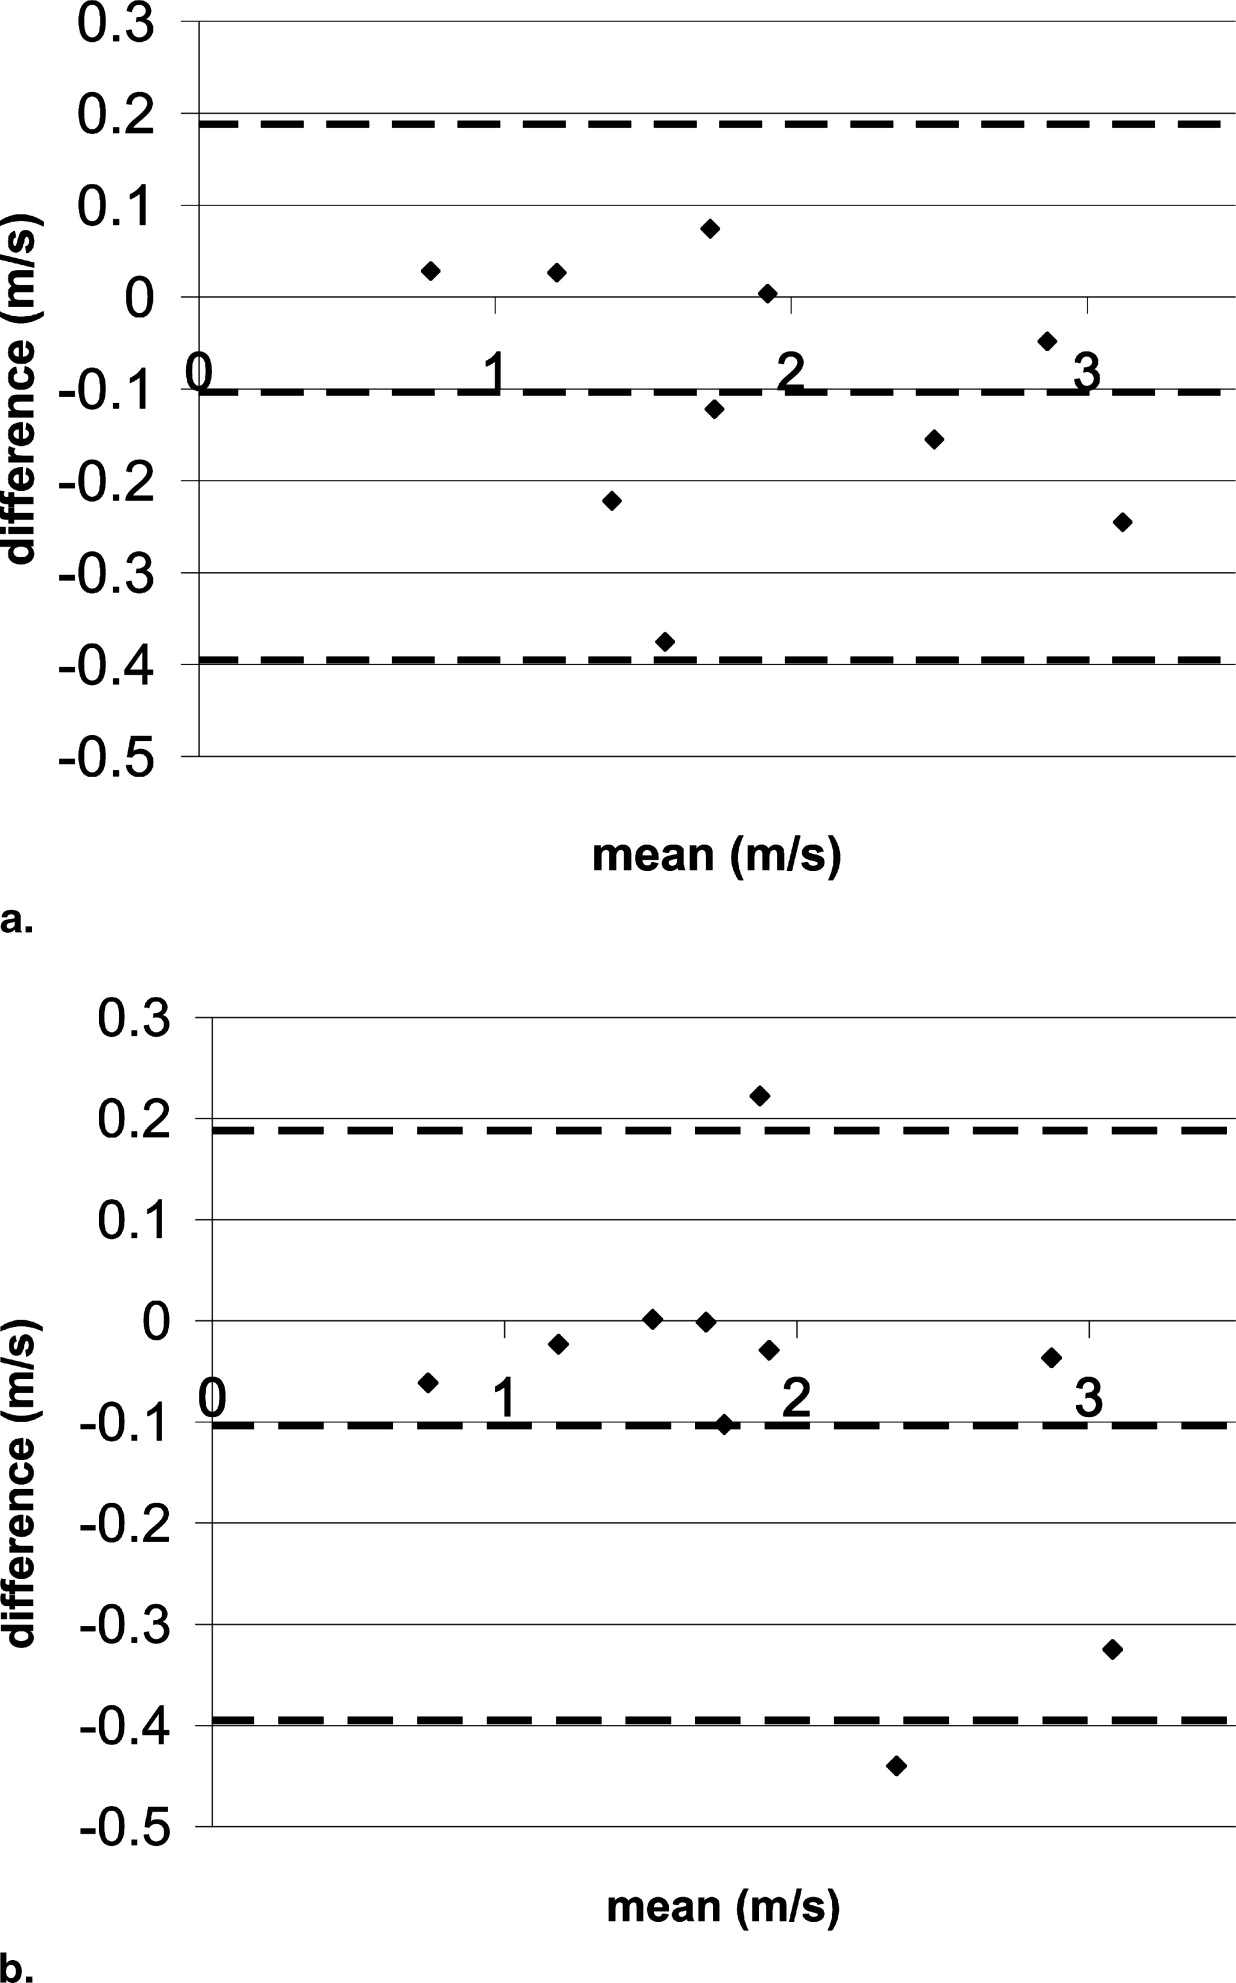
The correlation coefficients for all comparisons were >0.962 and with high statistical significance ( P < .01). Linear regression slopes ranged between 0.96 and 1.11 for flow and 0.88 to 1.05 for peak velocity. For flow, the Bland-Altman statistics yielded a total mean difference ranging from −0.02 to 0.05) L/minute with 2 standard of deviation limits ranging from −0.52 to 0.75 L/minute. For peak velocity, the total mean difference ranged from −0.10 to −0.004) milliseconds with 2-SD limits ranging from −0.062 to 0.46 milliseconds. R = 3 to R = 1 comparisons had greater 2-SD limits than R = 2 to R = 1 comparisons.
Conclusion
SENSE PC-MRI measurements for flow and pressure gradient estimation were comparable to conventional PC-MRI.
Phase-contrast magnetic resonance imaging (PC-MRI) is a proven noninvasive technique for quantifying velocity and blood flow in the great arteries ( ). Measurements of blood flow in the aorta and pulmonary trunk produce a wealth of information, including cardiac outputs of the left and right ventricles, regurgitant volumes and fraction of the aortic and pulmonary valves, and shunt ratio. Regurgitant fraction is a particularly important parameter that determines the need for valvular repair or replacement, whereas shunt ratio is an important parameter for evaluating the need for closing shunt lesions because of atrial septal and ventricular septal defects ( ). Velocity of moving blood is related to the pressure gradient as described by the modified Bernoulli equation ( ). This relationship is used extensively by echocardiography to estimate pressure gradient across stenotic cardiovascular lesions. Using a similar approach, PC-MRI has been applied to estimate the pressure gradient of coarctation of the ascending aorta ( ). A PC-MRI scan usually requires a breath-hold to minimize the movement of the vessels through the imaging slice. However, conventional PC-MRI scans last on the order of 20–30 seconds. This duration may be difficult for children and noncompliant patients.
Sensitivity encoding (SENSE) ( ) is an important technique that significantly reduces acquisition time. Implementations of SENSE for magnitude imaging are now widely available for clinical applications. A successful implementation of SENSE for PC-MRI promises shortened scan time or increased temporal resolution in segmented k-space techniques, thereby improving patient compliance in breath-hold imaging. An experimental version of SENSE PC-MRI has been tested on the measurement of shunt ratio ( ). However, the potential applications of SENSE PC-MRI have yet to be fully explored in the measurement of flow velocity and the estimation of pressure gradients.
Get Radiology Tree app to read full this article<
Get Radiology Tree app to read full this article<
Materials and methods
MR Imaging
Volunteer population
Get Radiology Tree app to read full this article<
Get Radiology Tree app to read full this article<
Get Radiology Tree app to read full this article<
Get Radiology Tree app to read full this article<
Patient population
Get Radiology Tree app to read full this article<
Table 1
Patient Demographic and Scan Prescription
Patient Number Age (Years) Sex Weight (kg) Venc (cm/s) Contrast? Clinical History 1 3 M 18 250 Yes L-transposition of the great arteries and pulmonary stenosis 2 12 M 37 250 Yes Coarctation 3 10 F 24 500 Yes Coarctation 4 19 F 73 300 Yes Takayasu aortitis with distal arch stenosis 5 13 M 57 250 Yes Coarctation repair 6 17 M 74 250 Yes Coarctation, Shone syndrome 7 9 M 19 200 Yes Tetralogy of Fallot repaired 8 1.5 F 10 250 Yes Alagille syndrome 9 5 M 16 200 No Ebstein’s anomaly 10 0.5 M 6 400 Yes Pulmonary hypertension, coarctation repair 11 3 F 13 200 Yes Tricuspid atresia, Glenn shunt 12 12 M 43 200 Yes D-transposition, status post-Damus procedure 13 10 F 50 200 Yes Heart transplant 14 21 F 64 400 No D-transposition of the great arteries, status post Mustard/Senning procedure 15 ⁎ 2 M 10 250 Yes Tetralogy of Fallot repair 16 47 M 61 250 Yes Ross procedure, pulmonary stenosis 17 10 M 37 250 Yes Tetralogy of Fallout repaired 18 16 M 59 450 Yes Coarctation 19 1 F 8 450 Yes Coarctation 20 24 F 57 350 Yes Coarctation 21 13 M 52 450 Yes Bicuspid aortic valve, coarctation 22 15 M 60 350 Yes Tetralogy of Fallot repaired 23 6 M 22 250 No Pulmonary and tricuspid regurgitation, post pulmonary valve prosthesis placement 24 10 F 32 250 Yes Truncus arteriosus repaired, pulmonary stenosis 25 12 M 30 350 Yes Coarctation 26 15 F 68 150 Yes Marfan syndrome, aortic root aneurysm
Those with contrast were injected at 0.2 mmol/kg of gadopentetate dimeglumine (Magnevist).
Get Radiology Tree app to read full this article<
Get Radiology Tree app to read full this article<
Get Radiology Tree app to read full this article<
Get Radiology Tree app to read full this article<
Get Radiology Tree app to read full this article<
Get Radiology Tree app to read full this article<
Image Reconstruction
Get Radiology Tree app to read full this article<
Measurements for Flow and Pressure Gradient
Get Radiology Tree app to read full this article<
Get Radiology Tree app to read full this article<
Get Radiology Tree app to read full this article<
Statistical Analysis
Volunteer population
Get Radiology Tree app to read full this article<
Patient population
Get Radiology Tree app to read full this article<
g-Factor Calculation
Get Radiology Tree app to read full this article<
SNRSENSE=SNRconventionalgR√ S
N
R
S
E
N
S
E
=
S
N
R
c
o
n
v
e
n
t
i
o
n
a
l
g
R
where R is the SENSE reduction factor and g is the g-factor. For velocity images, the standard deviation of the noise in the velocity measurement is ( ):
σvelocity=2√VENCπSNR σ
v
e
l
o
c
i
t
y
=
2
V
E
N
C
π
S
N
R
Get Radiology Tree app to read full this article<
Get Radiology Tree app to read full this article<
Results
Get Radiology Tree app to read full this article<
Table 2
Statistical Comparisons Between Fastcard-PC and SENSE-PC for Flow in Normal Volunteers
n Fastcard-PC Repeatability SENSE-PCx1 Repeatability SENSE-PCx2 Repeatability SENSE-PCx3 Repeatability Fastcard-PC vs SENSE-PCx1 SENSE-PCx1 vs SENSE-PCx2 SENSE-PCx1 vs SENSE-PCx3 10 10 10 10 10 10 10 Bland-Altman Total mean difference (L/minute) 0.07 −0.10 −0.03 −0.26 −0.06 −0.15 −0.58 Lower limit of agreement (L/minute) ⁎ −0.65 −0.98 −1.28 −1.16 −0.75 −2.03 −1.67 Upper limit of agreement (L/minute) † 0.79 0.79 1.21 0.64 0.63 1.74 0.50
PC: phase contrast; SENSE, sensitivity encoding.
Get Radiology Tree app to read full this article<
Get Radiology Tree app to read full this article<
Table 3
Statistical Comparisons Between Fastcard-PC and SENSE-PC for Peak Velocity in Normal Volunteers
n Fastcard-PC Repeatability SENSE-PCx1 Repeatability SENSE-PCx2 Repeatability SENSE-PCx3 Repeatability Fastcard-PC vs SENSE-PCx1 SENSE-PCx1 vs SENSE-PCx2 SENSE-PCx1 vs SENSE-PCx3 10 10 10 10 10 10 10 Bland-Altman Total mean difference (milliseconds) 0.0098 −0.029 0.041 −0.0055 0.0053 −0.071 −0.041 Lower limit of agreement (milliseconds) ⁎ −0.099 −0.11 −0.068 −0.17 −0.077 −0.17 −0.22 Upper limit of agreement (milliseconds) † 0.12 0.057 0.15 0.16 0.088 0.029 0.14
PC: phase contrast; SENSE, sensitivity encoding.
Get Radiology Tree app to read full this article<
Get Radiology Tree app to read full this article<
Get Radiology Tree app to read full this article<
Get Radiology Tree app to read full this article<
Table 4
Statistical Comparisons Between PC-MRI and SENSE PC-MRI for Flow in Patients
n Aorta Pulmonary Artery Shunt Ratio 17 16 16 SENSE Reduction Factor 2 3 2 3 2 3 Bland-Altman Total mean difference (L/minute) 0.05 0.04 0.12 −0.02 0.04 0.03 Lower limit of agreement (L/minute) ⁎ −0.52 −0.51 −0.41 −0.80 −0.16 −0.34 Upper limit of agreement (L/minute) † 0.62 0.59 0.65 0.75 0.25 0.40 Pearson Correlation coefficient 0.985 0.985 0.994 0.986 0.992 0.969P value .01 .01 .01 .01 .01 .01 linear regression Slope 1.075 1.065 1.016 0.955 1.091 1.11 y-intercept (L/minute) −0.19 −0.16 0.06 0.14 −0.063 −0.103
PC-MRI: phase-contrast magnetic resonance imaging; SENSE: sensitivity encoding.
Get Radiology Tree app to read full this article<
Get Radiology Tree app to read full this article<
Table 5
Statistical Comparisons Between PC-MRI and SENSE PC-MRI for Peak Velocity in Patients
n Aorta Pulmonary Artery Coarctation 17 17 10 SENSE Reduction Factor 2 3 2 3 2 3 Bland-Altman Total mean difference (milliseconds) −0.029 −0.041 −0.0040 −0.083 −0.10 −0.080 Lower limit of agreement (milliseconds) ⁎ −0.22 −0.30 −0.25 −0.62 −0.40 −0.45 Upper limit of agreement (milliseconds) † 0.16 0.22 0.24 0.46 0.19 0.29 Pearson Correlation coefficient 0.993 0.984 0.993 0.962 0.986 0.974P value .01 .01 .01 .01 .01 .01 linear regression Slope 0.983 0.904 1.048 0.885 0.883 0.874 y-intercept (milliseconds) −0.0064 0.057 −0.071 0.11 0.13 0.20
PC-MRI: phase-contrast magnetic resonance imaging; SENSE: sensitivity encoding.
Get Radiology Tree app to read full this article<
Get Radiology Tree app to read full this article<
Get Radiology Tree app to read full this article<
Get Radiology Tree app to read full this article<
Get Radiology Tree app to read full this article<
Table 6
g-Factor Statistics
Average Size (mm 2 ) Mean Standard Deviation R = 2 R = 3 R = 2 R = 3 Aorta 137.06 1.322 2.103 0.324 1.191 Pulmonary artery 162.45 1.161 1.554 0.181 0.305 Coarctation 94.75 1.159 1.409 0.472 0.589
Get Radiology Tree app to read full this article<
Discussion
Get Radiology Tree app to read full this article<
Get Radiology Tree app to read full this article<
Get Radiology Tree app to read full this article<
Get Radiology Tree app to read full this article<
Get Radiology Tree app to read full this article<
Get Radiology Tree app to read full this article<
Get Radiology Tree app to read full this article<
Get Radiology Tree app to read full this article<
Get Radiology Tree app to read full this article<
Get Radiology Tree app to read full this article<
Get Radiology Tree app to read full this article<
Get Radiology Tree app to read full this article<
Acknowledgment
Get Radiology Tree app to read full this article<
Get Radiology Tree app to read full this article<
References
1. Szolar D.H., Hajime S., Higgins C.B.: Cardiovascular applications of magnetic resonance flow and velocity measurements. J Magn Reson Imaging 1996; 1: pp. 78-89.
2. Higgins C.B., Sakuma H.: Heart disease: functional evaluation with MR imaging. Radiology 1996; 199: pp. 307-315.
3. Pelc N.J., Herfkens R.J., Shimakawa A., et. al.: Phase contrast cine magnetic resonance imaging. Magn Reson Q 1991; 7: pp. 229-254.
4. Hundley W.G., Li H.F., Lange R.A., et. al.: Assessment of left-to-right intracardiac shunting by velocity-encoded, phase-difference magnetic resonance imaging: a comparison with oximetric and indicator diffusion techniques. Circulation 1995; 91: pp. 2955-2960.
5. Bremerich J., Reddy G.P., Higgins C.B.: MRI of supracristal ventricular septal defects. J Comput Assist Tomogr 1999; 23: pp. 13-15.
6. Parsons J.M., Baker E.J., Anderson R.H., et. al.: Morphological evaluation of atrioventricular septal defects by magnetic resonance imaging. Br Heart J 1990; 64: pp. 138-145.
7. Korperich H., Gieseke J., Barth P., et. al.: Flow volume and shunt quantification in pediatric congenital heart disease by real-time magnetic resonance velocity mapping: a validation study. Circulation 2004; 109: pp. 1987-1993.
8. Brenner L.D., Caputo G.R., Mostbeck G., et. al.: Quantification of left to right atrial shunts with velocity-encoded cine nuclear magnetic resonance imaging. J Am Coll Cardiol 1992; 20: pp. 1246-1250. 1.4–3.9
9. Mohiaddin R.H., Kilner P.T., Rees S., et. al.: Magnetic resonance volume flow and jet velocity mapping in aortic coarctation. J Am Coll Cardiol 1993; 22: pp. 1515-1521.
10. Pruessman K.P., Weiger M., Scheidegger M.B., et. al.: SENSE: Sensitivity Encoding for Fast MRI. Magn Reson Med 1999; 42: pp. 952-962.
11. Beerbaum P., Korperich H., Gieseke J., et. al.: Rapid left-to-right shunt quantification in children by phase-contrast magnetic resonance imaging combined with sensitivity encoding. Circulation 2003; 108: pp. 1355-1361.
12. Beerbaum P., Korperich H., Gieseke J., et. al.: Blood flow quantification in adults by phase-contrast MRI combined with SENSE—a validation study. J Cardio MR 2005; 7: pp. 361-369.
13. Thunberg P., Karlsson M., Wigstrom L.: Accuracy and reproducibility in phase contrast imaging using SENSE. Magn Reson Med 2003; 50: pp. 1061-1068.
14. Nayler G.L., Firmin D.N., Longmore D.B.: Blood flow imaging by cine magnetic resonance. J Comput Assist Tomogr 1986; 10: pp. 715-722.
15. Bernstein M.A., Zhou X.J., Polzin J.A., et. al.: Concomitant gradient terms in phase contrast MR: analysis and correction. Magn Reson Med 1998; 38: pp. 300-308.
16. Bland J.M., Altman D.G.: Statistical methods for assessing agreement between two methods of clinical measurement. Lancet 1986; 1: pp. 307-310.
17. Conturo T.E., Gregory D.: Signal-to-noise in phase angle reconstruction: dynamic range extension using phase reference offsets. Magn Res Med 1990; 15: pp. 420-437.
18. Griswold M.A., Kannengiesser S., Heidemann R.M., et. al.: Field-of-view limitations in parallel imaging. Magn Res Med 2004; 52: pp. 1118-1126.
19. Beerbaum P., Korperich H., Barth P., et. al.: Noninvasive quantification of left-to-right shunt in pediatric patients. Circulation 2001; 103: pp. 2476.
20. Powell A.J., Maier S.E., Chung T., et. al.: Phase-velocity cine magnetic resonance imaging measurement of pulsatile blood flow in children and young adults: in vitro and in vivo validation. Pediatr Cardiol 2000; 21: pp. 104-110.