
Rationale and Objectives
Magnetic resonance diffusion imaging can characterize physiologic characteristics of pediatric brain tumors used to assess therapy response. The purpose of this study was to assess the variability of the apparent diffusion coefficient (ADC) along z-axis of scanners in the multicenter Pediatric Brain Tumor Consortium (PBTC).
Materials and Methods
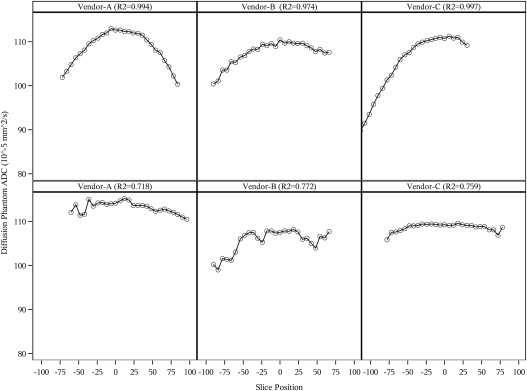
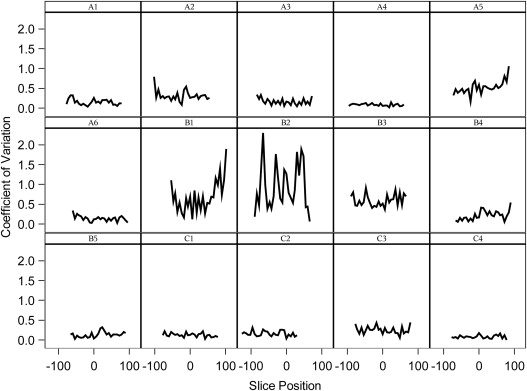
Ice–water diffusion phantoms for each PBTC site were distributed with a specific diffusion imaging protocol. The phantom was scanned four successive times to 1) confirm water in the tube reached thermal equilibrium and 2) allow for assessment of intra-examination ADC repeatability. ADC profiles across slice positions for each vendor and institution combination were characterized using linear regression modeling with a quadratic fit.
Results
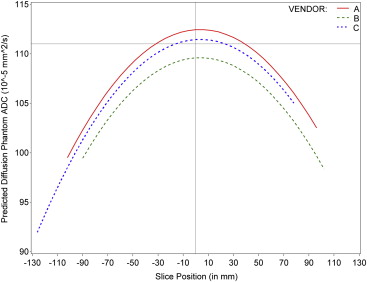
Eleven sites collected data with a high degree of compliance to the diffusion protocol for each scanner. The mean ADC value at slice position zero for vendor A was 1.123 × 10 −3 mm 2 /s, vendor B was 1.0964 × 10 −3 mm 2 /s, and vendor C was 1.110 × 10 −3 mm 2 /s. The percentage coefficient of variation across all sites was 0.309% (standard deviation = 0.322). The ADC values conformed well to a second-order polynomial along the z-axis, (ie, following a linear model pattern with quadratic fit) for vendor–institution combinations and across vendor–institution combinations as shown in the longitudinal model.
Conclusions
Assessment of the variability of diffusion metrics is essential for establishing the validity of using these quantitative metrics in multicenter trials. The low variability in ADC values across vendors and institutions and validates the use of ADC as a quantitative tumor marker in pediatric multicenter trials.
Pediatric brain tumors are the most common type of solid tumor among children, the second most frequent childhood malignancy after leukemia, and the leading cause of death from solid tumors in this population . An estimated 4452 new cases of childhood malignant brain and central nervous system (CNS) tumors are expected to be diagnosed in 2014 . Efforts to accrue sufficient numbers of patients for investigating more effective treatment strategies must hinge largely on multicenter trials, a defining feature of the National Institutes of Health–funded Pediatric Brain Tumor Consortium (PBTC), established in 1999. The PBTC’s primary objective is to rapidly conduct novel phase I and II clinical evaluations of therapeutic drugs, new biological therapies, treatment delivery technologies, and radiation treatment strategies in children from infancy to 21 years of age with primary CNS tumors. A second objective is to characterize reliable markers and predictors (direct or surrogate) of brain tumor responses to new therapies. A third objective is to develop and coordinate innovative neuroimaging techniques. Through the PBTC’s Neuroimaging Center, formed in May 2000, correlative imaging endpoints and research to evaluate new therapies are in progress .
Magnetic resonance imaging (MRI) is the leading imaging modality for evaluating a child with suspected brain tumor. It has unique multiplanar capabilities that offer detailed anatomic information with superior resolution and sensitivity. MRI is typically used for making a preoperative diagnosis and for guiding treatment planning including image-guided therapies such as surgery, chemotherapy, and radiotherapy. In addition, it is used for tumor follow-up, for evaluating disease progression, and for assessing both treatment response and effects of therapy.
Get Radiology Tree app to read full this article<
Get Radiology Tree app to read full this article<
Materials and methods
Data Collection
Get Radiology Tree app to read full this article<
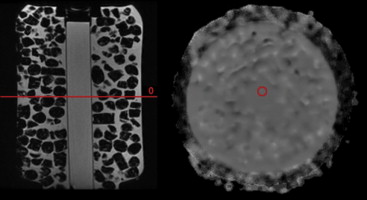
Table 1
MR Recommended Imaging Parameters for Diffusion Phantom (Top Row) with Site Compliance Figures (Subsequent Rows)
Site Vendor Field Strength (T) Field of View (mm) Acquisition Matrix Reconstruction Matrix Orientation Quantity of Slices TR (ms) TE (ms) Number Gradient Directions Frequency Encoding Bandwidth per Pixel (Hz) Requested protocol A, B, C 3.0 240 × 240 128 × 128 256 × 256 axial 27 ≥6000 75–100 3 orthogonal axes 1500–2500 A1 A 3.0 240 × 240 128 × 128 256 × 256 axial 27 6000 72.5 3 1953.12 A2 A 1.5 239 × 239 128 × 128 256 × 256 axial 27 6000 66.7 3 1953.12 A3 A 1.5 279 × 279 128 × 128 256 × 256 axial 27 8000 80.8 3 1953.12 A4 A 3.0 239 × 239 128 × 128 256 × 256 axial 27 6000 67.3 3 1953.12 A5 A 3.0 239 × 239 128 × 128 256 × 256 axial 27 8000 87.3 3 1953.12 A6 A 3.0 239 × 239 128 × 128 256 × 256 axial 27 6000 67.3 3 1953.12 B1 B 3.0 238 × 238 128 × 128 256 × 256 axial 27 6000 89.2 3 2288 B2 B 3.0 240 × 240 128 × 128 256 × 256 axial 27 6000 100 3 2410 B3 B 3.0 239 × 239 128 × 128 256 × 256 axial 27 6000 75 15 2408 B4 B 3.0 239 × 239 128 × 128 256 × 256 axial 27 7000 89.6 3 2349 B5 B 3.0 239 × 239 128 × 128 256 × 256 axial 27 7000 89.6 3 2410 C1 C 3.0 240 × 240 130 × 130 260 × 260 axial 27 6000 84 3 1830 C2 C 3.0 239 × 239 130 × 130 260 × 260 axial 27 7000 92 3 1605 C3 C 3.0 239 × 239 130 × 130 260 × 260 axial 27 6000 93 3 1672 C4 C 3.0 240 × 240 128 × 128 128 × 128 axial 27 9400 101 3 1345
A1–A6, vendor A; B1–B5, vendor B; C1–C4, vendor C; Hz, Hertz; MR, magnetic resonance; T, Tesla; TE, echo time; TR, relaxation time.
Get Radiology Tree app to read full this article<
Data Analysis
Get Radiology Tree app to read full this article<
Statistical Considerations
Get Radiology Tree app to read full this article<
Results
Get Radiology Tree app to read full this article<
Get Radiology Tree app to read full this article<
Get Radiology Tree app to read full this article<
Table 2
Individual Model Quadratic Regression Fits for ADC Values for Each Vendor–Site Combination
Vendor–Institution Intercept ( P Value) Linear Effect ( P Value) Quadratic Effect ( P Value) R 2 A1 112.23 (<.0001) 0.0180 (.0042) −0.0025 (<.0001) 0.950 A2 111.10 (<.0001) −0.0301 (<.0001) −0.0008 (<.0001) 0.863 A3 113.08 (<.0001) −0.0084 (.0011) −0.0014 (<.0001) 0.969 A4 112.43 (<.0001) 0.0343 (<.0001) −0.0005 (<.0001) 0.773 A5 112.70 (<.0001) 0.0186 (<.0001) −0.0019 (<.0001) 0.994 A6 114.21 (<.0001) 0.0055 (.17) −0.0005 (<.0001) 0.718 B1 111.32 (<.0001) 0.0157 (.0011) −0.0012 (<.0001) 0.961 B2 107.65 (<.0001) 0.0147 (.0295) −0.0008 (<.0001) 0.772 B3 109.83 (<.0001) 0.0164 (<.0001) −0.0009 (<.0001) 0.974 B4 109.08 (<.0001) 0.0204 (<.0001) −0.0017 (<.0001) 0.968 B5 110.29 (<.0001) 0.0107 (.0037) −0.0011 (<.0001) 0.927 C1 111.56 (<.0001) −0.035 (<.0001) −0.0013 (<.0001) 0.945 C2 111.19 (<.0001) −0.0144 (.0075) −0.0018 (<.0001) 0.997 C3 109.44 (<.0001) 0.0035 (.0707) −0.0004 (<.0001) 0.759 C4 112.51 (<.0001) −0.0134 (<.0001) −0.0013 (<.0001) 0.950
A1–A6, vendor A; ADC, apparent diffusion coefficient; B1–B5, vendor B; C1–C4, vendor C; R 2 , r squared.
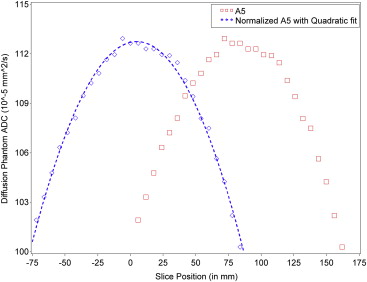
Table 3
Random Coefficients Model for ADC Values Across Sites
Effect Estimate Standard Error_P_ Value Intercept (SP = 0) for vendor C (reference group) 111.44 0.23 <.0001 Intercept difference for vendor A compared to C 1.00 0.263 .0002 Intercept difference for vendor B compared to C −1.85 0.28 <.0001 Slice position 0.0083 0.0069 .2549 Slice position 2 −0.00116 0.000048 <.0001
ADC, apparent diffusion coefficient; SP, slice position.
Get Radiology Tree app to read full this article<
Get Radiology Tree app to read full this article<
Get Radiology Tree app to read full this article<
Get Radiology Tree app to read full this article<
Get Radiology Tree app to read full this article<
Discussion
Get Radiology Tree app to read full this article<
Get Radiology Tree app to read full this article<
Conclusions
Get Radiology Tree app to read full this article<
Acknowledgment
Get Radiology Tree app to read full this article<
Get Radiology Tree app to read full this article<
References
1. Gurney J., Smith M., Bunin G.: CNS and miscellaneous intracranial and intraspinal neoplasms.Ries L.Smith M.Gurney J.Cancer incidence and survival among children and adolescents: United States SEER Program 1975–1995, NIH Publication No. 99–4649.1999.National Cancer Institute SEER ProgramBethesda, MD:pp. 51-63.
2. 2014.National Program of Cancer RegistriesHinsdale, IL
3. Poussaint T.Y., Phillips P.C., Vajapeyam S., et. al.: The Neuroimaging Center of the Pediatric Brain Tumor Consortium-collaborative neuroimaging in pediatric brain tumor research: a work in progress. AJNR Am J Neuroradiol 2007; 28: pp. 603-607.
4. Chenevert T.L., Meyer C.R., Moffat B.A., et. al.: Diffusion MRI: a new strategy for assessment of cancer therapeutic efficacy. Mol Imaging 2002; 1: pp. 336-343.
5. Chenevert T.L., Ross B.D.: Diffusion imaging for therapy response assessment of brain tumor. Neuroimaging Clin N Am 2009; 19: pp. 559-571.
6. Gauvain K.M., McKinstry R.C., Mukherjee P., et. al.: Evaluating pediatric brain tumor cellularity with diffusion-tensor imaging. AJR Am J Roentgenol 2001; 177: pp. 449-454.
7. Padhani A.R., Liu G., Koh D.M., et. al.: Diffusion-weighted magnetic resonance imaging as a cancer biomarker: consensus and recommendations. Neoplasia 2009; 11: pp. 102-125.
8. Mulkern R.V., Forbes P., Dewey K., et. al.: Establishment and results of a magnetic resonance quality assurance program for the pediatric brain tumor consortium. Acad Radiol 2008; 15: pp. 1099-1110.
9. Workshop on Population Imaging, March 25, 2010, The Hague, The Netherlands. Available at: http://www.populationimaging.eu . Accessed October 5, 2014
10. Chenevert T.L., Galban C.J., Ivancevic M.K., et. al.: Diffusion coefficient measurement using a temperature-controlled fluid for quality control in multicenter studies. J Magn Reson Imaging 2011; 34: pp. 983-987.
11. Malyarenko D., Galban C.J., Londy F.J., et. al.: Multi-system repeatability and reproducibility of apparent diffusion coefficient measurement using an ice-water phantom. J Magn Reson Imaging 2013; 37: pp. 1238-1246.
12. Malyarenko D.I., Ross B.D., Chenevert T.L.: Analysis and correction of gradient nonlinearity bias in apparent diffusion coefficient measurements. Magn Reson Med 2014; 71: pp. 1312-1323.
13. Mulkern R.V., Davis P.E., Haker S.J., et. al.: Complementary aspects of diffusion imaging and fMRI; I: structure and function. Magn Reson Imaging 2006; 24: pp. 463-474.
14. Malyarenko D., Newitt D., Tudorica A., et. al.: Quantitative imaging network demonstration of ADC nonlinearity bias in multi-center trials. Proc Intl Soc Mag Reson Med 2014; 22: pp. 4506.