
Rationale and Objectives
The purpose of this study was to evaluate the effect of reduced tube current (dose) on lung nodule detection in pediatric multidetector array computed tomography (MDCT).
Materials and Methods
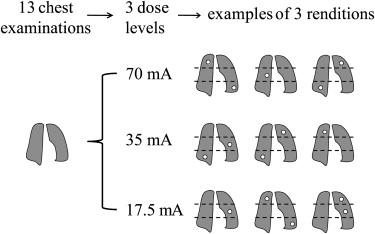
The study included normal clinical chest MDCT images of 13 patients (aged 1–7 years) scanned at tube currents of 70 to 180 mA. Calibrated noise addition software was used to simulate cases as they would have been acquired at 70 mA (the lowest original tube current), 35 mA (50% reduction), and 17.5 mA (75% reduction). Using a validated nodule simulation technique, small lung nodules of 3 to 5 mm in diameter were inserted into the cases, which were then randomized and rated independently by three experienced pediatric radiologists for nodule presence on a continuous scale ranging from zero (definitely absent) to 100 (definitely present). The observer data were analyzed to assess the influence of dose on detection accuracy using the Dorfman-Berbaum-Mets method for multiobserver, multitreatment receiver-operating characteristic (ROC) analysis and the Williams trend test.
Results
The areas under the ROC curves were 0.95, 0.91, and 0.92 at 70, 35, and 17.5 mA, respectively, with standard errors of 0.02 and interobserver variability of 0.02. The Dorfman-Berbaum-Mets method and the Williams trend test yielded P values for the effect of dose of .09 and .05, respectively.
Conclusion
Tube current (dose) has a weak effect on the detection accuracy of small lung nodules in pediatric MDCT. The effect on detection accuracy of a 75% dose reduction was comparable to interobserver variability, suggesting a potential for dose reduction.
Because of the superior resolution of modern multidetector array computed tomography (MDCT), chest computed tomography (CT) examination for the detection of lung nodules is often standard for pediatric cancer staging and surveillance. In such examinations, the presence of even one small lung nodule may have tremendous prognostic and therapeutic implications . However, chest CT involves the irradiation of many radiosensitive organs, including the thyroids, lungs, breasts, stomach, esophagus, and bone marrow; these organs are at risk for radiation-induced cancer later in life . Therefore, reducing radiation dose from chest CT is an important area of investigation .
Several previous studies on the pediatric population have suggested that diagnostic-quality images of the lung could be obtained at significantly reduced tube currents. However, those studies were preference based; images at reduced tube currents were evaluated by assigning subjective image quality scores to known anatomic structures. The results of such studies do not necessarily reflect the actual performance of radiologists in terms of lung nodule detection at reduced tube currents. Performance-based evaluations have been hindered by two major challenges: (1) the low occurrence of isolated small lung nodules in the pediatric population makes it difficult to research with real lung nodules, and (2) ethical concerns prohibit repeated scans to be performed on the same patients at different tube currents.
Get Radiology Tree app to read full this article<
Get Radiology Tree app to read full this article<
Materials and methods
Clinical Cases
Get Radiology Tree app to read full this article<
Noise Simulation
Get Radiology Tree app to read full this article<
Get Radiology Tree app to read full this article<
Get Radiology Tree app to read full this article<
Get Radiology Tree app to read full this article<
Get Radiology Tree app to read full this article<
Get Radiology Tree app to read full this article<
Get Radiology Tree app to read full this article<
To enlarge the scale of our study, three copies of each case were made to create a total of 117 series (13 patients × 3 dose levels × 3 copies) to serve as background for nodule simulation.
Get Radiology Tree app to read full this article<
Nodule Simulation
Get Radiology Tree app to read full this article<
Get Radiology Tree app to read full this article<
Get Radiology Tree app to read full this article<
Observer Experiment
Get Radiology Tree app to read full this article<
Data Analysis
Get Radiology Tree app to read full this article<
Get Radiology Tree app to read full this article<
Get Radiology Tree app to read full this article<
Results
Get Radiology Tree app to read full this article<
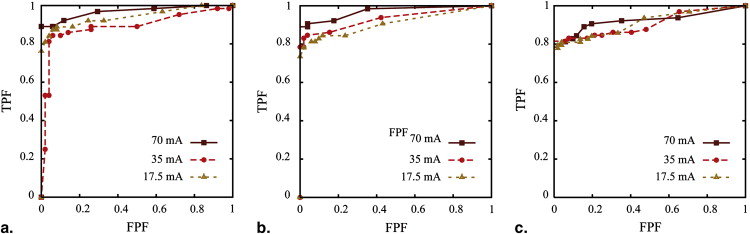
Table 1
Areas Under the Receiver-Operating Characteristic Curves (±0.02)
Observer Tube Current (mA) 1 2 3 Average 70 0.97 0.97 0.92 0.95 35 0.89 0.93 0.91 0.91 17.5 0.94 0.91 0.91 0.92
Get Radiology Tree app to read full this article<
Get Radiology Tree app to read full this article<
Discussion
Get Radiology Tree app to read full this article<
Get Radiology Tree app to read full this article<
Get Radiology Tree app to read full this article<
Get Radiology Tree app to read full this article<
Get Radiology Tree app to read full this article<
Get Radiology Tree app to read full this article<
Conclusion
Get Radiology Tree app to read full this article<
Appendix
Evaluation and calibration of GE noise addition tool
Evaluation Methods
Get Radiology Tree app to read full this article<
Get Radiology Tree app to read full this article<
Get Radiology Tree app to read full this article<
Calibration
Get Radiology Tree app to read full this article<
ln(σreal)=α0+α1d+α2ln(mAreal)+α3d2+α4ln2(mAreal)+α5dln(mAreal) ln
(
σ
real
)
=
α
0
+
α
1
d
+
α
2
ln
(
mA
real
)
+
α
3
d
2
+
α
4
ln
2
(
mA
real
)
+
α
5
d
ln
(
mA
real
)
and
ln(σsim)=β0+β1d+β2ln(mAsim)+β3d2+β4ln2(mAsim)+β5dln(mAsim), ln
(
σ
sim
)
=
β
0
+
β
1
d
+
β
2
ln
(
mA
sim
)
+
β
3
d
2
+
β
4
ln
2
(
mA
sim
)
+
β
5
d
ln
(
mA
sim
)
,
using commercial surface fitting software (OriginPro 8 version 8.0725; OriginLab Corporation, Northampton, MA). In the above equations, σ real and σ sim are the real and simulated noise magnitude, mA real and mA sim are the real and simulated tube currents, and d is phantom diameter. Coefficients α i and β i ( i = 0, 1,…, 5) extracted from the fits were then used to calculate the nominal simulation tube current that provided the same noise magnitude as that at the desired actual tube current or, conversely, to calculate the actual tube current that was represented by a nominal simulation tube current inputted to the noise tool. After tube current calibration, the accuracy of the simulated noise magnitude was reevaluated.
Get Radiology Tree app to read full this article<
Evaluation and Calibration Results
Get Radiology Tree app to read full this article<
Get Radiology Tree app to read full this article<
Get Radiology Tree app to read full this article<
![Figure A1, Noise texture of (a) real (small bowtie filter, 120 kVp, 60 mA) and (b) simulated (small bowtie filter, 120 kVp, nominal simulated [sim] tube current of 60 mA, simulated from an actual image acquired at 200 mA) computed tomographic (CT) images of the 20-cm water phantom. A 64-pixel region of interest from the center of each image enlarged by 4 times is displayed at the lower right-hand corner of each image to allow a close view of the noise texture. (c) Normalized noise power spectra (NNPS) of real and simulated CT images of the 20-cm water phantom acquired using the small bowtie filter at tube potential of 120 kVp and tube current of 100 mA. The NNPS were further normalized relative to their respective peak values to compare spectral shapes. The spectral shapes of NNPS at other tube potential and current settings were similar.](https://storage.googleapis.com/dl.dentistrykey.com/clinical/PediatricMDCT/2_1s20S1076633209001330.jpg)
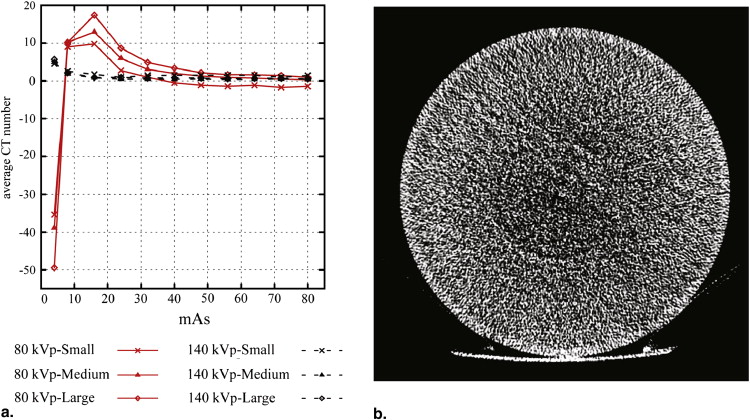
Table A1
Scan Parameters Used to Acquire Images From Six Water Phantoms ∗
Bowtie Filter Diameter (cm) Pitch Slice Thickness (mm) † DFOV (cm) Small 12.7 0.984 3.75 20 15.3 0.984 3.75 25 17.8 1.375 5 25 20.0 1.375 5 25 Medium 17.8 1.375 5 25 20.0 1.375 5 25 23.3 1.375 5 36 27.0 1.375 5 32 Large 20.0 1.375 5 25 23.3 1.375 5 36 27.0 1.375 5 32
DFOV, display (reconstruction) field of view.
Get Radiology Tree app to read full this article<
Get Radiology Tree app to read full this article<
Table A2
Minimum Tube Current-Time Product (mAs) ∗
Tube Potential (kVp) Bowtie Filter Diameter (cm) 80 100 120 140 Small 12.7 4 4 4 4 15.3 8 4 4 4 17.8 8 8 4 4 20.0 16 8 4 4 Medium 17.8 16 8 4 4 20.0 24 8 4 4 23.3 24 16 8 4 27.0 56 16 8 4 Large 20.0 32 16 8 4 23.3 32 16 8 4 27.0 56 24 8 8
Get Radiology Tree app to read full this article<
Table A3
Coefficients of Polynomial Equations A1 and A2 Describing Real and Simulated Noise in Images of Water Phantoms as Functions of Phantom Diameter and Tube Current
Noise Real ∗ Bowtie Filter Tube Potential Coefficient Adjusted R 2 α 0 α 1 α 2 α 3 α 4 α 5 Small 80 4.42809 0.01476 −0.63593 0.00742 0.05724 −0.02681 0.990 100 4.05954 −0.00583 −0.52538 0.00490 0.01714 −0.00877 0.993 120 3.97994 −0.02059 −0.52299 0.00471 0.01276 −0.00576 0.995 140 3.94392 −0.02886 −0.52743 0.00440 0.00723 −0.00249 0.996 Medium 80 1.64157 0.26954 −0.42099 −0.00048 0.03194 −0.02331 0.975 100 1.54965 0.28661 −0.61874 −0.00187 0.05493 −0.02037 0.986 120 1.24914 0.27993 −0.55677 −0.00275 0.03529 −0.01306 0.990 140 1.26746 0.25753 −0.51762 −0.00282 0.02260 −0.00886 0.993 Large 80 10.17070 −0.12202 −1.94568 0.00783 0.18631 −0.02452 0.998 100 5.52959 −0.05413 −0.56413 0.00526 0.05182 −0.02125 0.999 120 4.96463 −0.03127 −0.54763 0.00382 0.03951 −0.01467 0.999 140 4.66454 −0.01537 −0.56091 0.00271 0.02667 −0.00824 0.999 Simulated β 0 β 1 β 2 β 3 β 4 β 5 Small 80 5.32980 −0.09420 −0.76424 0.00530 0.02829 0.00722 0.993 100 5.07604 −0.07876 −0.61616 0.00394 −0.00854 0.01022 0.995 120 4.63546 −0.05051 −0.61640 0.00314 −0.00548 0.00891 0.994 140 4.47683 −0.05519 −0.64763 0.00343 0.00350 0.00791 0.994 Medium 80 5.03943 0.03963 −0.99079 −0.00007 0.02920 0.01576 0.993 100 2.76751 0.18154 −0.72131 −0.00265 0.01716 0.00602 0.996 120 2.17034 0.21300 −0.70031 −0.00336 0.01650 0.00520 0.997 140 3.25378 0.13269 −0.84735 −0.00227 0.02278 0.01020 0.997 Large 80 7.45078 −0.22402 −0.93278 0.00613 0.05620 0.01045 0.997 100 4.80621 0.00321 −0.86714 0.00105 0.05076 0.00580 0.999 120 4.18627 0.02800 −0.79986 0.00060 0.04929 0.00331 0.999 140 3.77092 0.04403 −0.79241 0.00027 0.05152 0.00289 0.999
Get Radiology Tree app to read full this article<
FLOAT NOT FOUND
Get Radiology Tree app to read full this article<
References
1. Absalon M.J., McCarville M.B., Liu T., Santana V.M., Daw N.C., Navid F.: Pulmonary nodules discovered during the initial evaluation of pediatric patients with bone and soft-tissue sarcoma. Pediatr Blood Cancer 2008; 50: pp. 1147-1153.
2. Tack D., Gevenois P.A.: Radiation dose in computed tomography of the chest. JBR-BTR 2004; 87: pp. 281-288.
3. Brenner D.J., Hall E.J.: Computed tomography—an increasing source of radiation exposure. N Engl J Med 2007; 357: pp. 2277-2284.
4. Kubo T., Lin P.J., Stiller W., et. al.: Radiation dose reduction in chest CT: a review. AJR Am J Roentgenol 2008; 190: pp. 335-343.
5. Rogalla P., Stover B., Scheer I., Juran R., Gaedicke G., Hamm B.: Low-dose spiral CT: applicability to paediatric chest imaging. Pediatr Radiol 1999; 29: pp. 565-569.
6. Lucaya J., Piqueras J., Garcia-Pena P., Enriquez G., Garcia-Macias M., Sotil J.: Low-dose high-resolution CT of the chest in children and young adults: dose, cooperation, artifact incidence, and image quality. AJR Am J Roentgenol 2000; 175: pp. 985-992.
7. Shah R., Gupta A.K., Rehani M.M., Pandey A.K., Mukhopadhyay S.: Effect of reduction in tube current on reader confidence in paediatric computed tomography. Clin Radiol 2005; 60: pp. 224-231.
8. Seltzer S.E., Judy P.F., Adams D.F., et. al.: Spiral CT of the chest: comparison of cine and film-based viewing. Radiology 1995; 197: pp. 73-78.
9. Rusinek H., Naidich D.P., McGuinness G., et. al.: Pulmonary nodule detection: low-dose versus conventional CT. Radiology 1998; 209: pp. 243-249.
10. Shin H.O., Blietz M., Frericks B., Baus S., Savellano D., Galanski M.: Insertion of virtual pulmonary nodules in CT data of the chest: development of a software tool. Eur Radiol 2006; 16: pp. 2567-2574.
11. Zhang X., Olcott E., Raffy P., Yu N., Chui H.: Simulating solid lung nodules in MDCT images for CAD evaluation: modeling, validation, and applications.Giger M.Karssemeijer N.Proceedings of SPIE: medical imaging-computer-aided diagnosis, vol 6514.2007.International Society for Optical EngineeringBellingham, WA: 65140Z
12. Punwani S., Zhang J., Davies W., Greenhalgh R., Humphries P.: Paediatric CT: the effects of increasing image noise on pulmonary nodule detection. Pediatr Radiol 2008; 38: pp. 192-201.
13. Mayo J.R., Whittall K.P., Leung A.N., et. al.: Simulated dose reduction in conventional chest CT: validation study. Radiology 1997; 202: pp. 453-457.
14. Frush D.P., Slack C.C., Hollingsworth C.L., et. al.: Computer-simulated radiation dose reduction for abdominal multidetector CT of pediatric patients. AJR Am J Roentgenol 2002; 179: pp. 1107-1113.
15. Britten A.J., Crotty M., Kiremidjian H., Grundy A., Adam E.J.: The addition of computer simulated noise to investigate radiation dose and image quality in images with spatial correlation of statistical noise: an example application to x-ray CT of the brain. Br J Radiol 2004; 77: pp. 323-328.
16. Mayo J.R., Kim K.I., MacDonald S.L., et. al.: Reduced radiation dose helical chest CT: effect on reader evaluation of structures and lung findings. Radiology 2004; 232: pp. 749-756.
17. Sennst D.A., Kachelriess M., Leidecker C., Schmidt B., Watzke O., Kalender W.A.: An extensible software-based platform for reconstruction and evaluation of CT images. Radiographics 2004; 24: pp. 601-613.
18. Tack D., De Maertelaer V., Petit W., et. al.: Multi-detector row CT pulmonary angiography: comparison of standard-dose and simulated low-dose techniques. Radiology 2005; 236: pp. 318-325.
19. Brem M.H., Zamani A.A., Riva R., et. al.: Multidetector CT of the paranasal sinus: potential for radiation dose reduction. Radiology 2007; 243: pp. 847-852.
20. Wessling J., Esseling R., Raupach R., et. al.: The effect of dose reduction and feasibility of edge-preserving noise reduction on the detection of liver lesions using MSCT. Eur Radiol 2007; 17: pp. 1885-1891.
21. Li X, Samei E, DeLong D, et al. Three-dimensional simulation of lung nodules for pediatric multi-detector array CT. Br J Radiol. In press.
22. Toth T, Castellanos R, Horst A, Tuszynski L, Thomas A. A method to determine optimum CT automatic exposure control scan parameter settings. Presented at: Radiological Society of North America, 92nd Scientific Assembly and Annual Meeting; Chicago, IL; 2006.
23. Li X., Samei E.: Comparison of patient size-based methods for estimating quantum noise in CT images of the lung. Med Phys 2009; 36: pp. 541-546.
24. Dorfman D.D., Berbaum K.S., Metz C.E.: Receiver operating characteristic rating analysis. Generalization to the population of readers and patients with the jackknife method. Invest Radiol 1992; 27: pp. 723-731.
25. Dorfman D.D., Berbaum K.S., Lenth R.V., Chen Y.F.: Monte Carlo validation of a multireader method for receiver operating characteristic discrete rating data: split-plot experimental design.Krupinski E.A.Proceedings of SPIE: medical imaging-image perception and performance, vol. 3663.1999.International Society for Optical EngineeringBellingham, WA:pp. 91.
26. Winer B.J.: Statistical principles in experimental design.1971.McGraw-HillNew York
27. Williams D.A.: A test for differences between treatment means when several dose levels are compared with a zero dose control. Biometrics 1971; 27: pp. 103-117.
28. Diederich S., Lenzen H., Windmann R., et. al.: Pulmonary nodules: experimental and clinical studies at low-dose CT. Radiology 1999; 213: pp. 289-298.
29. Karabulut N., Toru M., Gelebek V., Gulsun M., Ariyurek O.M.: Comparison of low-dose and standard-dose helical CT in the evaluation of pulmonary nodules. Eur Radiol 2002; 12: pp. 2764-2769.
30. Wormanns D., Ludwig K., Beyer F., Heindel W., Diederich S.: Detection of pulmonary nodules at multirow-detector CT: effectiveness of double reading to improve sensitivity at standard-dose and low-dose chest CT. Eur Radiol 2005; 15: pp. 14-22.
31. Xu X.J., Lou F.L., Zhang M.M., Pan Z.M., Zhang L.: Usefulness of low-dose CT in the detection of pulmonary metastasis of gestational trophoblastic tumours. Clin Radiol 2007; 62: pp. 998-1003.
32. Metz C.E.: ROC methodology in radiologic imaging. Invest Radiol 1986; 21: pp. 720-733.
33. Berbaum K.S., Franken E.A., Dorfman D.D., et. al.: Satisfaction of search in diagnostic radiology. Invest Radiol 1990; 25: pp. 133-140.
34. Egglin T.K., Feinstein A.R.: Context bias. A problem in diagnostic radiology. JAMA 1996; 276: pp. 1752-1755.
35. Beutel J.Kundel H.L.Van Matter R.L.Handbook of medical imaging, vol. 1: physics and psychophysics.2000.SPIE PressBellingham, WA:pp. 190-202.
36. Flynn M.J., Samei E.: Experimental comparison of noise and resolution for 2k and 4k storage phosphor radiography systems. Med Phys 1999; 26: pp. 1612-1623.