
Rationale and Objectives
This study compares the performance of T2 maps in the detection of prostate cancer (PCa) in comparison to T2-weighted (T2W) magnetic resonance images.
Materials and Methods
The prospective study was institutional review board approved. Consenting patients ( n = 45) with histologic confirmed PCa underwent preoperative 3-T magnetic resonance imaging with or without endorectal coil. Two radiologists, working independently, marked regions of interests (ROIs) on PCa lesions separately on T2W images and T2 maps. Each ROI was assigned a score of 1–5 based on the confidence in accurately detecting cancer, with 5 being the highest confidence. Subsequently, the histologically confirmed PCa lesions ( n = 112) on whole-mount sections were matched with ROIs to calculate sensitivity, positive predictive value (PPV), and radiologist confidence score. Quantitative T2 values of PCa and benign tissue ROIs were measured.
Results
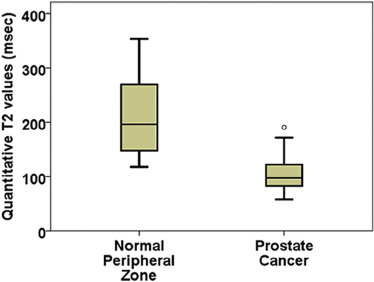
Sensitivity and confidence score for PCa detection were similar for T2W images (51%, 4.5 ± 0.8) and T2 maps (52%, 4.5 ± 0.6). However, PPV was significantly higher ( P = .001) for T2 maps (88%) compared to T2W (72%) images. The use of endorectal coils nominally improved sensitivity (T2W: 55 vs 47%, T2 map: 54% vs 48%) compared to the use of no endorectal coils, but not the PPV and the confidence score. Quantitative T2 values for PCa (105 ± 28 milliseconds) were significantly ( P = 9.3 × 10 −14 ) lower than benign peripheral zone tissue (211 ± 71 milliseconds), with moderate significant correlation with Gleason score ( ρ = −0.284).
Conclusions
Our study shows that review of T2 maps by radiologists has similar sensitivity but higher PPV compared to T2W images. Additional quantitative information obtained from T2 maps is helpful in differentiating cancer from normal prostate tissue and determining its aggressiveness.
Introduction
Prostate cancer (PCa) is the most common noncutaneous cancer and the second leading cause of death among men in the United States . Conventional prostate-specific antigen (PSA) screening and transrectal ultrasound-guided biopsies have low sensitivity in PCa detection . In addition, distinguishing low-risk tumors from potentially life-threatening tumors using PSA and transrectal ultrasound is inadequate, and many patients with low-risk tumors elect to undergo radical prostatectomy, a major procedure with potential quality of life-altering complications. These limitations emphasize the need for noninvasive imaging techniques for detection, staging, and risk stratification of PCa, which may enable better choice of treatment and reduce the overtreatment of indolent diseases .
Multiparametric magnetic resonance imaging (mpMRI) is increasingly being used for PCa diagnosis and guiding biopsies, and has high sensitivity, negative predictive value, and specificity in PCa diagnosis . mpMRI has the potential to provide reliable information about the cancer grade, location, and volume for the selection of optimum therapy . T2-weighted (T2W) imaging is an integral part of mpMRI protocol recommended by the American College of Radiology and the European Society of Urogenital Radiology in the consensus guidelines, Prostate Imaging Reporting and Data System (PI-RADS) . PCa shows hypointensity in T2W images compared to benign tissue and has a sensitivity of around 50%–70% for PCa detection . T2 mapping techniques require acquisition of multiple T2W images at various echo times (TEs). The signal from various TEs is then fitted an exponential magnetic resonance (MR) signal decay model to generate an estimate of the quantitative T2 values. Numerous studies have found that quantitative T2 values are significantly lower in PCa compared to benign prostate tissue . The interpretation of conventional T2W images is subjective as signal intensities in T2W images are not comparable between patients and contrast is highly dependent on imaging parameters. However, quantitative T2 values from T2 maps are absolute and comparable. The use of T2 maps may help mitigate the subjective nature of T2W image interpretation and allow improved PCa detection based on a subtle difference in T2 values between different tissues.
Get Radiology Tree app to read full this article<
Materials and Methods
Study Patients
Get Radiology Tree app to read full this article<
Magnetic Resonance Imaging
Get Radiology Tree app to read full this article<
TABLE 1
Magnetic Resonance Imaging Parameters
Imaging Sequence Pulse Sequence FOV (mm) Matrix Size In-plane Resolution (mm) TE (ms) TR (s) Group A: TSE without endorectal coil TSE (T2W) 180 240 × 240 0.75 × 0.75 115 4.5 TSE (T2 map) 200 250 × 250 0.8 × 0.8 38, 88, 138, 188, 238, 288 8.6 Group B: TSE with endorectal coil TSE (T2W) 160 400 × 400 0.4 × 0.4 115 4.2 TSE (T2 map) 160 212 × 212 0.75 × 0.75 30, 60, 90, 120, 150, 180, 210, 240, 270 8.8 Group C: TSE (T2W) and k - t -T2 (T2 map) with endorectal coil TSE (T2W) 160 400 × 400 0.4 × 0.4 115 4.2k - t -T2 (T2 map) 160 160 × 160 1.0 × 1.0 24, 36, 48, 60, 72, 84, 96, 108, 120, 132, 144, 156, 168, 180, 192, 204, 216, 228, 240, 252, 264, 276, 288, 300, 312, 324, 336, 348, 360, 382, 396 3.3
FOV, field of view; T2W, T2-weighted; TE, echo time; TR, repetition time; TSE, turbo spin echo.
Slice thickness = 3 mm, flip angle = 90°.
Scan time for T2 mapping using TSE sequence = 492 seconds (without endorectal coil) and 436 seconds (with endorectal coil), k - t -T2 sequence = 316 seconds.
Scan time for T2W imaging using TSE sequence = 270 seconds (without endorectal coil) and 381 seconds (with endorectal coil).
Get Radiology Tree app to read full this article<
Get Radiology Tree app to read full this article<
Get Radiology Tree app to read full this article<
Get Radiology Tree app to read full this article<
MR Image Analysis
Get Radiology Tree app to read full this article<
Get Radiology Tree app to read full this article<
Get Radiology Tree app to read full this article<
Results
Get Radiology Tree app to read full this article<
TABLE 2
Histologic Confirmed Cancers
Overall Group A: TSE without Endorectal Coil Group B: TSE with Endorectal Coil Group C: TSE (T2W) and k - t -T2 (T2 Map) with Endorectal Coil_n_ 112 43 32 37 Gleason score 3 + 3 54 19 13 22 3 + 4 42 19 13 10 4 + 3 15 4 6 5 4 + 5 1 1 — — Stage T2 87 38 20 29 T2c 8 1 2 5 T3 1 1 — — T3a 14 1 10 3 T3b 2 2 — — Mean tumor size (range) (cm 2 ) 1.6 × 0.8 (0.5–5.3 × 0.2–3.5) 1.5 × 0.8 (0.5–4.3 × 0.2–3.5) 1.7 × 0.9 (0.5–5.3 × 0.2–2.0) 1.5 × 0.7 (0.5–3.5 × 0.2–1.7)
T2W, T2-weighted; TSE, turbo spin echo.
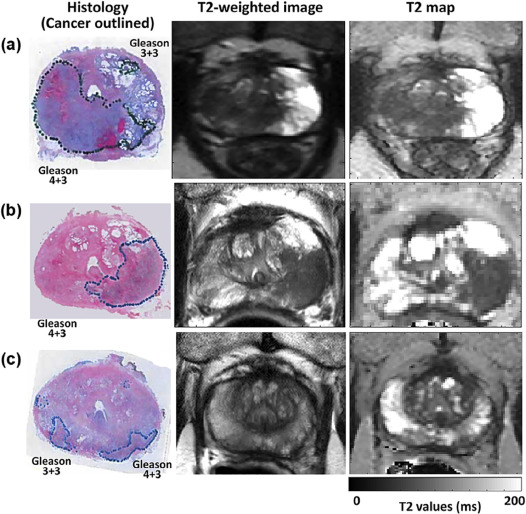
TABLE 3
Radiologist Performance Statistics
Magnetic Resonance Imaging Sequence Sensitivity (%) Positive Predictive Value (%) Confidence Score T2W vs T2 maps T2W Overall 51 72 4.5 ± 0.8 Radiologist 1 52 81 4.5 ± 0.8 Radiologist 2 51 65 4.5 ± 0.9 T2 map Overall 52 88 4.5 ± 0.6 Radiologist 1 57 88 4.7 ± 0.5 Radiologist 2 47 88 4.2 ± 0.5 Endorectal coil usage T2W No endorectal coil Overall 47 71 4.4 ± 1.0 Radiologist 1 47 80 4.4 ± 0.9 Radiologist 2 47 65 4.3 ± 1.0 Endorectal coil Overall 54 72 4.5 ± 0.8 Radiologist 1 55 81 4.6 ± 0.7 Radiologist 2 54 65 4.5 ± 0.8 T2 map No endorectal coil Overall 48 89 4.4 ± 0.9 Radiologist 1 53 88 4.8 ± 0.4 Radiologist 2 44 90 4.2 ± 0.5 Endorectal coil Overall 54 87 4.4 ± 0.5 Radiologist 1 59 87 4.8 ± 0.5 Radiologist 2 49 87 4.2 ± 0.5
T2W, T2-weighted.
Get Radiology Tree app to read full this article<
Qualitative Results
Get Radiology Tree app to read full this article<
Use of Endorectal Coil
Get Radiology Tree app to read full this article<
Interobserver Agreement
Get Radiology Tree app to read full this article<
Quantitative Results
Get Radiology Tree app to read full this article<
Get Radiology Tree app to read full this article<
Discussion
Get Radiology Tree app to read full this article<
Get Radiology Tree app to read full this article<
Get Radiology Tree app to read full this article<
Get Radiology Tree app to read full this article<
Get Radiology Tree app to read full this article<
Get Radiology Tree app to read full this article<
Get Radiology Tree app to read full this article<
Get Radiology Tree app to read full this article<
Get Radiology Tree app to read full this article<
Get Radiology Tree app to read full this article<
Conclusions
Get Radiology Tree app to read full this article<
Get Radiology Tree app to read full this article<
Get Radiology Tree app to read full this article<
References
1. Siegel R., Naishadham D., Jemal A.: Cancer statistics, 2012. CA Cancer J Clin 2012; 62: pp. 10-29.
2. Johnson L.M., Choyke P.L., Figg W.D., et. al.: The role of MRI in prostate cancer active surveillance. Biomed Res Int 2014; 2014: pp. 6.
3. Stephan C., Rittenhouse H., Hu X., et. al.: Prostate-specific antigen (PSA) screening and new biomarkers for prostate cancer (PCa). EJIFCC 2014; 25: pp. 55-78.
4. Ahmed H.U., El-Shater Bosaily A., Brown L.C., et. al.: Diagnostic accuracy of multi-parametric MRI and TRUS biopsy in prostate cancer (PROMIS): a paired validating confirmatory study. Lancet 2017; 389: pp. 815-822.
5. Gupta R.T., Kauffman C.R., Polascik T.J., et. al.: The state of prostate MRI in 2013. Oncology 2013; 27: pp. 262.
6. Baur A.D., Maxeiner A., Franiel T., et. al.: Evaluation of the prostate imaging reporting and data system for the detection of prostate cancer by the results of targeted biopsy of the prostate. Invest Radiol 2014; 49: pp. 411-420.
7. Wysock J.S., Lepor H.: Multi-parametric MRI imaging of the prostate-implications for focal therapy. Transl Androl Urol 2017; 6: pp. 453-463.
8. Weinreb J.C., Barentsz J.O., Choyke P.L., et. al.: PI-RADS prostate imaging—reporting and data system: 2015, version 2. Eur Urol 2016; 69: pp. 16-40.
9. Vilanova J.C., Barceló-Vidal C., Comet J., et. al.: Usefulness of prebiopsy multifunctional and morphologic MRI combined with free-to-total prostate-specific antigen ratio in the detection of prostate cancer. AJR Am J Roentgenol 2011; 196: pp. W715-W722.
10. Turkbey B., McKinney Y.L., Trivedi H., et. al.: Multiparametric 3T prostate magnetic resonance imaging to detect cancer: histopathological correlation using prostatectomy specimens processed in customized magnetic resonance imaging based molds. J Urol 2011; 186: pp. 1818-1824.
11. Rosenkrantz A.B., Deng F.-M., Kim S., et. al.: Prostate cancer: multiparametric MRI for index lesion localization—a multiple-reader study. AJR Am J Roentgenol 2012; 199: pp. 830-837.
12. Greer M.D., Brown A.M., Shih J.H., et. al.: Accuracy and agreement of PIRADSv2 for prostate cancer mpMRI: a multireader study. J Magn Reson Imaging 2017; 45: pp. 579-585.
13. Foltz W.D., Chopra S., Chung P., et. al.: Clinical prostate T2 quantification using magnetization-prepared spiral imaging. Magn Reson Med 2010; 64: pp. 1155-1161.
14. Liney G.P., Turnbull L.W., Lowry M., et. al.: In vivo quantification of citrate concentration and water T2 relaxation time of the pathologic prostate gland using 1H MRS and MRI. Magn Reson Imaging 1997; 15: pp. 1177-1186.
15. Hoang Dinh A., Souchon R., Melodelima C., et. al.: Characterization of prostate cancer using T2 mapping at 3 T: a multi-scanner study. Diagn Interv Imaging 2015; 96: pp. 365-372.
16. Gibbs P., Tozer D.J., Liney G.P., et. al.: Comparison of quantitative T2 mapping and diffusion-weighted imaging in the normal and pathologic prostate. Magn Reson Med 2001; 46: pp. 1054-1058.
17. Liu W., Turkbey B., Sénégas J., et. al.: Accelerated T(2) mapping for characterization of prostate cancer. Magn Reson Med 2011; 65: pp. 1400-1406.
18. Sénégas J., Liu W., Dahnke H., et. al.: Fast T2 relaxometry with an accelerated multi-echo spin-echo sequence. NMR Biomed 2010; 23: pp. 958-967.
19. Fedorov A., Beichel R., Kalpathy-Cramer J., et. al.: 3D slicer as an image computing platform for the quantitative imaging network. Magn Reson Imaging 2012; 30: pp. 1323-1341.
20. Turkbey B., Merino M.J., Gallardo E.C., et. al.: Comparison of endorectal coil and nonendorectal coil T2W and diffusion-weighted MRI at 3 Tesla for localizing prostate cancer: correlation with whole-mount histopathology. J Magn Reson Imaging 2014; 39: pp. 1443-1448.
21. Gawlitza J., Reiss-Zimmermann M., Thörmer G., et. al.: Impact of the use of an endorectal coil for 3 T prostate MRI on image quality and cancer detection rate. Sci Rep 2017; 7: pp. 40640.
22. Heijmink S.W.T.P.J., Fütterer J.J., Hambrock T., et. al.: Prostate cancer: body-array versus endorectal coil MR imaging at 3 T—comparison of image quality, localization, and staging performance. Radiology 2007; 244: pp. 184-195.
23. Gibbs P., Liney G.P., Pickles M.D., et. al.: Correlation of ADC and T2 measurements with cell density in prostate cancer at 3.0 Tesla. Invest Radiol 2009; 44: pp. 572-576.
24. Wang S., Agarwal H., Karczmar G.S., et. al.: Two-compartment T2 Decay for Prostate Cancer Diagnosis. Proc Intl Soc Mag Reson Med Toronto, Canada2015. 0944