
Rationale and Objectives
This study aimed to test high temporal resolution dynamic contrast-enhanced (DCE) magnetic resonance imaging (MRI) for different zones of the prostate and evaluate its performance in the diagnosis of prostate cancer (PCa). Determine whether the addition of ultrafast DCE-MRI improves the performance of multiparametric MRI.
Materials and Methods
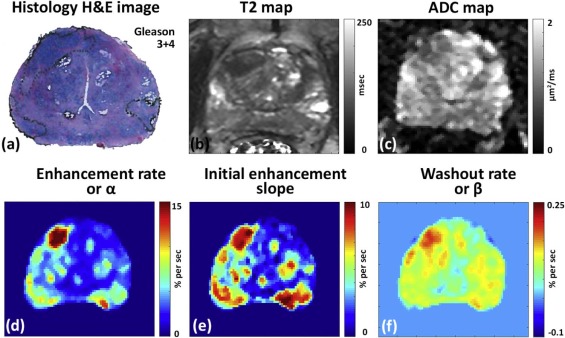
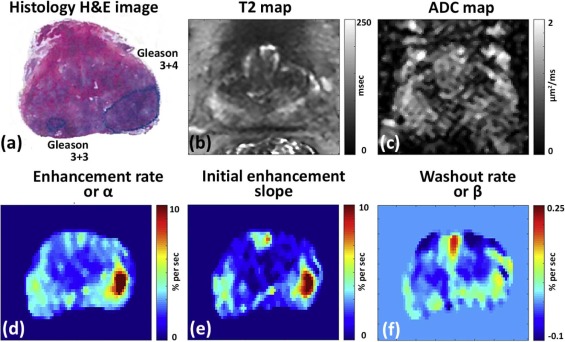
Patients ( n = 20) with pathologically confirmed PCa underwent preoperative 3T MRI with T2-weighted, diffusion-weighted, and high temporal resolution (~2.2 seconds) DCE-MRI using gadoterate meglumine (Guerbet, Bloomington, IN) without an endorectal coil. DCE-MRI data were analyzed by fitting signal intensity with an empirical mathematical model to obtain parameters: percent signal enhancement, enhancement rate (α), washout rate (β), initial enhancement slope, and enhancement start time along with apparent diffusion coefficient (ADC) and T2 values. Regions of interests were placed on sites of prostatectomy verified malignancy ( n = 46) and normal tissue ( n = 71) from different zones.
Results
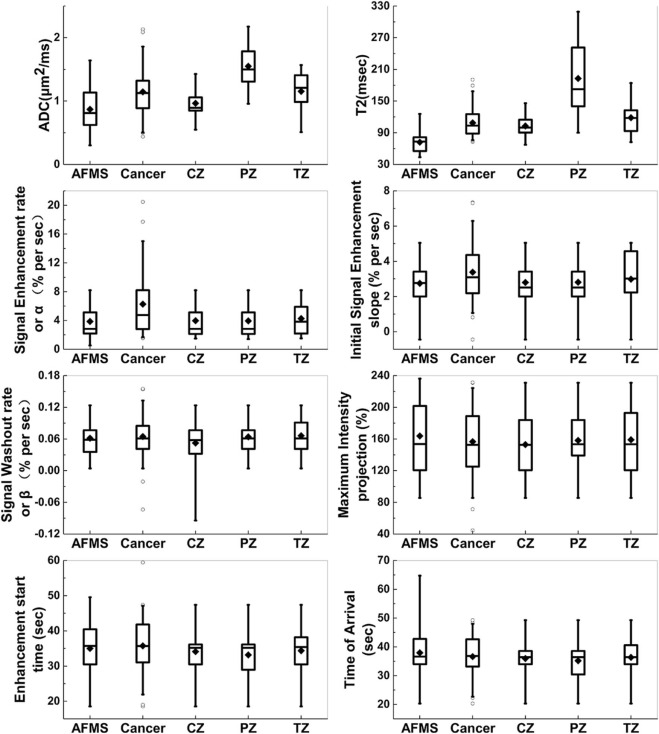
Cancer (α = 6.45 ± 4.71 s −1 , β = 0.067 ± 0.042 s −1 , slope = 3.78 ± 1.90 s −1 ) showed significantly ( P < .05) faster signal enhancement and washout rates than normal tissue (α = 3.0 ± 2.1 s −1 , β = 0.034 ± 0.050 s −1 , slope = 1.9 ± 1.4 s −1 ), but showed similar percentage signal enhancement and enhancement start time. Receiver operating characteristic analysis showed area under the curve for DCE parameters was comparable to ADC and T2 in the peripheral (DCE 0.67–0.82, ADC 0.80, T2 0.89) and transition zones (DCE 0.61–0.72, ADC 0.69, T2 0.75), but higher in the central zone (DCE 0.79–0.88, ADC 0.45, T2 0.45) and anterior fibromuscular stroma (DCE 0.86–0.89, ADC 0.35, T2 0.12). Importantly, combining DCE with ADC and T2 increased area under the curve by ~30%, further improving the diagnostic accuracy of PCa detection.
Conclusion
Quantitative parameters from empirical mathematical model fits to ultrafast DCE-MRI improve diagnosis of PCa. DCE-MRI with higher temporal resolution may capture clinically useful information for PCa diagnosis that would be missed by low temporal resolution DCE-MRI. This new information could improve the performance of multiparametric MRI in PCa detection.
Introduction
Prostate cancer (PCa) is the most common non-cutaneous cancer among men in the United States, with more than 200,000 men diagnosed with PCa yearly . Magnetic resonance imaging (MRI) is increasingly used in the detection and local staging of PCa. Dynamic contrast-enhanced (DCE) MRI is a valuable tool for clinical detection and diagnosis of PCa and for evaluating response of therapy . DCE-MRI along with T2-weighted (T2W) and diffusion-weighted imaging (DWI) is a key component of multiparametric MRI (mpMRI) of the prostate. The addition of DCE-MRI to T2W and DWI improves the diagnostic accuracy in PCa detection .
In the recent Prostate Imaging-Reporting and Data System (PI-RADS) version 2 consensus guidelines , DCE is designated as secondary to DWI and T2W imaging. A temporal resolution higher than 10–15 seconds per image is recommended for clinical use . However, the full potential of DCE-MRI may not be reached and, in particular, the details of the contrast uptake kinetics may not be captured when data are acquired with relatively low temporal resolution. An investigation of the effect of temporal resolution on diagnostic performance of DCE-MRI in PCa detection showed higher temporal resolution leads to increased diagnostic performance . Recent studies looking at high temporal resolution (<10 seconds) DCE in the prostate showed that signal enhancement during the first 30–40 seconds after contrast media injection is very sparse, and that therefore, PCa can be detected more accurately at very early times after injection .
Get Radiology Tree app to read full this article<
Get Radiology Tree app to read full this article<
Materials and Methods
Study Patients
Get Radiology Tree app to read full this article<
MRI
Get Radiology Tree app to read full this article<
Table 1
MR Imaging Parameters
Imaging Sequence Pulse Sequence FOV (mm) Scan Matrix Size Resolution (mm) TE (ms) TR (ms) Slice Thickness (mm) Flip Angle (°) Axial T2WI SE-TSE 200 256 × 256 0.8 × 0.8 38,88,138, 188,238,288 8200 3 90 DWI \* SE-EPI 220 150 × 150 1.5 × 1.5 75 4700 3 90 Ultrafast DCE † T1-FFE 200 160 × 160 1.25 × 1.25 1.4 3.8 3 10
EPI, echo planar imaging; FFE, fast field echo; FOV, field of view; SE, spin echo; TE, echo time; TR, repetition time; TSE, turbo spin echo.
Get Radiology Tree app to read full this article<
Get Radiology Tree app to read full this article<
Get Radiology Tree app to read full this article<
Semiquantitative MR Image Analysis
Get Radiology Tree app to read full this article<
Get Radiology Tree app to read full this article<
Get Radiology Tree app to read full this article<
STE=S0exp(−TE/T2), S
T
E
=
S
0
exp
(
−
T
E
/
T
2
)
,
where S TE is the signal measured at each TE, and S 0 is the extrapolated signal at TE = 0 ms.
Get Radiology Tree app to read full this article<
Get Radiology Tree app to read full this article<
Sb=SSEexp(−b.ADC), S
b
=
S
S
E
exp
(
−
b
.
A
D
C
)
,
where b or b -value is the diffusion-weighting factor, S b is the attenuated spin-echo signal measured at each b -value, and S SE is the maximum spin-echo signal without diffusion attenuation ( b = 0).
Get Radiology Tree app to read full this article<
Get Radiology Tree app to read full this article<
PSE(t)=S(t)−S0S0×100 P
S
E
(
t
)
=
S
(
t
)
−
S
0
S
0
×
100
Get Radiology Tree app to read full this article<
Get Radiology Tree app to read full this article<
PSE(t)=A(1−e−αt)e−βt PSE
(
t
)
=
A
(
1
−
e
−
α
t
)
e
−
β
t
where A is the amplitude of PSE, α is the signal enhancement or uptake rate (sec −1 ), and β is the washout rate (sec −1 ).
Get Radiology Tree app to read full this article<
Get Radiology Tree app to read full this article<
Statistical Analysis
Get Radiology Tree app to read full this article<
Results
Get Radiology Tree app to read full this article<
Get Radiology Tree app to read full this article<
Performance of T2 and ADC Values
Get Radiology Tree app to read full this article<
Get Radiology Tree app to read full this article<
DCE-MRI Characteristics of Normal Prostate and PCa
Get Radiology Tree app to read full this article<
Table 2
Summary of Quantitative mpMRI Parameters
mpMRI Quantitative Metric Cancer Normal Tissue Peripheral Zone Transition Zone Central Zone Anterior Fibromuscular Stroma ADC
(µm 2 /ms) 1.15 ± 0.411.55 ± 0.35 1.15 ± 0.32 0.96 ± 0.25 0.87 ± 0.37 T2
(ms) 108.7 ± 30.0192.8 ± 69.2 118.5 ± 32.0 102.8 ± 20.872.1 ± 20.1 MIP
(%/s) 160.6 ± 41.7 133.4 ± 46.3 159.0 ± 41.0 134.8 ± 46.3 129.9 ± 56.0 α
(%/s) 6.45 ± 4.713.18 ± 2.00 4.28 ± 2.342.60 ± 1.672.17 ± 1.85 β
(%/s) 0.067 ± 0.042 0.043 ± 0.044 0.066 ± 0.0350.019 ± 0.0610.010 ± 0.039 slope
(%/s) 3.78 ± 1.901.94 ± 1.69 2.98 ± 1.491.62 ± 0.701.23 ± 1.23 Start point
(s) 35.9 ± 7.6 30.9 ± 7.7 34.4 ± 7.3 33.6 ± 9.3 34.1 ± 8.3 TOA
(s) 37.6 ± 7.5 33.7 ± 8.1 36.3 ± 7.7 36.0 ± 10.2 39.6 ± 13.5n 46 18 16 18 19
Magnetic resonance imaging (MRI) parameters that were found to be significantly different ( P < .01) from cancer using analysis of variance (ANOVA) with post hoc Tukey honest significance test (HSD) test are displayed in bold.
Get Radiology Tree app to read full this article<
Correlation of Quantitative mpMRI Parameters with Gleason Score
Get Radiology Tree app to read full this article<
Diagnosis of PCa Using mpMRI with Ultrafast DCE-MRI
Get Radiology Tree app to read full this article<
Table 3
Results of ROC Analysis Between Prostate Cancer and Normal Tissue From Different Prostate Zones
α β Slope ADC T2 ADC + T2 ADC + T2 + DCE α Entire prostate † 0.770 \* 0.719 \* 0.800 \* 0.550 0.522 0.601 0.765 \* PZ 0.739 \* 0.667 \* 0.819 \* 0.803 \* 0.891 \* 0.902 \* 0.922 \* TZ 0.689 \* 0.605 0.715 \* 0.693 \* 0.745 \* 0.767 \* 0.797 \* CZ 0.824 \* 0.792 \* 0.878 \* 0.446 ‡ 0.454 ‡ — — AFMS 0.871 \* 0.864 \* 0.885 \* 0.351 ‡ 0.116 \* , ‡ — —
ADC, apparent diffusion coefficient; AFMS, anterior fibromuscular stroma; CZ, central zone; DCE, dynamic contrast-enhanced; PZ, peripheral zone; ROC, receiver operating characteristic; TZ, transition zone.
Area under the curve (95% confidence interval).
Get Radiology Tree app to read full this article<
Get Radiology Tree app to read full this article<
Get Radiology Tree app to read full this article<
Get Radiology Tree app to read full this article<
Get Radiology Tree app to read full this article<
Discussion
Get Radiology Tree app to read full this article<
Get Radiology Tree app to read full this article<
Get Radiology Tree app to read full this article<
Get Radiology Tree app to read full this article<
Get Radiology Tree app to read full this article<
Get Radiology Tree app to read full this article<
Get Radiology Tree app to read full this article<
Get Radiology Tree app to read full this article<
Get Radiology Tree app to read full this article<
Get Radiology Tree app to read full this article<
Conclusion
Get Radiology Tree app to read full this article<
Acknowledgment
Get Radiology Tree app to read full this article<
Get Radiology Tree app to read full this article<
Get Radiology Tree app to read full this article<
References
1. Siegel R.L., Miller K.D., Jemal A.: Cancer statistics, 2016. CA Cancer J Clin 2016; 66: pp. 7-30.
2. Verma S., Turkbey B., Muradyan N., et. al.: Overview of dynamic contrast-enhanced MRI in prostate cancer diagnosis and management. AJR Am J Roentgenol 2012; 198: pp. 1277-1288.
3. Engelbrecht M.R., Huisman H.J., Laheij R.J.F., et. al.: Discrimination of prostate cancer from normal peripheral zone and central gland tissue by using dynamic contrast-enhanced MR imaging. Radiology 2003; 229: pp. 248-254.
4. Franiel T., Hamm B., Hricak H.: Dynamic contrast-enhanced magnetic resonance imaging and pharmacokinetic models in prostate cancer. Eur Radiol 2011; 21: pp. 616-626.
5. Johnson L.M., Choyke P.L., Figg W.D., et. al.: The role of MRI in prostate cancer active surveillance. Biomed Res Int 2014; 2014: pp. 6.
6. Firjani A., Khalifa F., Elnakib A., et. al.: A novel image-based approach for early detection of prostate cancer using DCE-MRI.Suzuki K.Computational intelligence in biomedical imaging.2014.Springer New YorkNew York, NY:pp. 55-82.
7. Leach M.O., Morgan B., Tofts P.S., et. al.: Imaging vascular function for early stage clinical trials using dynamic contrast-enhanced magnetic resonance imaging. Eur Radiol 2012; 22: pp. 1451-1464.
8. Fennessy F.M., McKay R.R., Beard C.J., et. al.: Dynamic contrast-enhanced magnetic resonance imaging in prostate cancer clinical trials: potential roles and possible pitfalls. Transl Oncol 2014; 7: pp. 120-129.
9. Low R.N., Fuller D.B., Muradyan N.: Dynamic gadolinium-enhanced perfusion MRI of prostate cancer: assessment of response to hypofractionated robotic stereotactic body radiation therapy. AJR Am J Roentgenol 2011; 197: pp. 907-915.
10. O’Connor J.P.B., Jackson A., Parker G.J.M., et. al.: Dynamic contrast-enhanced MRI in clinical trials of antivascular therapies. Nat Rev Clin Oncol 2012; 9: pp. 167-177.
11. Isebaert S., Van den Bergh L., Haustermans K., et. al.: Multiparametric MRI for prostate cancer localization in correlation to whole-mount histopathology. J Magn Reson Imaging 2013; 37: pp. 1392-1401.
12. Langer D.L., van der Kwast T.H., Evans A.J., et. al.: Prostate cancer detection with multi-parametric MRI: logistic regression analysis of quantitative T2, diffusion-weighted imaging, and dynamic contrast-enhanced MRI. J Magn Reson Imaging 2009; 30: pp. 327-334.
13. Oto A., Kayhan A., Jiang Y., et. al.: Prostate cancer: differentiation of central gland cancer from benign prostatic hyperplasia by using diffusion-weighted and dynamic contrast-enhanced MR imaging. Radiology 2010; 257: pp. 715-723.
14. Weinreb J.C., Barentsz J.O., Choyke P.L., et. al.: PI-RADS prostate imaging—reporting and data system: 2015, version 2. Eur Urol 2016; 69: pp. 16-40.
15. Othman A.E., Falkner F., Weiss J., et. al.: Effect of temporal resolution on diagnostic performance of dynamic contrast-enhanced magnetic resonance imaging of the prostate. Invest Radiol 2016; 51: pp. 290-296.
16. Barentsz J.O., Richenberg J., Clements R., et. al.: ESUR prostate MR guidelines 2012. Eur Radiol 2012; 22: pp. 746-757.
17. Isebaert S., De Keyzer F., Haustermans K., et. al.: Evaluation of semi-quantitative dynamic contrast-enhanced MRI parameters for prostate cancer in correlation to whole-mount histopathology. Eur J Radiol 2012; 81: pp. e217-e222.
18. Chen Y.-J., Chu W.-C., Pu Y.-S., et. al.: Washout gradient in dynamic contrast-enhanced MRI is associated with tumor aggressiveness of prostate cancer. J Magn Reson Imaging 2012; 36: pp. 912-919.
19. Rosenkrantz A.B., Geppert C., Grimm R., et. al.: Dynamic contrast-enhanced MRI of the prostate with high spatiotemporal resolution using compressed sensing, parallel imaging, and continuous golden-angle radial sampling: preliminary experience. J Magn Reson Imaging 2015; 41: pp. 1365-1373.
20. Franiel T., Ludemann L., Rudolph B., et. al.: Evaluation of normal prostate tissue, chronic prostatitis, and prostate cancer by quantitative perfusion analysis using a dynamic contrast-enhanced inversion-prepared dual-contrast gradient echo sequence. Invest Radiol 2008; 43: pp. 481-487.
21. Vos E.K., Litjens G.J.S., Kobus T., et. al.: Assessment of prostate cancer aggressiveness using dynamic contrast-enhanced magnetic resonance imaging at 3 T. Eur Urol 2013; 64: pp. 448-455.
22. Tofts P.S., Brix G., Buckley D.L., et. al.: Estimating kinetic parameters from dynamic contrast-enhanced T1-weighted MRI of a diffusable tracer: standardized quantities and symbols. J Magn Reson Imaging 1999; 10: pp. 223-232.
23. Fan X., Medved M., River J.N., et. al.: New model for analysis of dynamic contrast-enhanced MRI data distinguishes metastatic from nonmetastatic transplanted rodent prostate tumors. Magn Reson Med 2004; 51: pp. 487-494.
24. Buckley D.L.: Uncertainty in the analysis of tracer kinetics using dynamic contrast-enhanced T1-weighted MRI. Magn Reson Med 2002; 47: pp. 601-606.
25. Mustafi D., Gleber S.-C., Ward J., et. al.: IV administered gadodiamide enters the lumen of the prostatic glands: x-ray fluorescence microscopy examination of a mouse model. AJR Am J Roentgenol 2015; 205: pp. W313-W319.
26. Jansen S.A., Fan X., Medved M., et. al.: Characterizing early contrast uptake of ductal carcinoma in situ with high temporal resolution dynamic contrast-enhanced MRI of the breast: a pilot study. Phys Med Biol 2010; 55: pp. 31-9155.
27. Fan X., Medved M., Karczmar G.S., et. al.: Diagnosis of suspicious breast lesions using an empirical mathematical model for dynamic contrast-enhanced MRI. Magn Reson Imaging 2007; 25: pp. 593-603.
28. Fedorov A., Beichel R., Kalpathy-Cramer J., et. al.: 3D slicer as an image computing platform for the quantitative imaging network. Magn Reson Imaging 2012; 30: pp. 1323-1341.
29. Akin O., Sala E., Moskowitz C.S., et. al.: Transition zone prostate cancers: features, detection, localization, and staging at endorectal MR imaging. Radiology 2006; 239: pp. 784-792.
30. Kayhan A., Fan X., Oommen J., et. al.: Multi-parametric MR imaging of transition zone prostate cancer: imaging features, detection and staging. World J Radiol 2010; 2: pp. 180-187.
31. Turkbey B., McKinney Y.L., Trivedi H., et. al.: Multiparametric 3T prostate magnetic resonance imaging to detect cancer: histopathological correlation using prostatectomy specimens processed in customized magnetic resonance imaging based molds. J Urol 2011; 186: pp. 1818-1824.
32. Vargas H.A., Akin O., Franiel T., et. al.: Normal central zone of the prostate and central zone involvement by prostate cancer: clinical and MR imaging implications. Radiology 2012; 262: pp. 894-902.
33. Kitzing Y.X., Prando A., Varol C., et. al.: Benign conditions that mimic prostate carcinoma: MR imaging features with histopathologic correlation. Radiographics 2016; 36: pp. 162-175.
34. Li H., Sugimura K., Kaji Y., et. al.: Conventional MRI capabilities in the diagnosis of prostate cancer in the transition zone. AJR Am J Roentgenol 2006; 186: pp. 729-742.
35. Hoeks C.M.A., Vos E.K., Bomers J.G.R., et. al.: Diffusion-weighted magnetic resonance imaging in the prostate transition zone: histopathological validation using magnetic resonance-guided biopsy specimens. Invest Radiol 2013; 48: pp. 693-701.
36. Pineda F.D., Medved M., Wang S., et. al.: Ultrafast bilateral DCE-MRI of the breast with conventional fourier sampling: preliminary evaluation of semi-quantitative analysis. Acad Radiol 2016; 23: pp. 1137-1144.
37. Schlemmer H.-P., Merkle J., Grobholz R., et. al.: Can pre-operative contrast-enhanced dynamic MR imaging for prostate cancer predict microvessel density in prostatectomy specimens?. Eur Radiol 2004; 14: pp. 309-317.
38. Wein A., Kavoussi L., Partin A., et. al.: Campbell-Walsh urology.11th ed.2015.Elsevier
39. Somford D.M., Hoeks C.M., Hulsbergen-van de Kaa C.A., et. al.: Evaluation of diffusion-weighted MR imaging at inclusion in an active surveillance protocol for low-risk prostate cancer. Invest Radiol 2013; 48: pp. 152-157.
40. Pineda F., Easley T.O., Karczmar G.: Early enhancement in breast DCE-MRI is sparse and can be imaged with a reduced FOV to increase temporal resolution. Proc Intl Soc Mag Reson Med 25. Honolulu, USA; 14722017.
41. Vos P.C., Hambrock T., Hulsbergen-van de Kaa C.A., et. al.: Computerized analysis of prostate lesions in the peripheral zone using dynamic contrast enhanced MRI. Med Phys 2008; 35: pp. 888-899.
42. Firjani A., Khalifa F., Elnakib A., et. al.: A novel image-based approach for early detection of prostate cancer. 2012 19th IEEE International Conference on Image Processing; 2849-522012.
43. Ramalho J., Semelka R.C., Ramalho M., et. al.: Gadolinium-based contrast agent accumulation and toxicity: an update. AJNR Am J Neuroradiol 2016; 37: pp. 1192-1198.
44. Khawaja A.Z., Cassidy D.B., Al Shakarchi J., et. al.: Revisiting the risks of MRI with Gadolinium based contrast agents—review of literature and guidelines. Insights Imaging 2015; 6: pp. 553-558.
45. Murphy K.J., Brunberg J.A., Cohan R.H.: Adverse reactions to gadolinium contrast media: a review of 36 cases. AJR Am J Roentgenol 1996; 167: pp. 847-849.
46. Deray G., Rouviere O., Bacigalupo L., et. al.: Safety of meglumine gadoterate (Gd-DOTA)-enhanced MRI compared to unenhanced MRI in patients with chronic kidney disease (RESCUE study). Eur Radiol 2013; 23: pp. 1250-1259.
47. Bourrinet P., Martel E., El Amrani A.I., et. al.: Cardiovascular safety of gadoterate meglumine (Gd-DOTA). Invest Radiol 2007; 42: pp. 63-77.
48. Herborn C.U., Honold E., Wolf M., et. al.: Clinical safety and diagnostic value of the gadolinium chelate gadoterate meglumine (Gd-DOTA). Invest Radiol 2007; 42: pp. 58-62.