
Rationale and Objectives
Our goals were to apply perfusion CT technique to breast tumor and to evaluate the correlation between arterial perfusion value and other tumor characteristics.
Materials and Methods
Thirty-one female patients with primary breast tumors were included in this study. A single-slice dynamic CT was performed after an intravenous bolus injection of contrast material (40 ml; 370 mg I/ml) at 8 ml/sec. The parameters were calculated on a pixel-by-pixel basis by using maximum slope method, and quantitative maps of arterial perfusion were created. Statistical correlation between tumor size, patient age, and perfusion were assessed. Differences in perfusion between scirrhous and nonscirrhous carcinoma were also assessed.
Results
Perfusion CT images were successfully created for 24 patients (mean age, 55.9 years old; range, 36−85 years). In five patients, dynamic CT was not performed due to lack of visualization of the breast tumor on unenhanced CT. In two patients, reliable perfusion CT image could not be created because of motion artifact. The mean perfusion for 24 tumors was 33.1 ± 16.9 ml/min/100 ml (mean ± SD; range, 14−78), and the tumor perfusion did not correlate with patient’s age or tumor size (21.0 ± 10.2 mm; range, 10−45 mm). The mean perfusion of nonscirrhous carcinoma (45.8 ml/min/100 ml; n = 11) was higher than that of scirrhous carcinoma (22.7 ml/min/100 ml; n = 11; P < .001).
Conclusion
Determination of the perfusion of breast carcinoma is feasible by dynamic CT and can be performed during a routine CT study without much supplementary burden on the patient. There are differences in blood flow between scirrhous and nonscirrhous breast carcinoma, and further research is needed to determine the impact of this finding.
The aim of functional CT is functional analysis of CT image in addition to anatomical analysis. After an intravenous bolus injection of iodinated contrast material, tissue and vessel attenuation changes can be observed during first pass by rapid image acquisition at a given anatomical level. Time-density curves can then be constructed not only for observer-defined regions of interest (ROIs) but also on a pixel-by-pixel basis. Within the limits of some assumptions ( ), tissue perfusion can be estimated based on the observed density changes; the time course of the iodine concentration change is a measure of the regional perfusion, and this concentration has a linear correlation to CT number increase. Although there have been many reports using perfusion CT in various organs ( ), to the best of our knowledge, there has been no study of perfusion CT of breast tumors.
The aims of this study were to apply perfusion CT techniques to breast tumors and to evaluate the correlation between arterial perfusion value and other tumor characteristics such as histopathological diagnosis.
Materials and methods
Subjects
Get Radiology Tree app to read full this article<
CT Imaging
Get Radiology Tree app to read full this article<
Get Radiology Tree app to read full this article<
Get Radiology Tree app to read full this article<
Perfusion Measurement
Get Radiology Tree app to read full this article<
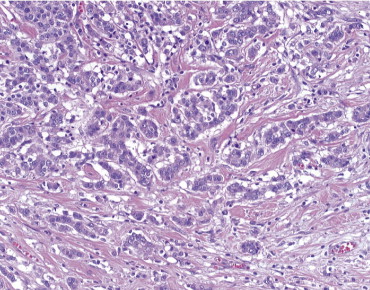
Pathological Diagnosis
Get Radiology Tree app to read full this article<
Get Radiology Tree app to read full this article<
Statistical Analysis
Get Radiology Tree app to read full this article<
Results
Get Radiology Tree app to read full this article<
Get Radiology Tree app to read full this article<
Table 1
Linear Regression Analyses Between Tumor Perfusion, and Maximum Tumor Size and Patient Age
Variables Mean ± SD Range_R_ 2 P value Maximum size (mm) 21.0 ± 10.2 10–45 0.02 .55 Age (y) 55.9 ± 11.8 36–85 0.02 .50
Tumor perfusion was not correlated with maximum tumor size or patient age. SD = standard deviation.
Get Radiology Tree app to read full this article<
Get Radiology Tree app to read full this article<
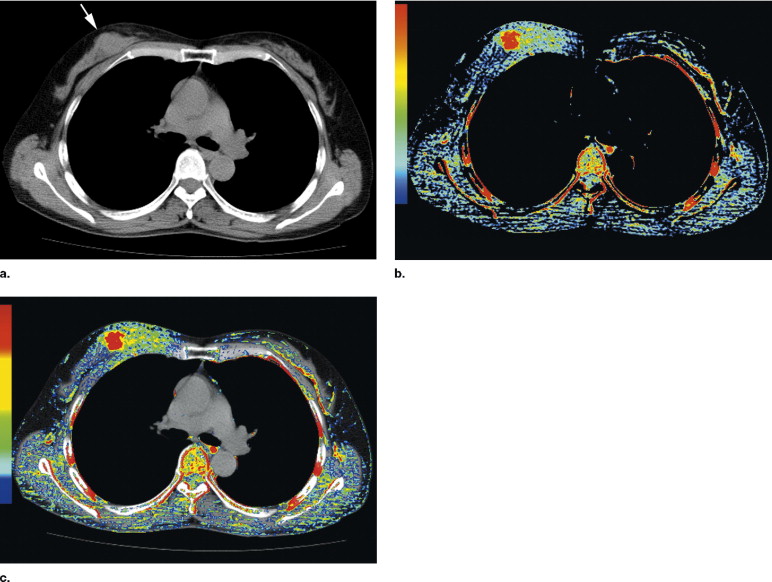
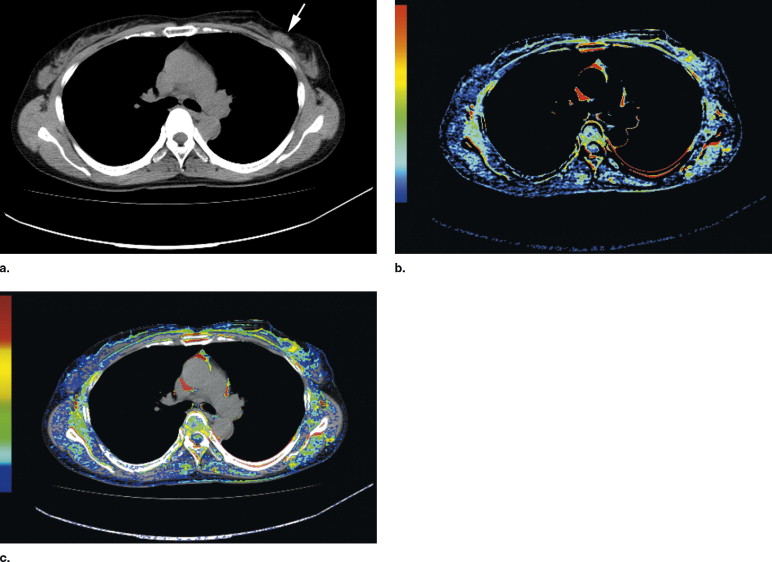
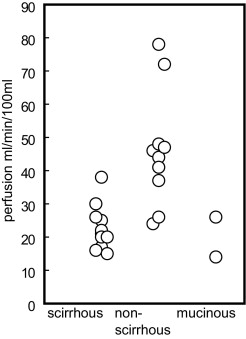
Table 2
Tumor perfusion values of scirrhous and nonscirrhous carcinoma of breast or positive and negative lymph node metastasis
Variable Tumor Perfusion (mean ± SD)P -value Scirrhous Nonscirrhous Pathology 22.7 ± 6.8 ⁎ 45.8 ± 16.5 ⁎ .0004 Positive Negative Lymph node metastas 26.4 ± 10.2 ⁎ 38.8 ± 18.8 ⁎ .10
Tumor perfusion of scirrhous carcinoma was lower than that of nonscirrhous carcinoma of breast. There was no difference in tumor perfusion between patients with and without lymph node metastasis. SD = standard deviation.
Get Radiology Tree app to read full this article<
Get Radiology Tree app to read full this article<
Discussion
Get Radiology Tree app to read full this article<
Get Radiology Tree app to read full this article<
Get Radiology Tree app to read full this article<
Get Radiology Tree app to read full this article<
Get Radiology Tree app to read full this article<
Conclusion
Get Radiology Tree app to read full this article<
Acknowledgement
Get Radiology Tree app to read full this article<
References
1. Miles K.A.: Ideal contrast medium bolus for perfusion measurement in dynamic lung CT. Radiology 1998; 209: pp. 583.
2. Tsushima Y., Endo K.: Portal perfusion measurement on dynamic CT in patients with liver cirrhosis. AJR Am J Roentgenol 2005; 185: pp. 813.
3. Tsushima Y., Aoki J., Endo K.: Underestimation of renal cortical perfusion calculated from dynamic CT data. Radiology 2002; 224: pp. 613-614.
4. Hermans R., Lambin P., Van der Goten A., et. al.: Tumoural perfusion as measured by dynamic computed tomography in head and neck carcinoma. Radiother Oncol 1999; 53: pp. 105-111.
5. Tsushima Y., Kusano S.: Age-dependent decline in parenchymal perfusion in the normal human pancreas: Measurement by dynamic computed tomography. Pancreas 1998; 17: pp. 148-152.
6. Tsushima Y.: Functional CT of the kidney. Eur J Radiol 1999; 30: pp. 191-197.
7. Tsushima Y., Unno Y., Koizumi J., Kusano S.: Measurement of human hepatic and splenic perfusion using dynamic computed tomography: A preliminary report. Comput Methods Programs Biomed 1998; 57: pp. 143-146.
8. Tsushima Y., Blomley J.K., Kusano S., Endo K.: The portal component of hepatic perfusion measured by dynamic CT: An indicator of hepatic parenchymal damage. Dig Dis Sci 1999; 44: pp. 1632-1638.
9. Quan-Sing N.G., Goh V., Fichte H., et. al.: Lung cancer perfusion at multi-detector row CT: Reproducibility of whole tumor quantitative measurements. Radiology 2006; 239: pp. 547-553.
10. Goh V., Halligan S., Hugill J.A., Bassett P., Bartram C.I.: Quantitative assessment of colorectal cancer perfusion using MDCT: Inter- and intraobserver agreement. AJR Am J Roentgenol 2005; 185: pp. 225-231.
11. DeVries A.F., Kremser C., Hein P.A., et. al.: Tumor microcirculation and diffusion predict therapy outcome for primary rectal carcinoma. Int J Radiat Oncol Biol Phys 2003; 56: pp. 958-965.
12. Miles K.A.: Measurement of tissue perfusion by dynamic computed tomography. Br J Radiol 1991; 64: pp. 409-412.
13. Tsushima Y., Funabasama S., Sanada S., Aoki J., Endo K.: Development of perfusion CT software for personal computers. Acad Radiol 2002; 9: pp. 922-926.
14. Tsushima Y., Funabasama S., Aoki J., Sanada S., Endo K.: Quantitative perfusion map of malignant liver tumors, created from dynamic computed tomography data. Acad Radiol 2004; 11: pp. 215-223.
15. The Japanese Breast Cancer Society: 15th ed.2004.Kanehara ShuppanTokyo
16. Maki K., Sakamoto G., Kasumi F.: The characteristics of 3 subgroups (papillotubular, solid-tubular, and scirrhous) of invasive ductal carcinoma of the breast. Jpn J Breast Cancer 2006; 21: pp. 165-169.
17. Ito S., Aki F.: Lymph node metastasis and prognosis of breast cancer: Tumors 2cm in diameter or less. J Jpn Assoc Breast Cancer Screen 2001; 10: pp. 234-239.
18. Weidner N., Semple J.P., Welch W.R., Folkman J.: Tumor angiogenesis and metastasis: Correlation in invasive breast carcinoma. N Engl J Med 1991; 324: pp. 1-8.
19. Mankoff D.A., Dunnwald L.K., Gralow J.R., et. al.: Blood flow and metabolism in locally advanced breast cancer: Relationship to response to therapy. J Nucl Med 2002; 43: pp. 500-509.
20. Teifke A., Behr O., Schmidt M., et. al.: Dynamic MR imaging of breast lesions: Correlation with microvessel distribution pattern and histologic characteristics of prognosis. Radiology 2006; 239: pp. 351-360.
21. Phongkitkarun S., Kobayashi S., Kan Z., Lee T.Y., Charnsangavej C.: Quantification of angiogenesis by functional computed tomography in a Matrigel model in rats. Acad Radiol 2004; 11: pp. 573-582.