
Rationale and Objectives
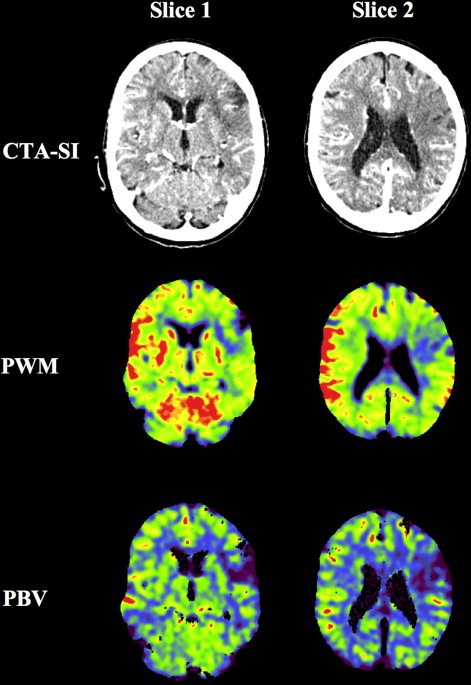
Computed tomography angiography source imaging (CTA-SI) in acute ischemic stroke improves detection rate and estimation of extent of cerebral infarction. This study compared the new components color-coded perfusion weighted map (PWM) and color-coded perfused blood volume (PBV) derived from CTA data with CTA-SI for the visualization of cerebral infarction.
Materials and Methods
Fifty patients (women = 30; mean age = 74.9 ± 13.3 years) underwent nonenhanced computed tomography and CTA for suspected acute ischemic stroke. PWM, PBV, and CTA-SI were reconstructed with identical slice thickness of 1.0 mm with commercial software. Extent of infarction was measured using the Alberta Stroke Program Early Computed Tomography Score (ASPECTS). For statistical analysis, Spearman’s R correlation and paired-samples t -test was used. P < .05 was considered significant.
Results
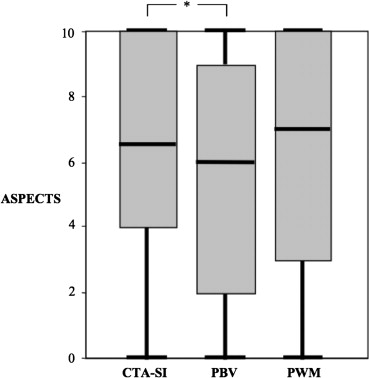
PBV had superior sensitivity for detection of cerebral infarction with 0.88 compared to PWM and CTA-SI with 0.79 and 0.76, respectively. The accuracy of correct diagnosis was superior for PBV with 0.82 compared to PWM and CTA-SI with 0.76, respectively. ASPECTS of PWM and PBV showed strong correlation with CTA-SI with r = 0.903 ( P < .001) and r = 0.866 ( P < .001), respectively. Mean ASPECTS of CTA-SI (6.24 ± 3.62) revealed no significant difference with PWM (6.26 ± 3.45), but a significant difference with PBV (5.62 ± 3.41; P < .02).
Conclusions
PWM was equal to CTA-SI in detection of cerebral infarction and estimation of extent of cerebral ischemia. Although PBV was superior to CTA-SI in detection of cerebral infarction, PBV seems to overestimate the extent of critical cerebral ischemia. Therefore, CTA-SI information is not identical to PBV and further clinical evaluation is mandatory.
Stroke is one of the major diseases resulting in death or permanent disability worldwide. In Western countries, the age adjusted incidence rate is about 180 per 100,000 per year . Most strokes are caused by acute ischemia because of occlusion of a cerebral artery. Major efforts were made in the past to improve patient selection in thrombolysis therapy and to predict patient outcome . Sophisticated imaging strategies are considered the key technique to meet these demands. Both, computed tomography (CT) and magnetic resonance imaging (MRI), have been proven to be feasible for acute stroke imaging . CT is the most frequently used method due to its wide availability and nonenhanced CT (NECT) of the brain is the basis of any thrombolysis therapy. In addition to NECT, contrast-enhanced CT angiography (CTA) is frequently used in acute stroke imaging to visualize the cerebral vasculature . However, CTA data also include hemodynamic information . The so named CTA source imaging (CTA-SI) has proven better visualization of the infarcted brain tissue as well as improved prediction of patient outcome in acute ischemic stroke in several studies .
Commercial software now allows the fast and standardized postprocessing of CTA data with calculation of color-coded perfusion weighted map (PWM) images and color-coded perfused blood volume (PBV) images to extract hemodynamic information of the whole brain. PWM is the color-coded visualization of the CTA-SI, whereas PBV is based on the subtraction of NECT and CTA data sets and visualizes the cerebral blood volume with a defined color-coded map. Both methods are considered to visualize mainly the irreversible infarcted brain tissue.
Get Radiology Tree app to read full this article<
Materials and methods
Study Population
Get Radiology Tree app to read full this article<
Get Radiology Tree app to read full this article<
Imaging Protocol
Get Radiology Tree app to read full this article<
Get Radiology Tree app to read full this article<
Postprocessing
Get Radiology Tree app to read full this article<
Get Radiology Tree app to read full this article<
Get Radiology Tree app to read full this article<
Get Radiology Tree app to read full this article<
Get Radiology Tree app to read full this article<
Get Radiology Tree app to read full this article<
Image Analysis
Get Radiology Tree app to read full this article<
Statistics
Get Radiology Tree app to read full this article<
Table 1
Calculation of Sensitivity, Specificity, and Accuracy
Sensitivity=TruepositivesTruepositives+false negatives Sensitivity
=
True
positives
True
positives
+
false negatives Specificity=True negativesTrue negatives+falsepositives Specificity
=
True negatives
True negatives
+
false
positives Accuracy=True positives+true negativesTrue positives+false positives+true negatives+false negatives Accuracy
=
True positives
+
true negatives
True positives
+
false positives
+
true negatives
+
false negatives
Get Radiology Tree app to read full this article<
Get Radiology Tree app to read full this article<
Results
Study Population
Get Radiology Tree app to read full this article<
Table 2
Descriptive Data of Study Population
Mean age (n = 50) 74.9 ± 13.3 years (30.8-93.6) Mean age women (n = 30) 78.4 ± 10.7 years (49.2-93.6) Mean age men (n = 20) 69.7 ± 15.3 years (30.8-92.4) Onset-to-imaging time interval 3.08 ± 2.44 hours (0.3-12.0) NIHSS on admission 11.5 ± 5.1 (0-22) Delay of follow-up imaging 1.41 ± 1.51 days (1-10)
n, number; NIHSS, National Institute of Health Stroke Scale. All values displayed as mean ± standard deviation (range).
Get Radiology Tree app to read full this article<
Get Radiology Tree app to read full this article<
Sensitivity and Specificity Statistics
Get Radiology Tree app to read full this article<
Table 3
Sensitivity, Specificity, and Accuracy
CTA-SI PWM PBV True positives 32 33 37 False positives 2 3 4 True negatives 6 5 4 False negatives 10 9 5 Sensitivity 0.76 0.79 0.88 Specificity 0.75 0.63 0.50 Accuracy 0.76 0.76 0.82
CTA-SI, computed tomography angiography source imaging; PWM, perfusion weighted map; PBV, perfused blood volume.
Get Radiology Tree app to read full this article<
Correlation Statistics for Extent of Cerebral Ischemia
Get Radiology Tree app to read full this article<
Get Radiology Tree app to read full this article<
Discussion
Sensitivity and Specificity
Get Radiology Tree app to read full this article<
Get Radiology Tree app to read full this article<
Get Radiology Tree app to read full this article<
Get Radiology Tree app to read full this article<
Extent of Cerebral Ischemia
Get Radiology Tree app to read full this article<
Get Radiology Tree app to read full this article<
Limitations of this Study
Get Radiology Tree app to read full this article<
Get Radiology Tree app to read full this article<
Get Radiology Tree app to read full this article<
Get Radiology Tree app to read full this article<
References
1. Rosamond W., Flegal K., Furie K., et. al.: Heart disease and stroke statistics—2008 update: a report from the American Heart Association Statistics Committee and Stroke Statistics Subcommittee. Circulation 2008; 117: pp. e25-e146.
2. Truelsen T., Piechowski-Jozwiak B., Bonita R., et. al.: Stroke incidence and prevalence in Europe: a review of available data. Eur J Neurol 2006; 13: pp. 581-598.
3. Adams H.P., del Zoppo G., Alberts M.J., et. al.: Guidelines for the early management of adults with ischemic stroke: a guideline from the American Heart Association/American Stroke Association Stroke Council, Clinical Cardiology Council, Cardiovascular Radiology and Intervention Council, and the Atherosclerotic Peripheral Vascular Disease and Quality of Care Outcomes in Research Interdisciplinary Working Groups: The American Academy of Neurology affirms the value of this guideline as an educational tool for neurologists. Circulation 2007; 115: pp. e478-e534.
4. Moustafa R.R., Baron J.C.: Clinical review: imaging in ischaemic stroke—implications for acute management. Crit Care 2007; 11: pp. 227.
5. Lovblad K.O., Baird A.E.: Actual diagnostic approach to the acute stroke patient. Eur Radiol 2006; 16: pp. 1253-1269.
6. Thurnher M.M., Castillo M.: Imaging in acute stroke. Eur Radiol 2005; 15: pp. 408-415.
7. Verro P., Tanenbaum L.N., Borden N., et. al.: Clinical application of CT angiography in acute ischemic stroke. Clin Neurol Neurosurg 2007; 109: pp. 138-145.
8. Ezzeddine M.A., Lev M.H., McDonald C.T., et. al.: CT angiography with whole brain perfused blood volume imaging: added clinical value in the assessment of acute stroke. Stroke 2002; 33: pp. 959-966.
9. Schramm P., Schellinger P.D., Fiebach J.B., et. al.: Comparison of CT and CT angiography source images with diffusion-weighted imaging in patients with acute stroke within 6 hours after onset. Stroke 2002; 33: pp. 2426-2432.
10. Grond M., Rudolf J., Schneweis S., et. al.: Feasibility of source images of computed tomographic angiography to detect the extent of ischemia in hyperacute stroke. Cerebrovasc Dis 2002; 13: pp. 251-256.
11. Puetz V., Dzialowski I., Hill M.D., et. al.: Malignant profile detected by CT angiographic information predicts poor prognosis despite thrombolysis within three hours from symptom onset. Cerebrovasc Dis 2010; 29: pp. 584-591.
12. Coutts S.B., O’Reilly C., Hill M.D., et. al.: Computed tomography and computed tomography angiography findings predict functional impairment in patients with minor stroke and transient ischaemic attack. Int J Stroke 2009; 4: pp. 448-453.
13. Schaefer P.W., Yoo A.J., Bell D., et. al.: CT angiography-source image hypoattenuation predicts clinical outcome in posterior circulation strokes treated with intra-arterial therapy. Stroke 2008; 39: pp. 3107-3109.
14. Lev M.H., Segal A.Z., Farkas J., et. al.: Utility of perfusion-weighted CT imaging in acute middle cerebral artery stroke treated with intra-arterial thrombolysis: prediction of final infarct volume and clinical outcome. Stroke 2001; 32: pp. 2021-2028.
15. Wittkamp G., Buerke B., Dziewas R., et. al.: Whole brain perfused blood volume CT: visualization of infarcted tissue compared to quantitative perfusion CT. Acad Radiol 2010; 17: pp. 427-432.
16. Lu J., Zhang M., Chen J., et. al.: Three-dimensional perfused blood volume in hyperacute stroke using 64-section MSCT. Clin Radiol 2008; 63: pp. 1051-1056.
17. Kloska S.P., Fischer T., Nabavi D.G., et. al.: Color-coded perfused blood volume imaging using multidetector CT: initial results of whole-brain perfusion analysis in acute cerebral ischemia. Eur Radiol 2007; 17: pp. 2352-2358.
18. Barber P.A., Demchuk A.M., Zhang J., et. al.: Validity and reliability of a quantitative computed tomography score in predicting outcome of hyperacute stroke before thrombolytic therapy. ASPECTS Study Group. Alberta Stroke Programme Early CT Score. Lancet 2000; 355: pp. 1670-1674.
19. Ringleb P., Schellinger P.D., Hacke W.: European Stroke Organisation 2008 guidelines for managing acute cerebral infarction or transient ischemic attack. Part 1. Nervenarzt 2008; 79: pp. 936-957.
20. Hill M.D., Coutts S.B., Pexman J.H., et. al.: CTA source images in acute stroke. Stroke 2003; 34: pp. 835-837.
21. Hamberg L.M., Hunter G.J., Kierstead D., et. al.: Measurement of cerebral blood volume with subtraction three-dimensional functional CT. AJNR Am J Neuroradiol 1996; 17: pp. 1861-1869.
22. Lin K., Rapalino O., Law M., et. al.: Accuracy of the Alberta Stroke Program Early CT Score during the first 3 hours of middle cerebral artery stroke: comparison of noncontrast CT, CT angiography source images, and CT perfusion. AJNR Am J Neuroradiol 2008; 29: pp. 931-936.
23. Coutts S.B., Lev M.H., Eliasziw M., et. al.: ASPECTS on CTA source images versus unenhanced CT: added value in predicting final infarct extent and clinical outcome. Stroke 2004; 35: pp. 2472-2476.
24. Hunter G.J., Silvennoinen H.M., Hamberg L.M., et. al.: Whole-brain CT perfusion measurement of perfused cerebral blood volume in acute ischemic stroke: probability curve for regional infarction. Radiology 2003; 227: pp. 725-730.
25. Schramm P., Schellinger P.D., Klotz E., et. al.: Comparison of perfusion computed tomography and computed tomography angiography source images with perfusion-weighted imaging and diffusion-weighted imaging in patients with acute stroke of less than 6 hours’ duration. Stroke 2004; 35: pp. 1652-1658.
26. Camargo E.C., Furie K.L., Singhal A.B., et. al.: Acute brain infarct: detection and delineation with CT angiographic source images versus nonenhanced CT scans. Radiology 2007; 244: pp. 541-548.
27. Schwamm L.H., Rosenthal E.S., Swap C.J., et. al.: Hypoattenuation on CT angiographic source images predicts risk of intracerebral hemorrhage and outcome after intra-arterial reperfusion therapy. AJNR Am J Neuroradiol 2005; 26: pp. 1798-1803.
28. Muir K.W., Halbert H.M., Baird T.A., et. al.: Visual evaluation of perfusion computed tomography in acute stroke accurately estimates infarct volume and tissue viability. J Neurol Neurosurg Psychiatry 2006; 77: pp. 334-339.
29. Fiehler J., Kucinski T., Zeumer H.: Stroke MRI: pathophysiology, potential and perspectives. Rofo 2004; 176: pp. 313-323.
30. Kirchhof K., Schramm P., Klotz E., et. al.: The value of multi-slice computed tomography for early diagnosis of focal cerebral ischemia. Rofo 2002; 174: pp. 1089-1095.