
Rationale and Objectives
The purpose of this study was to perform high-resolution contrast-enhanced peripheral multistation magnetic resonance angiography using a new blood-pool contrast agent (gadofosveset trisodium; Vasovist) while suppressing venous signal by using an acquisition scheme with k-space segmentation.
Materials and Methods
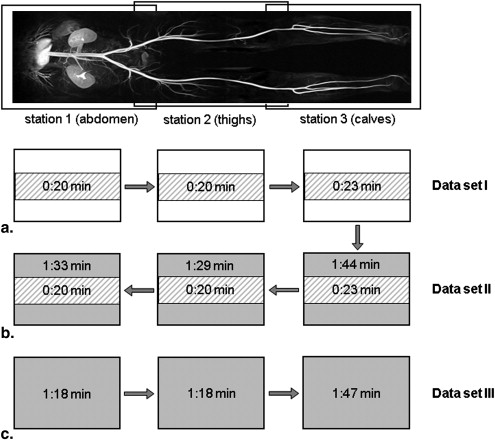
Multistation peripheral magnetic resonance angiography with Vasovist was performed in 20 patients with known peripheral arterial occlusive disease. The k-space of the three-dimensional data sets was segmented such that the central parts were acquired during the first pass of the blood-pool agent, while the peripheral parts were acquired in the steady state. A third magnetic resonance angiographic data set acquired using the conventional technique served as comparison for venous overlay. Two radiologists blindly compared vessel sharpness, conspicuity, and venous contamination. Furthermore, a semiautomatic program to compare edge sharpness was used. Results were compared by means of Wilcoxon’s signed rank sum test.
Results
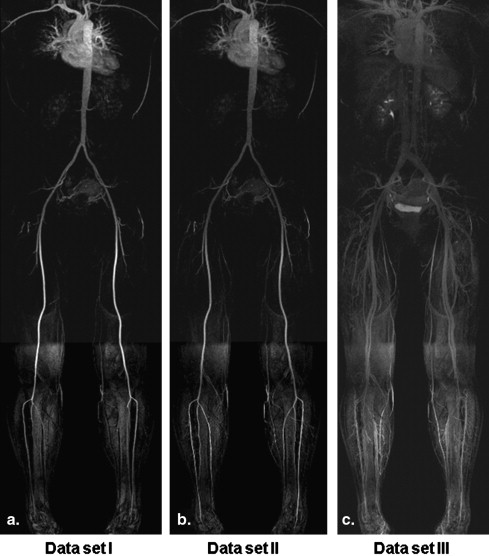
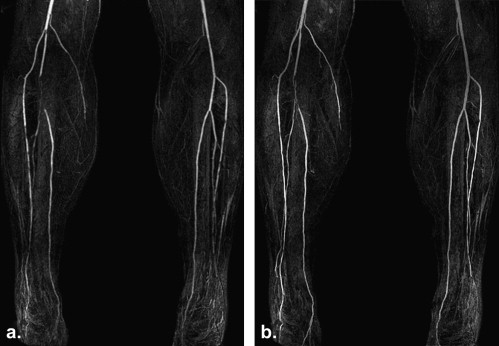
Comparison of vessel sharpness revealed statistically significant differences in favor of the fused data sets in all three stations. Arteries were depicted more sharply in the fused images and over longer parts, while veins were almost completely suppressed.
Conclusions
Peripheral contrast-enhanced magnetic resonance angiography with first-pass and steady-state k-space segmentation using a blood-pool contrast agent proved feasible and provided high-resolution data with sharp delineation of the arteries while reducing venous contamination.
Peripheral arterial occlusive disease (PAOD) is a significant cause of morbidity in the Western world and can lead to lower-extremity ischemia. Until recently, contrast-enhanced (CE) digital subtraction angiography had to be performed as reference standard. By now, three-dimensional (3D) CE magnetic resonance angiography (MRA) has been successfully applied to the peripheral vessels, leading to diagnostic images , and has been established as standard of reference for diagnostic evaluation of PAOD because of its noninvasiveness, its 3D nature encompassing multistation large fields of view, and its relatively good spatial resolution.
The timing and synchronization of the contrast agent with magnetic resonance data acquisition for peripheral CE MRA play a major role in acquiring high-signal arterial angiograms while simultaneously avoiding venous signal overlay.
Get Radiology Tree app to read full this article<
Get Radiology Tree app to read full this article<
Get Radiology Tree app to read full this article<
Get Radiology Tree app to read full this article<
Materials and methods
Get Radiology Tree app to read full this article<
Get Radiology Tree app to read full this article<
Technique
Get Radiology Tree app to read full this article<
Get Radiology Tree app to read full this article<
Get Radiology Tree app to read full this article<
Table 1
Imaging Parameters
Sequence Acquisition Time (seconds) Field of View, Head to Feet × Left to Right (mm 2 ) Acquired Voxel Size (mm 3 ) First pass Abdomen 20 500 × 344 0.8 × 2.0 × 2.0 Thighs 20 500 × 344 0.8 × 2.0 × 2.0 Calves 23 500 × 344 0.7 × 1.8 × 1.8 Fused data set Abdomen 93 500 × 344 0.8 × 0.8 × 0.8 Thighs 89 500 × 344 0.8 × 0.8 × 0.8 Calves 104 500 × 344 0.7 × 0.7 × 0.7 Steady state Abdomen 78 500 × 344 0.8 × 0.8 × 0.8 Thighs 78 500 × 344 0.8 × 0.8 × 0.8 Calves 107 500 × 344 0.7 × 0.7 × 0.7
Sequence parameters for all three stations and their first-pass and steady-state acquisitions. Sequence parameters that were identical for all acquisitions were flip angle (25°), bandwidth (490 Hz/pixel), repetition time (3.4 ms), echo time (1.3 ms), number of slices per slab (160), and generalized auto-calibrating partially parallel acquisition acceleration factor .
Get Radiology Tree app to read full this article<
Get Radiology Tree app to read full this article<
Get Radiology Tree app to read full this article<
Patients
Get Radiology Tree app to read full this article<
Get Radiology Tree app to read full this article<
Image Evaluation
Get Radiology Tree app to read full this article<
Get Radiology Tree app to read full this article<
Get Radiology Tree app to read full this article<
Get Radiology Tree app to read full this article<
Get Radiology Tree app to read full this article<
Statistical Analysis
Get Radiology Tree app to read full this article<
Results
Get Radiology Tree app to read full this article<
Get Radiology Tree app to read full this article<
Image Quality
Get Radiology Tree app to read full this article<
Table 2
Results for Image Quality
Sequence Data Set I (First Pass) Data Set II (Fused Data Set)P Abdomen 2.5 2.9 <.01 Thighs 2.4 3.0 <.01 Calves 2.3 2.9 <.01
Get Radiology Tree app to read full this article<
Venous Overlay and Evaluation of Trace of Vessels and Minimal Vessel Size
Get Radiology Tree app to read full this article<
Get Radiology Tree app to read full this article<
Get Radiology Tree app to read full this article<
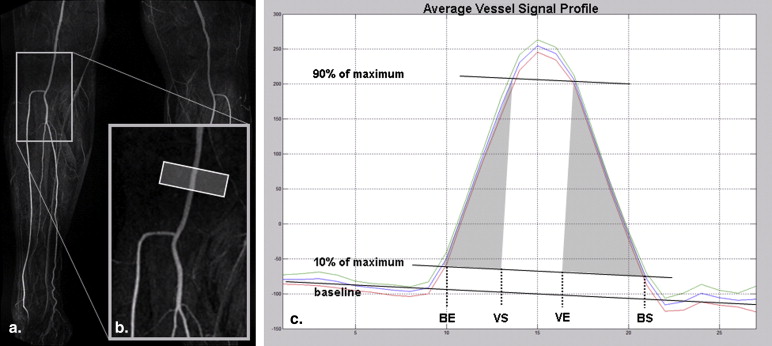
Sharpness of Edges
Get Radiology Tree app to read full this article<
Discussion
Get Radiology Tree app to read full this article<
Get Radiology Tree app to read full this article<
Get Radiology Tree app to read full this article<
Get Radiology Tree app to read full this article<
Get Radiology Tree app to read full this article<
Get Radiology Tree app to read full this article<
Get Radiology Tree app to read full this article<
Get Radiology Tree app to read full this article<
Get Radiology Tree app to read full this article<
Get Radiology Tree app to read full this article<
Get Radiology Tree app to read full this article<
Get Radiology Tree app to read full this article<
Get Radiology Tree app to read full this article<
Get Radiology Tree app to read full this article<
Get Radiology Tree app to read full this article<
Conclusions
Get Radiology Tree app to read full this article<
References
1. Berg F., Bangard C., Bovenschulte H., et. al.: Feasibility of peripheral contrast-enhanced magnetic resonance angiography at 3.0 Tesla with a hybrid technique: comparison with digital subtraction angiography. Invest Radiol 2008; 43: pp. 642-649.
2. Gozzi M., Amorico M.G., Colopi S., et. al.: Peripheral arterial occlusive disease: role of MR angiography. Radiol Med 2006; 111: pp. 225-237.
3. Vogt F.M., Herborn C.U., Parsons E.C., et. al.: Diagnostic performance of contrast-enhanced MR angiography of the aortoiliac arteries with the blood pool agent Vasovist: initial results in comparison to intra-arterial DSA. [article in German] Rofo 2007; 179: pp. 412-420.
4. Bremerich J., Bilecen D., Reimer P.: MR angiography with blood pool contrast agents. Eur Radiol 2007; 17: pp. 3017-3024.
5. Hartmann M., Wiethoff A.J., Hentrich H.R., et. al.: Initial imaging recommendations for Vasovist angiography. Eur Radiol 2006; 16: pp. B15-B23.
6. Rohrer M., Geerts-Ossevoort L., Laub G.: Technical requirements, biophysical considerations and protocol optimization with magnetic resonance angiography using blood-pool agents. Eur Radiol 2007; 17: pp. B7-B12.
7. Fink C., Goyen M., Lotz J.: Magnetic resonance angiography with blood-pool contrast agents: future applications. Eur Radiol 2007; 17: pp. B38-B44.
8. Foo T.K., Ho V.B., Hood M.N., et. al.: High-spatial-resolution multistation MR imaging of lower-extremity peripheral vasculature with segmented volume acquisition: feasibility study. Radiology 2001; 219: pp. 835-841.
9. Griswold M.A., Blaimer M., Breuer F., et. al.: Parallel magnetic resonance imaging using the GRAPPA operator formalism. Magn Reson Med 2005; 54: pp. 1553-1556.
10. Griswold M.A., Jakob P.M., Heidemann R.M., et. al.: Generalized autocalibrating partially parallel acquisitions (GRAPPA). Magn Reson Med 2002; 47: pp. 1202-1210.
11. Goyen M., Edelman M., Perreault P., et. al.: MR angiography of aortoiliac occlusive disease: a phase III study of the safety and effectiveness of the blood-pool contrast agent MS-325. Radiology 2005; 236: pp. 825-833.
12. Hoogeveen R.M., Bakker C.J., Viergever M.A.: Limits to the accuracy of vessel diameter measurement in MR angiography. J Magn Reson Imaging 1998; 8: pp. 1228-1235.
13. Maki J.H., Wilson G.J., Eubank W.B., et. al.: Utilizing SENSE to achieve lower station sub-millimeter isotropic resolution and minimal venous enhancement in peripheral MR angiography. J Magn Reson Imaging 2002; 15: pp. 484-491.
14. Bilecen D., Schulte A.C., Aschwanden M., et. al.: MR angiography with venous compression. Radiology 2004; 233: pp. 617-618.
15. Vogt F.M., Ajaj W., Hunold P., et. al.: Venous compression at high-spatial-resolution three-dimensional MR angiography of peripheral arteries. Radiology 2004; 233: pp. 913-920.
16. Herborn C.U., Ajaj W., Goyen M., et. al.: Peripheral vasculature: whole-body MR angiography with midfemoral venous compression—initial experience. Radiology 2004; 230: pp. 872-878.
17. Hadizadeh D.R., Gieseke J., Lohmaier S.H., et. al.: Peripheral MR angiography with blood pool contrast agent: prospective intraindividual comparative study of high-spatial-resolution steady-state MR angiography versus standard-resolution first-pass MR angiography and DSA. Radiology 2008; 249: pp. 701-711.
18. Nikolaou K., Kramer H., Grosse C., et. al.: High-spatial-resolution multistation MR angiography with parallel imaging and blood pool contrast agent: initial experience. Radiology 2006; 241: pp. 861-872.
19. Wang M.S., Haynor D.R., Wilson G.J., et. al.: Maximizing contrast-to-noise ratio in ultra-high resolution peripheral MR angiography using a blood pool agent and parallel imaging. J Magn Reson Imaging 2007; 26: pp. 580-588.
20. Michaely H.J., Thomsen H.S., Reiser M.F., et. al.: Nephrogenic systemic fibrosis (NSF)—implications for radiology. [article in German] Radiologe 2007; 47: pp. 785-793.
21. Hahn W.Y., Hecht E.M., Friedman B., et. al.: Distal lower extremity imaging: prospective comparison of 2-dimensional time of flight, 3-dimensional time-resolved contrast-enhanced magnetic resonance angiography, and 3-dimensional bolus chase contrast-enhanced magnetic resonance angiography. J Comput Assist Tomogr 2007; 31: pp. 29-36.
22. Pipe J.G.: Limits of time-of-flight magnetic resonance angiography. Top Magn Reson Imaging 2001; 12: pp. 163-174.
23. Miyazaki M., Lee V.S.: Nonenhanced MR angiography. Radiology 2008; 248: pp. 20-43.