
Rationale and Objectives
The aim of this study was to assess the correlation between age and spinal cord metabolic activity in children using positron emission tomography–computed tomography.
Materials and Methods
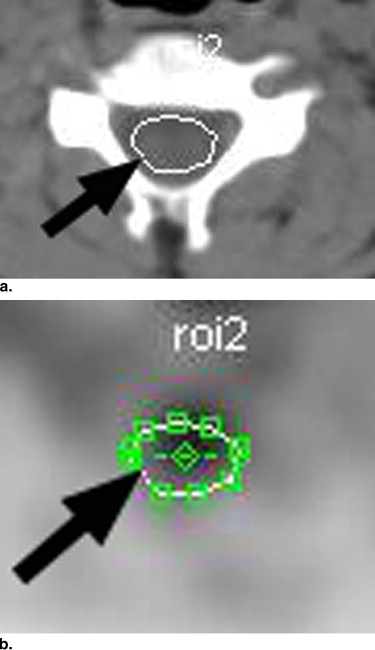
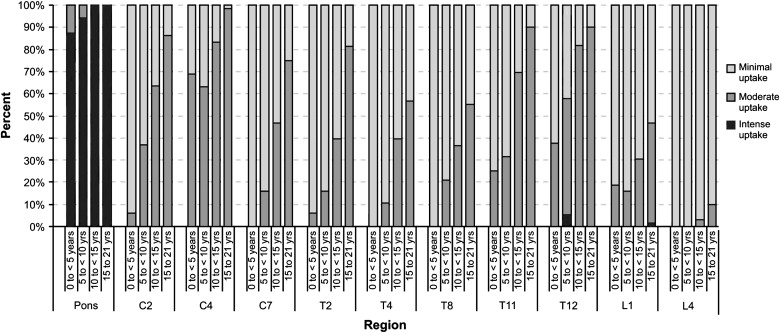
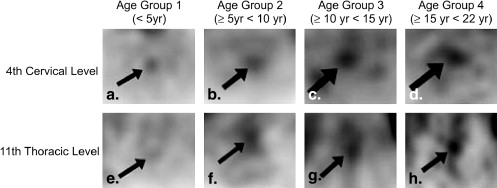
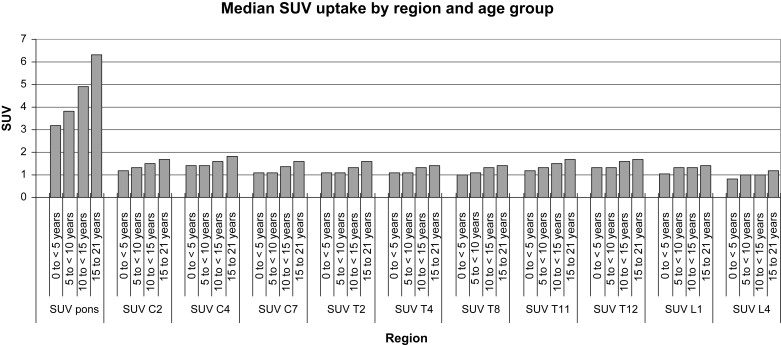
The cohort included 128 children imaged from January 2003 through April 2007, excluding those with spinal disease. Using axial images, the fluorodeoxyglucose activity in the pons and three cervical, three thoracic, and two lumbar spinal cord levels was subjectively graded as minimal, moderate, or intense. From regions of interest at each level, the maximum standardized uptake value was determined. Patients were grouped by age: group 1, <5 years; group 2, ≥5 to <10 years; group 3, ≥10 to <15 years; and group 4, ≥15 to <22 years. Subjective grade and standardized uptake values were compared at each level and for each level between age groups. The α level was set at 0.0046 on the basis of Bonferroni’s correction for multiple comparisons.
Results
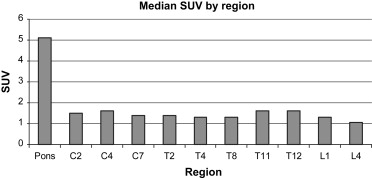
There were 16 patients in group 1, 19 in group 2, 33 in group 3, and 60 in group 4. Subjective grades and standardized uptake values were higher in the pons, midcervical, and low thoracic areas than elsewhere in all age groups. Subjective grades significantly increased with age in the cervical and thoracic cord ( P < .0005). Standardized uptake values in the pons and all cord levels significantly increased with increasing age ( P ≤ .0008).
Conclusions
In children, the metabolic activity of the spinal cord increases with age. On positron emission tomography, the cord can appear intensely avid in the midcervical and low thoracic areas.
This study was prompted by the observation of substantial variability among children in spinal cord fluorodeoxyglucose (FDG) uptake on positron emission tomography (PET)–computed tomography (CT) performed at our large children’s cancer hospital. We also noted variability in FDG uptake among the cervical, thoracic, and lumbar spinal cord levels. There is no literature describing the appearance on PET-CT of the spinal cord during childhood development. Therefore, to characterize the FDG metabolic activity of the normal, developing spinal cord on PET-CT, we sought to determine whether the subjective appearance or standardized uptake value (SUV) of the spinal cord correlated with patient age or spinal cord level in this patient population. Such information may help distinguish benign from pathologic spinal cord activity and may be useful in monitoring the response of the cord to therapies aimed at nerve root regeneration.
Materials and methods
Patient Selection
We searched our diagnostic imaging database for patients who underwent PET-CT from January 2003 to April 2007. We reviewed their medical records and recorded demographics, primary diagnoses, dates of diagnosis, and dates of the initiation of chemotherapy or radiation therapy. To avoid the potential effect of chemotherapy or radiation therapy on the spinal cord, we included only studies performed before the initiation of therapy. Patients who underwent PET-CT more than once were included only once, and the first study was used. Patients with tumors involving the spine or spinal canal were excluded. The requirement for informed consent was waived by the institutional review board, and the study was in compliance with the Health Insurance Portability and Accountability Act of 1996.
Scanning Parameters and Image Review
Get Radiology Tree app to read full this article<
Get Radiology Tree app to read full this article<
Get Radiology Tree app to read full this article<
Get Radiology Tree app to read full this article<
Statistical Analysis
Get Radiology Tree app to read full this article<
Results
Patient Characteristics
Get Radiology Tree app to read full this article<
Assessments on PET-CT
Get Radiology Tree app to read full this article<
Get Radiology Tree app to read full this article<
Discussion
Get Radiology Tree app to read full this article<
Get Radiology Tree app to read full this article<
Get Radiology Tree app to read full this article<
Get Radiology Tree app to read full this article<
Get Radiology Tree app to read full this article<
Get Radiology Tree app to read full this article<
References
1. Moye L.A.: The Bonferroni inequality.Macaskill P.Multiple analyses in clinical trials—fundamentals for investigators.2003.SpringerNew York:pp. 90-93.
2. Heinen F., Fietzek U.M., Berweck S., et. al.: Fast corticospinal system and motor performance in children: conduction proceeds skill. Pediatr Neurol 1998; 19: pp. 217-221.
3. Gilmore R.L., Bass N.H., Wright E.A., et. al.: Developmental assessment of spinal cord and cortical evoked potentials after tibial nerve stimulation: effects of age and stature on normative data during childhood. Electroencephalogr Clin Neurophysiol 1985; 62: pp. 241-251.
4. Allison T., Hume A.L., Wood C.C., et. al.: Developmental and aging changes in somatosensory, auditory and visual evoked potentials. Electroencephalogr Clin Neurophysiol 1984; 58: pp. 14-24.
5. Kalb R.G., Hockfield S.: Activity-dependent development of spinal cord motor neurons. Brain Res Brain Res Rev 1992; 17: pp. 283-289.
6. Wolpaw J.R.: The education and re-education of the spinal cord. Prog Brain Res 2006; 157: pp. 261-280.
7. Wolpaw J.R., Tennissen A.M.: Activity-dependent spinal cord plasticity in health and disease. Annu Rev Neurosci 2001; 24: pp. 807-843.
8. Moskowitz D., Weinberger E., Shurtleff D.B.: Normal growth of the spinal cord. Eur J Pediatr Surg 1999; 9: pp. 48-49.
9. Gardner E., Gray D.J., O’Rahilly R.: The spinal cord and meninges.Meier A.Anatomy.1986.W.B. SaundersPhiladelphia, PA:pp. 544-551.
10. Moskowitz D., Shurtleff D.B., Weinberger E., et. al.: Anatomy of the spinal cord in patients with meningomyelocele with and without hypoplasia or hydromyelia. Eur J Pediatr Surg 1998; 8: pp. 18-21.
11. Doot R.K., Dunnwald L.K., Schubert E.K., et. al.: Dynamic and static approaches to quantifying 18F-FDG uptake for measuring cancer response to therapy, including the effect of granulocyte CSF. J Nucl Med 2007; 48: pp. 920-925.