
Rationale and Objectives
Capillarization of sinusoids and change of trabecular thickness are the main histologic features in hepatocellular carcinoma (HCC). Of particular interest are the three-dimensional (3D) visualization and quantitative evaluation of such alterations in the HCC progression. X-ray phase-contrast computed tomography (PCCT) is an emerging imaging method that provides excellent image contrast for soft tissues. This study aimed to explore the potential of in-line PCCT in microstructure imaging of capillarized sinusoids and trabecular structure in human HCC tissues and to quantitatively evaluate the alterations of those fine structures during the development of HCC.
Materials and Methods
This project was designed as an ex vivo experimental study. The study was approved by the institutional review board, and informed consent was obtained from the patients. Eight human resected HCC tissue samples were imaged using in-line PCCT. After histologic processing, PCCT images and histopathologic data were matched. Fine structures in HCC tissues were revealed. Quantitative analyses of capillarized sinusoids (ie, percentage of sinusoidal area [PSA], sinusoidal volume) and trabecular structure (ie, trabecular thickness, surface-area-to-volume ratio [SA/V]) in low-grade (well or moderately differentiated) and high-grade (poorly differentiated) HCC groups were performed.
Results
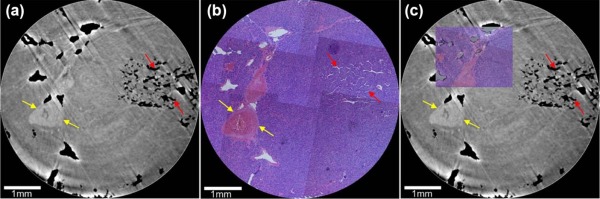
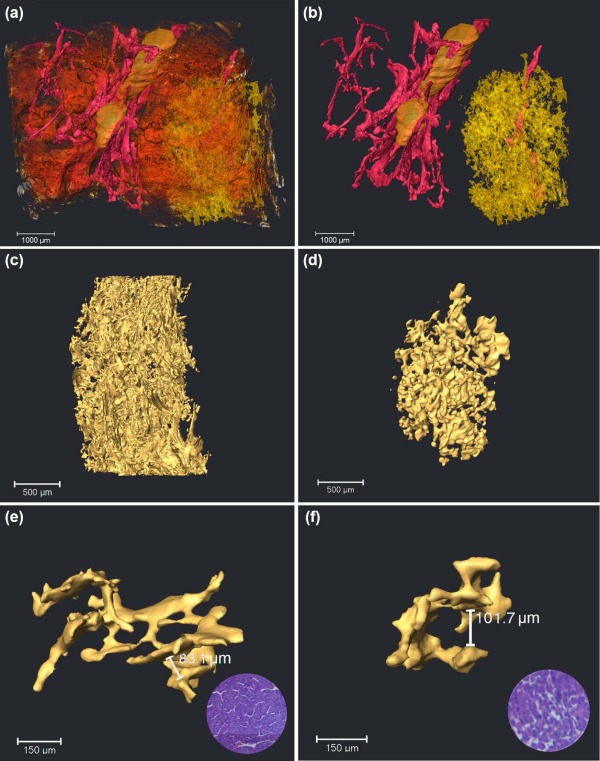
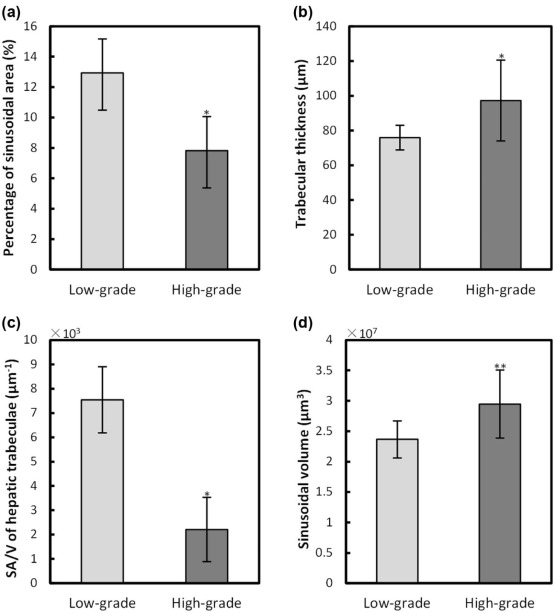
Using PCCT, the alterations of capillarized sinusoids and trabecular structure were clearly observed in 3D geometry, which was confirmed by the corresponding histologic sections. The 3D qualitative analyses of sinusoids in the high-grade HCC group were significantly different ( P < 0.05) in PSA (7.8 ± 2.5%) and sinusoidal volume (2.9 ± 0.6 × 10 7 µm 3 ) from those in the low-grade HCC group (PSA, 12.9 ± 2.2%; sinusoidal volume, 2.4 ± 0.3 × 10 7 µm 3 ). Moreover, the 3D quantitative evaluation of the trabecular structure in the high-grade HCC group showed a significant change ( P < 0.05) in the trabecular thickness (87.8 ± 15.6 µm) and SA/V (2.2 ± 1.3 × 10 3 µm − 1 ) compared to the low-grade HCC group (trabecular thickness, 75.9 ± 7.1 µm; SA/V, 7.5 ± 1.3 × 10 3 µm − 1 ).
Conclusions
This study provides insights into the 3D alterations of microstructures such as capillarized sinusoids and the trabecular structure at a micrometer level, which might allow for an improved understanding of the development of HCC.
Introduction
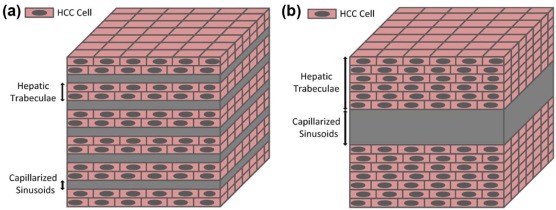
Hepatocellular carcinoma (HCC) is one of the most common malignant tumors and has a very poor prognosis, making it the third leading cause of cancer-related mortality worldwide . According to the World Health Organization classification, HCCs are histologically classified as well-differentiated, moderately differentiated, poorly differentiated HCCs, and undifferentiated types. Well or moderately differentiated HCC is associated with better patient survival rate. Conversely, poorly differentiated HCC is characterized by poorer prognosis . The poor prognosis strongly correlates with the alterations of hepatic sinusoids and hepatictrabeculae, which are important structures in the liver. Exhibition and analysis of the alterations of these fine structures can improve the understanding of the development of HCC. In the normal liver, hepatic sinusoids are irregular, tubular, or saccular, with diameters ranging from 20 µm to 30 µm , and they are surrounded by hepatic trabeculae which are formed in hepatocyte rows . In HCC, capillarization of sinusoids is a well-recognized phenomenon and characterized by the deposition of a fibrillar extracellular matrix in Disse’s spaces, resulting in the impairment of the metabolic exchange between blood and liver cells . Moreover, the trabecular structure in the HCC tissues, which surrounds the capillarized sinusoids, is composed of malignant cells with trabecular growth of three or more cells in thickness . Conventionally, histologic analysis of pathologic sections has been used to provide the morphologic and quantitative assessment of the capillarized sinusoids and hepatic trabeculae in HCC. However, this invasive technique has some inherent limitations, such as its complexity, destructiveness, and sampling error . In addition, accurate visualization of the capillarized sinusoids and trabecular structure has been limited by the resolution and contrast available with current clinical imaging technologies, such as ultrasound, magnetic resonance imaging, conventional radiography, and computed tomography (CT). Thus, there is a need for sensitive, reliable, and noninvasive imaging techniques for assessing the anatomic and pathologic features of capillarized sinusoids and the trabecular structure in HCC tissues.
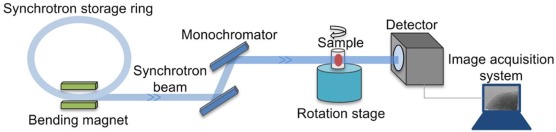
It has been demonstrated that x-ray phase-contrast imaging (PCI) has outstanding potential for medical applications . Compared to the traditional absorption-based x-ray imaging, PCI has approximately 1000 times greater sensitivity in the detection of soft tissues, and its spatial resolution can be in the order of microns or even submicrons . Combined with CT, x-ray phase-contrast computed tomography (PCCT) has been developed and is characteristic of high sensitivity and three-dimensional (3D) imaging of soft tissues . Several techniques are now available to exploit and visualize the phase contrast, such as the interferometric method , the analyzer-based method , the grating-based method , and the in-line method . In-line PCCT is a holography technique that generates intensity distribution including phase information . Among these PCCT techniques, in-line PCCT has the simplest experimental setup requiring no optical element . In-line PCCT has attracted increasing attention due to its promising application in various research fields . Moreover, its advantages over the current clinical imaging technologies, such as conventional CT and magnetic resonance imaging, have been demonstrated in previous studies . Based on the in-line PCCT technique, morphologic alterations of the sinusoids, such as the diameter, surface area, and volume, have been recently reported in human cavernous hemangioma of the liver . However, to our knowledge, the micro-architectures of human HCC, such as sinusoids and the trabecular structure, have rarely been investigated by PCCT.
Get Radiology Tree app to read full this article<
Materials and Methods
Sample Preparation
Get Radiology Tree app to read full this article<
Image Acquisition
Get Radiology Tree app to read full this article<
Get Radiology Tree app to read full this article<
Get Radiology Tree app to read full this article<
Image Reconstruction and 3D Visualization
Get Radiology Tree app to read full this article<
Image Analysis
Get Radiology Tree app to read full this article<
R=S1Vg−V1 R
=
S
1
V
g
−
V
1
where R R represents the SA/V, Vg V
g denotes the volume of interest, and S1 S
1 and V1 V
1 are the surface area and the sinusoidal volume of capillarized sinusoids, respectively. Trabecular thickness indicates the thickness of the trabecular plate, which consists of several rows of liver cells. The information about trabecular thickness could be indirectly obtained by analyzing the 3D structure of capillarized sinusoids, which run between the trabecular structure in HCC tissues. In HCC tissues, the structures such as sinusoids or trabeculae are sparsely distributed and always densely concentrated in a certain area (ie, sinusoidal area) . To quantitatively evaluate sinusoidal volume, SA/V, and trabecular thickness in HCC tissues, 20 3D-reconstructed cubes of 60 × 60 × 60 pixels were randomly acquired from sinusoidal areas in each group.
Get Radiology Tree app to read full this article<
Statistical Analysis
Get Radiology Tree app to read full this article<
Results
PCCT Imaging and Histopathologic Analysis
Get Radiology Tree app to read full this article<
Get Radiology Tree app to read full this article<
The 3D Visualization of Capillarized Sinusoids
Get Radiology Tree app to read full this article<
Get Radiology Tree app to read full this article<
Quantitative Assessment of Capillarized Sinusoids and Trabecular Structure
Get Radiology Tree app to read full this article<
Get Radiology Tree app to read full this article<
Discussion
Get Radiology Tree app to read full this article<
Get Radiology Tree app to read full this article<
Get Radiology Tree app to read full this article<
Get Radiology Tree app to read full this article<
Get Radiology Tree app to read full this article<
Get Radiology Tree app to read full this article<
Acknowledgments
Get Radiology Tree app to read full this article<
Supplementary Data
Get Radiology Tree app to read full this article<
Figure S1
Get Radiology Tree app to read full this article<
Get Radiology Tree app to read full this article<
Get Radiology Tree app to read full this article<
Video S1
Get Radiology Tree app to read full this article<
Get Radiology Tree app to read full this article<
Get Radiology Tree app to read full this article<
References
1. Botha J.F., Langnas A.N.: Liver transplantation for hepatocellular carcinoma: an update. J Natl Compr Canc Netw 2006; 4: pp. 762-767.
2. Tamura S., Kato T., Berho M., et. al.: Impact of histological grade of hepatocellular carcinoma on the outcome of liver transplantation. Arch Surg 2001; 136: pp. 25-30.
3. Dudek K., Kornasiewicz O., Remiszewski P., et. al.: Impact of tumor characteristic on the outcome of liver transplantation in patients with hepatocellular carcinoma. Transplant Proc 2009; 41: pp. 3135-3137.
4. Duan J., Hu C., Chen H.: High-resolution micro-CT for morphologic and quantitative assessment of the sinusoid in human cavernous hemangioma of the liver. PLoS ONE 2013; 8: pp. e53507.
5. Perrault M., Pecheur E.I.: The hepatitis C virus and its hepatic environment: a toxic but finely tuned partnership. Biochem J 2009; 423: pp. 303-314.
6. Gutierrez-Ruiz M.C., Robles-Diaz G., Kershenobich D.: Emerging concepts in inflammation and fibrosis. Arch Med Res 2002; 33: pp. 595-599.
7. Jin Y., Chen J.N., Feng Z.Y., et. al.: OPN and alphavbeta3 expression are predictors of disease severity and worse prognosis in hepatocellular carcinoma. PLoS ONE 2014; 9: pp. e87930.
8. Zhang X., Yang X.R., Chen Y., et. al.: Visualising liver fibrosis by phase-contrast X-ray imaging in common bile duct ligated mice. Eur Radiol 2013; 23: pp. 417-423.
9. Zhou S.A., Brahme A.: Development of phase-contrast X-ray imaging techniques and potential medical applications. Phys Med 2008; 24: pp. 129-148.
10. Takeda T., Momose A., Wu J., et. al.: Vessel imaging by interferometric phase-contrast X-ray technique. Circulation 2002; 105: pp. 1708-1712.
11. Wang L., Li X., Wu M., et. al.: A sparse-projection computed tomography reconstruction method for in vivo application of in-line phase-contrast imaging. Biomed Eng Online 2013; 12: pp. 75.
12. Momose A.: Demonstration of phase-contrast X-ray computed tomography using an X-ray interferometer. Nucl Instrum Methods Phys Res A 1995; 352: pp. 622-628.
13. Davis T.J., Gao D., Gureyev T.E., et. al.: Phase-contrast imaging of weakly absorbing materials using hard X-rays. Nature 1995; 373: pp. 595-598.
14. Momose A., Kawamoto S., Koyama I., et. al.: Demonstration of X-Ray Talbot Interferometry. Jpn J Appl Phys 2003; 42: pp. L866-L868.
15. Snigirev A., Snigireva I., Kohn V., et. al.: On the possibilities of x-ray phase contrast microimaging by coherent high-energy synchrotron radiation. Rev Sci Instrum 1995; 66: pp. 5486-5492.
16. Wilkins S.W., Gureyev T.E., Gao D., et. al.: Phase-contrast imaging using polychromatic hard X-rays. Nature 1996; 384: pp. 335-338.
17. Lewis R.A.: Medical phase contrast x-ray imaging: current status and future prospects. Phys Med Biol 2004; 49: pp. 3573-3583.
18. Cloetens P., Pateyron-Salome M., Buffiere J.Y., et. al.: Observation of microstructure and damage in materials by phase sensitive radiography and tomography. J Appl Phys 1997; 81: pp. 5878-5886.
19. Baruchel J., Bleuet P., Bravin A., et. al.: Advances in synchrotron hard X-ray based imaging. C R Phys 2008; 9: pp. 624-641.
20. Kitchen M., Lewis R., Morgan M.J., et. al.: Dynamic measures of regional lung air volume using phase contrast x-ray imaging. Phys Med Biol 2008; 53: pp. 6065-6077.
21. Castelli E., Tonutti M., Arfelli F., et. al.: Mammography with synchrotron radiation: first clinical experience with phase-detection technique. Radiology 2011; 259: pp. 684-694.
22. Horng A., Brun E., Mittone A., et. al.: Cartilage and soft tissue imaging using X-rays: propagation-based phase-contrast computed tomography of the human knee in comparison with clinical imaging techniques and histology. Invest Radiol 2014; 49: pp. 627-634.
23. Colecchia A., Scaioli E., Montrone L., et. al.: Pre-operative liver biopsy in cirrhotic patients with early hepatocellular carcinoma represents a safe and accurate diagnostic tool for tumour grading assessment. J Hepatol 2011; 54: pp. 300-305.
24. Pawlik T.M., Gleisner A.L., Anders R.A., et. al.: Preoperative assessment of hepatocellular carcinoma tumor grade using needle biopsy: implications for transplant eligibility. Ann Surg 2007; 245: pp. 435-442.
25. Weitkamp T., Haas D., Wegrzynek D., et. al.: ANKAphase: software for single-distance phase retrieval from inline X-ray phase-contrast radiographs. J Synchrotron Radiat 2011; 18: pp. 617-629.
26. Chen R.C., Dreossi D., Mancini L., et. al.: PITRE: software for phase-sensitive X-ray image processing and tomography reconstruction. J Synchrotron Radiat 2012; 19: pp. 836-845.
27. Chen R.C., Rigon L., Longo R.: Quantitative 3D refractive index decrement reconstruction using single-distance phase-contrast tomography data. J Phys D Appl Phys 2011; 44: pp. 495401.
28. Okamoto D., Yoshimitsu K., Nishie A., et. al.: Enhancement pattern analysis of hypervascular hepatocellular carcinoma on dynamic MR imaging with histopathological correlation: validity of portal phase imaging for predicting tumor grade. Eur J Radiol 2012; 81: pp. 1116-1121.
29. Xia Y., Jiang Y.X., Dai Q., et. al.: Contrast-enhanced ultrasound of hepatocellular carcinoma: correlation of washout time and angiogenesis. Clin Hemorheol Microcirc 2011; 48: pp. 265-273.
30. van Hoek M.J., Hogeweg P.: Metabolic adaptation after whole genome duplication. Mol Biol Evol 2009; 26: pp. 2441-2453.
31. Shimizu H., Mimoto K., Yokoyama T.: Topological difference in the three-dimensional sinusoid structure between normal human liver and hepatocellular carcinoma. Microvasc Res 1991; 42: pp. 280-287.
32. Yoon Y.J., Chang S., Kim O.Y., et. al.: Three-dimensional imaging of hepatic sinusoids in mice using synchrotron radiation micro-computed tomography. PLoS ONE 2013; 8: pp. e68600.
33. Hu D.D., Chen Y., Bihi A., et. al.: A new conversation between radiology and pathology-identifying microvascular architecture in stages of cirrhosis via diffraction enhanced imaging in vitro. PLoS ONE 2014; 9: pp. e87957.
34. Stefan H., Marc B., Alexander B., et. al.: Prediction and validation of cell alignment along microvessels as order principle to restore tissue architecture in liver regeneration. Proc Natl Acad Sci USA 2010; 107: pp. 10371-10376.
35. Hu J., Cao Y., Li D., et. al.: High-resolution three-dimensional visualization of the rat spinal cord microvasculature by synchrotron radiation micro-CT. Med Phys 2014; 41: pp. 101904.
36. Brandlhuber M., Armbruster M., Zupanc B., et. al.: A novel and sensitive approach for the evaluation of liver ischemia-reperfusion injury after liver transplantation. Invest Radiol 2016; 51: pp. 170-176.
37. Xuan R., Zhao X., Hu D., et. al.: Three-dimensional visualization of the microvasculature of bile duct ligation-induced liver fibrosis in rats by x-ray phase-contrast imaging computed tomography. Sci Rep 2015; 5: pp. 11500.
38. Jian J., Yang H., Zhao X., et. al.: Visualization of microvasculature and thrombi by X-ray phase-contrast computed tomography in hepatocellular carcinoma. J Synchrotron Radiat 2016; 23: pp. 600-605.
39. Herzen J., Willner M.S., Fingerle A.A., et. al.: Imaging liver lesions using grating-based phase-contrast computed tomography with bi-lateral filter post-processing. PLoS ONE 2014; 9: pp. e83369.
40. Yamaguchi R., Nakashima O., Ogata T., et. al.: Hepatocellular carcinoma with an unusual neuroendocrine component. Pathol Int 2004; 54: pp. 861-865.
41. Onori P., Morini S., Franchitto A., et. al.: Hepatic microvascular features in experimental cirrhosis: a structural and morphometrical study in CCl 4-treated rats. J Hepatol 2000; 33: pp. 555-563.
42. Wanless I.R.: Terminology of nodular hepatocellular lesions. Hepatology 1995; 22: pp. 983-993.
43. Hetterich H., Willner M., Fill S., et. al.: Phase-contrast CT: qualitative and quantitative evaluation of atherosclerotic carotid artery plaque. Radiology 2014; 271: pp. 870-878.
44. Hagen C.K., Munro P.R., Endrizzi M., et. al.: Low-dose phase contrast tomography with conventional x-ray sources. Med Phys 2014; 41: pp. 070701.
45. Takeda T., Yoneyama A., Wu J., et. al.: In vivo physiological saline-infused hepatic vessel imaging using a two-crystal-interferometer-based phase-contrast X-ray technique. J Synchrotron Radiat 2012; 19: pp. 252-256.
46. Bech M., Tapfer A., Velroyen A., et. al.: In-vivo dark-field and phase-contrast x-ray imaging. Sci Rep 2013; 3: pp. 3209.
47. Eppel G.A., Jacono D.L., Shirai M., et. al.: Contrast angiography of the rat renal microcirculation in vivo using synchrotron radiation. Am J Physiol Renal Physiol 2009; 296: pp. F1023-F1031.