
Rationale and Objectives
We sought to investigate the utility of phase-contrast diffuse optical tomography (PCDOT) for differentiation of malignant and benign breast masses in humans and to compare PCDOT with conventional diffuse optical tomography (DOT) for analysis of breast masses in humans.
Materials and Methods
Thirty-five breast masses were imaged in 33 patients (mean age, 51 years; range, 22–80) using PCDOT. Images characterizing the tissue refractive index, and absorption and scattering coefficients of breast masses were obtained with a finite element-based reconstruction algorithm. Theses images were then analyzed and compared with the biopsy/pathology results for all the cases examined.
Results
Malignant lesions tended to have a decreased refractive index, allowing them to be discriminated from benign lesions in most cases, whereas absorption and scattering images were unable to accurately discriminate benign from malignant lesions. The sensitivity, specificity, false-positive value, and overall accuracy for refractive index imaging were 81.8%, 70.8%, 29.2%, and 74.3%, respectively. The accuracy of refractive index imaging increases with increasing patient age.
Conclusion
Refractive index is a new parameter for optical imaging that may be helpful in differentiating between malignant and benign masses in the breast.
The low specificity of x-ray mammography, the current clinical tool for breast imaging, suggests that many women without cancer will receive recommendations to undergo a breast biopsy (ie, false-positive examinations). This results in four or five benign breast biopsy results for every one malignancy that is detected ( ). In addition, mammography has an unacceptable false-negative rate for patients with radiodense breast tissues ( ). For example, the sensitivity of screening mammography decreases from a high of 88% in the predominantly fatty breast to 62% in the dense breast ( ). Thus, there is a critical need to develop new technologies that can improve the sensitivity and specificity of mammography. Several other conventional techniques are currently under investigation for breast cancer detection, including ultrasound (US), magnetic resonance imaging (MRI), and computed tomography (CT) ( ). Among these conventional alternatives or supplements, MRI is the most widely studied and potentially promising solution to dense breast imaging. A recent MRI study of 821 women showed a sensitivity of 88% and corresponding specificity of 68% regardless of breast density ( ). Similar high sensitivities of MRI for breast cancer have also been found in other studies involving targeted imaging of high-risk populations ( ). Although MRI appears to offer high sensitivity in the dense breast, its specificity has been far more modest. In addition, MRI is costly ( ) and not suitable for breast screening.
Near-infrared (NIR) light–based diffuse optical tomography (DOT) is emerging as a nonconventional alternative for breast cancer detection. The ability of DOT techniques to noninvasively image and analyze both tissue structure and function, as well as the advantages of low cost and portability, has great potential to make DOT an ideal candidate for routine breast screening. Although DOT has been shown to have high sensitivity for breast tumor detection, its specificity is limited ( ). Detection of tumors by DOT is so far primarily based on tissue absorption and scattering parameters or absorption-derived functional parameters. However, these imaging parameters available from the current DOT do not appear to be able to fully characterize breast tissue, which results in limited sensitivity and specificity.
Get Radiology Tree app to read full this article<
Get Radiology Tree app to read full this article<
Materials and methods
Patient Examinations
Get Radiology Tree app to read full this article<
Table 1
Characteristics of Malignant Lesions: Pathology, Mammography, and Phase-contrast Diffuse Optical Tomography
Biopsy Findings Lesion Size † (cm) BIRADS Score ⁎ The Difference of RI Between Lesion and Normal Tissue 2 3 4 5 Δ n < 0 Δ n > 0 Lobular carcinoma ( n = 3) 0.5, 1.0, 2.0 1 1 3 0 Infiltrating ductal carcinoma ( n = 6) 5, 2, 2, 10, 1.9 3 1 4 2 Extensive intraductal breast carcinoma ( n = 1) 2.5 1 1 0 Invasive carcinoma with mixed ductal and lobular features ( n = 1) 0.8 1 1 0
BIRADS, Breast Imaging Reporting and Data System; RI, refractive index.
Get Radiology Tree app to read full this article<
Get Radiology Tree app to read full this article<
Table 2
Characteristics of Benign Lesions as Determined at Biopsy, Mammography, and Phase-contrast Diffuse Optical Tomography
Imaging Findings Pathology Findings Lesion Size † (cm) BIRADS Score ⁎ The difference of RI Between Lesion and Normal Tissue 1 2 3 4 Δ n < 0 Δ n > 0 Mass Adipose tissue with focal fibrosis ( n = 1) N/A 0 1 Mass or lump ( n = 4) 1.3, 2 2 1 3 Cysts ( n = 6) 1.6, 0.3, 0.8 2 1 1 5 Lymph node ( n = 1) 2.1 1 0 1 Fibroadenomas ( n = 2) 2, 3 1 1 2 0 Infarcted intraductal papilloma ( n = 1) 1 1 0 1 Asymmetric density Fibrocystic mastophy ( n = 1) 2.3 1 0 1 Fibroadipose tissue ( n = 5) 1.8, 0.8 2 3 1 4 Fibroadenomatoid change and microcalcifications ( n = 1) N/A 1 0 Calcifications Microcalcification, atypical ductal hyperplasia present ( n = 1) N/A 1 1 0 Benign calcification ( n = 1) 0.3 1 0 1
BIRADS, Breast Imaging Reporting and Data System; RI, refractive index.
Get Radiology Tree app to read full this article<
Get Radiology Tree app to read full this article<
Get Radiology Tree app to read full this article<
Get Radiology Tree app to read full this article<
Get Radiology Tree app to read full this article<
Image Reconstruction Methods
Get Radiology Tree app to read full this article<
∇⋅D∇Φ(r)+2Dn∇n⋅∇Φ(r)−μaΦ(r)=−S0δ(r−r0) ∇
⋅
D
∇
Φ
(
r
)
+
2
D
n
∇
n
⋅
∇
Φ
(
r
)
−
μ
a
Φ
(
r
)
=
−
S
0
δ
(
r
−
r
0
)
where Φ is the photon density; n is the refractive index; D and μ a are the diffusion and absorption coefficients, respectively; and S 0 is the source strength. For PCDOT, the reconstruction algorithm is similar to that of conventional DOT ( ); that is, we use a regularized Newton’s method to update an initial RI distribution iteratively to minimize an object function composed of a weighted sum of the squared difference between computed and measured optical data at the surface of the medium. The computed optical data (i.e., photon density) are obtained by solving Equation 1 with the finite element method. Tissue absorption and diffusion or scattering coefficients were reconstructed separately with conventional DOT. The algorithm has been successfully tested using extensive tissue-mimicking phantom measurements with different contrasts of RI between the target and background ( ).
Get Radiology Tree app to read full this article<
Statistical Analysis
Get Radiology Tree app to read full this article<
Results
Get Radiology Tree app to read full this article<
Get Radiology Tree app to read full this article<
Get Radiology Tree app to read full this article<
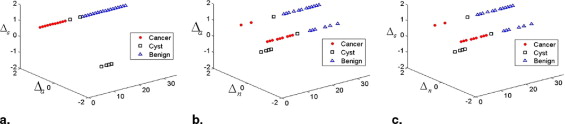
Table 3
Differentiation of Benign from Malignant Tumors Based on Refractive Index Images
True Positives True Negatives False Positives False Negatives Sensitivity Specificity FPR Overall Accuracy 9 17 7 2 81.8% 70.8% 29.2% 74.3%
Get Radiology Tree app to read full this article<
Get Radiology Tree app to read full this article<
Table 4
Accuracy of Phase-contrast Diffuse Optical Tomography According to Tumor Size, Age, or Size of Breast (Imaging Plane)
No. of Cases True False Accuracy Lesion size (cm) >1 20 15 5 0.75 (15/20) <1 10 8 2 0.8 (8/10) Unknown 5 3 2 0.6 (3/5) Age (yr) <40 7 4 3 0.5714 (4/7) 41–49 8 5 3 0.625 (5/8) 50–59 10 8 2 0.8 (8/10) >60 10 9 1 0.9 (9/10) Size of breast (radius of image plane) (mm) <40 17 12 5 0.7059 (12/17) 40.5–59 12 10 2 0.8333 (10/12) >59.5 6 4 2 0.6667 (4/6)
Get Radiology Tree app to read full this article<
Discussion
Get Radiology Tree app to read full this article<
Conclusions
Get Radiology Tree app to read full this article<
Get Radiology Tree app to read full this article<
References
1. Doyle A.J., Murray K.A., Nelson E.W.: Selective use of image-guided large-core needle biopsy of the breast: Accuracy and cost-effectiveness. AJR Am J Roentgenol 1995; 165: pp. 281-284.
2. Liberman L., Feng T.L., Dershaw D.D.: US-guided core breast biopsy: Use and cost-effectiveness. Radiology 1998; 208: pp. 717-723.
3. Carney P.A., Miglioretti D.L., Yankaskas B.C., et. al.: Individual and combined effects of age, breast density, and hormone replacement therapy use on the accuracy of screening mammography. Ann Intern Med 2003; 138: pp. 168-175.
4. Sickles E.A., Miglioretti D.L., Ballard-Barbash R., et. al.: Performance benchmarks for diagnostic mammography. Radiology 2005; 235: pp. 775-790.
5. Boyd N.F., Lockwood G.A., Byng J.W., et. al.: Mammographic densities and breast cancer risk. Cancer Epidemiol Biomarkers Prev 1998; 7: pp. 1133-1144.
6. Lam P.B., Vacek P.M., Geller B.M., et. al.: The association of increased weight, body mass index, and tissue density with the risk of breast carcinoma in Vermont. Cancer 2000; 89: pp. 369-375.
7. Sabel M., Aichinger H.: Recent developments in breast imaging. Phys Med Biol 1996; 41: pp. 315-368.
8. Bluemke D.A., Gatsonis C.A., Chen M.H., et. al.: Magnetic resonance imaging of the breast prior to biopsy. JAMA 2004; 292: pp. 2735-2742.
9. Warner E., Plewes D.B., Hill K.A., et. al.: Surveillance of BRCA1 and BRCA2 mutation carriers with magnetic resonance imaging, ultrasound, mammography, and clinical breast examination. JAMA 2004; 292: pp. 1317-1325.
10. Bluemke D.A., Gatsonis C.A., Chen M.H., et. al.: Magnetic resonance imaging of the breast prior to biopsy. JAMA 2004; 292: pp. 2735-2742.
11. Berg W.A., Gutierrez L., NessAiver M.S., Carter W.B., Bhargavan M., Lewis R.S., Loffe O.B.: Diagnostic accuracy of mammography, clinical examination, US, and MR imaging in preoperative assessment of breast cancer. Radiology 2004; 233: pp. 830-849.
12. Ntziachristos V., Yodh A.G., Schnall M., Chance B.: Concurrent MRI and diffuse optical tomography of breast after indocyanine green enhancement. Proc Natl Acad Sci USA 2000; 97: pp. 2767-2772.
13. Jiang H., Iftimia N., Xu Y., Eggert J., Fajardo L.L., Klove K.: Near-infrared optical imaging of the breast with model-based reconstruction. Acad Radiol 2002; 9: pp. 186-194.
14. Zhu Q., Cronin E.B., Currier A.A., et. al.: Benign versus malignant breast masses: Optical differentiation with US-guided optical imaging reconstruction. Radiology 2005; 237: pp. 57-66.
15. Cerussi A.E., Berger A.J., Bevilacqua F., et. al.: Sources of absorption and scattering contrast for near-infrared optical mammography. Acad Radiol 2001; 8: pp. 211-218.
16. Durduran T., Choe R., Culver J.P., et. al.: Bulk optical properties of healthy female breast tissue. Phys Med Biol 2002; 47: pp. 2847-2861.
17. Ntziachristos V., Yodh A.G., Schnall M.D., et. al.: MRI-guided diffuse optical spectroscopy of malignant and benign breast lesions. Neoplasia 2002; 4: pp. 347-354.
18. Jiang H., Xu Y., Iftimia N., Eggert J., Klove K., Baron L., Fajardo L.: Three-dimensional optical tomographic imaging of breast in a human subject. IEEE Trans Med Imaging 2001; 20: pp. 1334-1340.
19. Brooksby B., Jiang S., Dehghani H., Pogue B.W., Paulsen K.D.: Combining near-infrared tomography and magnetic resonance imaging to study in vivo breast tissues: Implementation of a Laplacian-type regularization to incorporate magnetic resonance structure. J Biomed Optics 2005; pp. 1-10.
20. Spinelli L., Torricelli A., Pifferi A., et. al.: Bulk optical properties and tissue components in the female breast from multiwavelength time-resolved optical mammography. J Biomed Optics 2004; 9: pp. 1137-1142.
21. Franceschini M.A., Moesta K.T., Fantini S., et. al.: Frequency-domain techniques enhance optical mammography: Initial clinical results. Prod Natl Acad Sci USA 1997; 94: pp. 6468-6473.
22. Grosenick D., Moesta K.T., Wabnitz H., et. al.: Time-domain optical mammography: Initial clinical results on detection and characterization of breast tumors. Appl Optics 2003; 42: pp. 3170-3186.
23. Jiang H., Xu Y.: Phase-contrast imaging of tissue using near-infrared diffusing light. Med Phys 2003; 30: pp. 1048-1051.
24. Knuttel J.M., Boehlau-Godau M.: Spatially confined and temporally resolved refractive index and scattering evaluation in human skin performed with optical coherence tomography. J Biomed Opt 2000; 5: pp. 83-92.
25. Schmitt J.M., Kumar G.: Optical scattering properties of soft tissue: A discrete particle model. Appl Opt 1998; 37: pp. 2788-2797.
26. Bennett H., Osterberg H., Jupnik H., Richards O.: Phase Microscope: Principles and Applications.1951.John Wiley & SonsNew York
27. Bereiter-Hahn J., Fox C., Thorell B.: Quantitative reflection contrast microscope of living cells. J Cell Biol 1979; 82: pp. 767-779.
28. Takeda T., Momose A., Hirano K., Haraoka S., Watanabe T., Itai Y.: Human carcinoma: Early experience with phase-contrast X-ray CT with synchrotron radiation: Comparative specimen study with optical microscope. Radiology 2000; 214: pp. 298-301.
29. Davis J., Gao D., Gureyev T., Stevenson A., Wilkins S.: Phase-contrast imaging of weakly absorbing materials using hard X-rays. Nature 1995; 373: pp. 595-598.
30. Tearney G.J., Brezinski M.E., Southern J., Bouma B., Hee M., Fujimoto J.: Determination of the refractive index of highly scattering human tissue by optical coherence tomography. Opt Lett 1995; 20: pp. 2258-2260.
31. Zysk A., Chaney E., Boppart S.: Refractive index of carcinogen-induced rat mammary tumors. Phys Med Biol 2006; 51: pp. 2165-2177.
32. Das B., Liu F., Alfano R.: Time-resolved fluorescence and photon migration studies in biomedical and model random media. Rep Prog Phys 1997; 60: pp. 227-292.
33. Iftimia N., Gu X., Xu Y., Jiang H.: A compact, parallel-detection diffuse optical mammography system. Rev Sci Instr 2003; 74: pp. 2836-2842.
34. Jiang H.: The diffusion approximation for turbid media with a spatially varying refractive index. Proc Adv Opt Imaging Photon Migration Opt Soc Am 2000; pp. 366-368.
35. Iftimia N., Jiang H.: Quantitative optical image reconstruction of turbid media using DC measurements. Appl Opt 2000; 39: pp. 5256-5261.
36. Jiang H., Xu Y.: Phase-contrast imaging of tissue using near-infrared diffusing light. Med Phys 2003; 30: pp. 1048-1051.
37. Gu X., Zhang Q., Bartlett M., Schutz L., Fajardo L.L., Jiang H.: Differentiation of cysts from solid tumors in the breast with diffuse optical tomography. Acad Radiol 2004; 11: pp. 53-60.
38. Casciari J.J., Sotirchaos S.V., Sutherland R.M.: Variations in tumor cell growth rates and metabolism with oxygen concentration, glucose concentration, and extracellular pH. J Cell Physiol 2005; 151: pp. 386-394.
39. Liang X., Zhang Q., Jiang H.: Quantitative reconstruction of refractive index distribution and imaging of glucose concentration by using diffusing light. Appl Opt 2006; 45: pp. 8360-8365.