
Rationale and Objectives
Detection of a systemic hemodynamic response in patients suffering from allergic asthma after segmental endobronchial allergen challenge using phase-contrast magnetic resonance imaging (MRI).
Materials and Methods
Nine asthma patients and four healthy volunteers were examined using MRI (1.5T) before (0 hour), 6 hours, and 24 hours after segmental allergen challenge. Two-dimensional phase-contrast MRI measurements were performed in the aorta (AO) and in the pulmonary artery (PA). In addition, short-axis balanced steady state free precession cardiac cine MRI was performed. Maximum systolic flow, maximum flow acceleration, acceleration volume, acceleration time, distensibility, ejection fraction, stroke volume, end-systolic/diastolic volume, cardiac mass, heart rate (HR), and cardiac output (CO) were determined. Spirometry and bronchoalveolar lavage were also performed.
Results
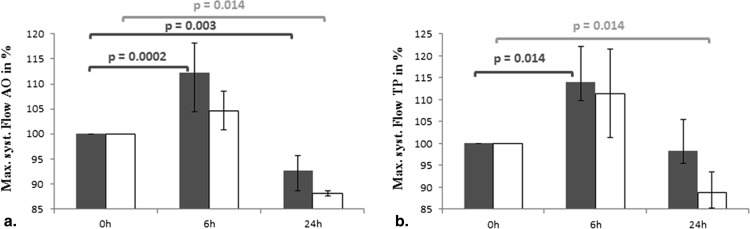
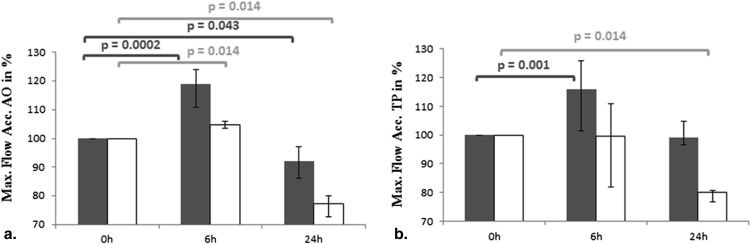
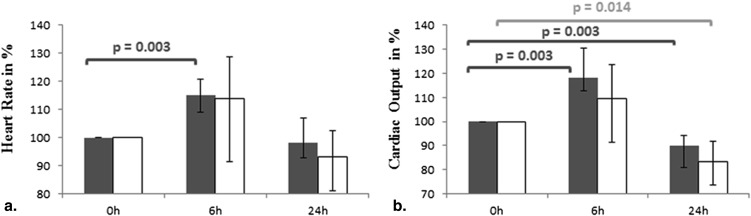
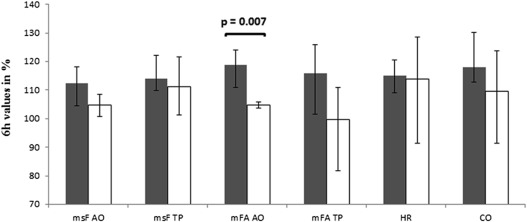
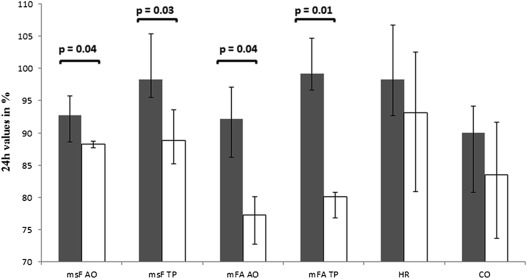
In patients with asthma, maximal systolic flow and maximal flow acceleration increased 6 hours after provocation in the AO (112.3% and 118.9%, respectively) and PA (113.9% and 116.0%, respectively) compared to baseline (100%, P < .05). HR and CO increased significantly at 6 hours (115% and 118%, respectively) compared to baseline (100%, P = .003). In healthy subjects, almost all MRI-derived hemodynamic parameters did not significantly change at 6 hours and were significantly lower than baseline values at 24 hours ( P < .02). Twenty-four hours after allergen challenge, all MRI-derived flow parameters were significantly lower in the control group compared to the asthma group ( P < .05). HR, CO, and cardiac function parameters measured at 24 hours showed no significant difference comparing the two groups ( P > .05).
Conclusions
In asthmatic patients, MRI-derived hemodynamic parameters using phase-contrast MRI are slightly altered after segmental allergen provocation compared to normal controls indicating a mild systemic reaction to local allergen challenge.
Asthma is a serious health hazard affecting 300 million people worldwide with an annual death rate of 250,000 patients . Allergic asthma is a chronic inflammatory disease of the airways caused by an inappropriate immune response to allergen exposure . To date, the pathophysiological mechanism is still incompletely understood.
Segmental allergen challenge is a widely accepted and powerful tool to study mechanisms of airway inflammation and to test the efficacy of anti-inflammatory compounds in early clinical trials . One standard parameter to assess the severity of inflammation and the response to anti-inflammatory drugs is the concentration of eosinophils in the bronchoalveolar lavage (BAL) fluid. Determination of the eosinophilic cell count requires repeated bronchoscopies for induction and read out of the inflammatory response that adds complexity and invasiveness especially to volunteers. Usually segmental allergen challenge involves one to four segments of the lung resulting in a local inflammatory response strictly limited to the challenged segments without any reported relevant systemic hemodynamic side effects . Although both provocation and response after segmental allergen challenge are local, there might be nevertheless a mild systemic hemodynamic response.
Get Radiology Tree app to read full this article<
Material and methods
Patient Population
Get Radiology Tree app to read full this article<
Segmental Allergen Challenge and BAL
Get Radiology Tree app to read full this article<
Get Radiology Tree app to read full this article<
Get Radiology Tree app to read full this article<
Spirometry
Get Radiology Tree app to read full this article<
MRI Protocol
Get Radiology Tree app to read full this article<
Get Radiology Tree app to read full this article<
MR Image Evaluation/Data Analysis
Get Radiology Tree app to read full this article<
Statistical Analysis
Get Radiology Tree app to read full this article<
Results
Segmental Allergen Challenge
Get Radiology Tree app to read full this article<
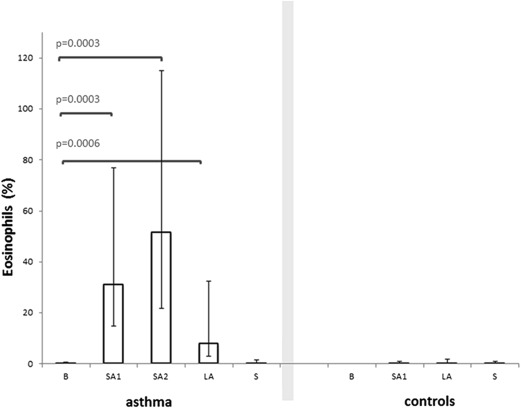
Table 1
Spirometric Parameters at Baseline, 6 hours, and 24 hours after Allergen Challenge
Group 0 hour 6 hours 24 hours_P_ Values Median [25; 75] % Median [25; 75] Baseline (%) Median [25; 75] Baseline (%) Absolute Kruskal–Wallis Relative Kruskal–Wallis Absolute 0 hour Versus 6 hours Relative 0 hour Versus 6 hours Absolute 0 hour Versus 24 hours Relative 0 hour Versus 24 hours Asthma FEV 1 (L) 3.9 [3.5; 4.0] 100 3.4 [2.9; 3.5] 83.1 [82.8; 86.6] 3.3 [3.2; 3.6] 89.7 [87.4; 90.9] ns ns ns ns ns ns FEV 1 predicted (%) 101.4 [92.8; 111] 100 83.7 [77.5; 96] 83.4 [82.8; 86.6] 93.3 [83.7; 98.4] 89.7 [87.3; 98.4] .06 ns — ns — ns FVC (L) 4.7 [4.5; 5.5] 100 4.55 [3.9; 4.6] 90.3 [84.6; 90.9] 4.5 [4.3; 5] 95 [93.8; 95.8] .18 ns — ns — ns FEV 1 /FVC 77.3 [74.6; 83.7] 100 76.2 [72.3; 77.9] 93.8 [92.9; 98.7] 72.3 [70.6; 79.5] 95 [93.1; 96.6] .52 ns — ns — ns Control FEV 1 (L) 4.6 [4.3; 4.9] 100 4.2 [4.0; 4.3] 91.5 [85.9; 97.4] 4.4 [4.2; 4.7] 96.5 [95.6; 96.9] .55 .11 — — — — FEV 1 predicted (%) 115.5 [108.0; 122.8] 100 98.5 [94.6; 105.1] 89.7 [80.9; 97.4] 110.4 [105.6; 113.3] 95 [92.3; 97.1] .25 .11 — — — — FVC (L) 6.1 [5.9; 6.4] 100 5.6 [5.2; 5.9] 88.1 [85.4; 91.9] 6 [5.8; 6.1] 97 [95.6; 97.7] .25 ns — ns — ns FEV 1 /FVC 76.5 [74.2; 77.3] 100 77.8 [75.8; 79.4] 103 [100.8; 105.2] 76.7 [73.7; 78] 100.3 [99.3; 100.8] .69 .3 — — — —
FEV 1 , forced expiratory volume in 1 second; FVC, forced vital capacity; ns, not significant.
Get Radiology Tree app to read full this article<
Magnetic Resonance Imaging
Get Radiology Tree app to read full this article<
Table 2
Phase-contrast MRI
Group 0 hour 6 hours 24 hours_P_ Values Median [25; 75] % Median [25; 75] % of Baseline Median [25; 75] % of Baseline Kruskal–Wallis 0 hour Versus 6 hours 0 hour Versus 24 hours Abs. Rel. Abs. Rel. Abs. Rel. Asthma Heart rate (1/min) 68 [61; 80] 100 79 [78; 92] 115 [109.4; 121.0] 68 [61; 75] 98.3 [89.8; 103.9] .08 ns — ns — .20 MRI Max. systolic flow (mL/s) AO 453.5 [405.5; 504] 100 489 [454.5; 544.8] 112.3 [106.4; 120.2] 418.9 [392.5; 463.5] 92.7 [89.7; 96.8] .10 ns — ns — ns PA 422.7 [408; 482.4] 100 445.8 [425.2; 499] 113.9 [105.6; 118.0] 415.1 [385.7; 464.1] 98.3 [91.2; 101.1] .35 ns — ns — .67 Max. flow acceleration (mL/s 2 ) AO 4671.0 [3910; 4800] 100 5684.9 [4948.3; 5833.3] 118.9 [113.8; 126.9] 4064 [4001.1; 4193.6] 92.2 [87.3; 98.2] ns ns ns ns .20 ns PA 3588.3 [3175.4; 4055] 100 4217.3 [3749.2; 4503.8] 116.0 [106.1; 130.5] 3467.9 [3215.4; 4053.3] 99.2 [93.7; 101.8] .1478 ns — ns — .67 Acceleration volume (mL) AO 23.7 [22; 31.1] 100 27.1 [22.6; 29.2] 107.7 [96.9; 112.8] 24.5 [21.8; 30.1] 97.7 [91.8; 103.4] .87 .32 — — — — PA 33.1 [22; 34.6] 100 33.5 [26.1; 35.5] 102.6 [100; 120.2] 28.6 [22.9; 33] 102.3 [90.9; 105.2] .5 .28 — — — — Acceleration time (ms) AO 100 [100; 100] 100 90 [87.5; 100] 91.6 [90; 100] 100 [100; 110] 100 [100; 110] .23 ns — ns — .13 PA 120 [120; 130] 100 110 [100; 110] 88.9 [84.6; 100] 120 [110; 130] 100 [100; 107.7] .25 .07 — — — — Distensibility AO 25.5 [21.0; 36.4] 100 31.8 [16.3; 42.5] 112.9 [110.3; 117] 34.1 [22.5; 39.7] 113.6 [100.8; 142.0] .80 .06 — — — — PA 27 [18.0; 45.8] 100 40.6 [33.7; 51.1] 106.2 [93.1; 125.0] 25 [21.7; 44.4] 108.1 [94.4; 113.9] .93 .89 — — — — Cardiac output (mL/min) 6.6 [5.3; 7.1] 100 7.3 [7; 7.7] 118.1 [105.9; 123.4] 5.7 [5.2; 6.2] 90 [85.8; 99.2] ns ns .07 ns .09 ns Control Heart rate (1/min) 58 [55; 67] 100 78 [65; 89] 114 [99.3; 136.7] 60 [55; 65] 93.1 [83.6; 105.3] .31 .3 — — — — MRI Max. systolic flow (mL/s) AO 551.1 [538.1; 563.8] 100 559.4 [541.6; 592.8] 104.7 [100.9; 108.5] 488.4 [478.9; 495.5] 88.2 [87.7; 88.7] ns ns .56 .22 ns ns PA 496.9 [461.2; 540.8] 100 579.6 [525.4; 611.2] 111.3 [101.0; 121.3] 440.4 [426.2; 453.7] 88.8 [84.0; 92.4] .09.03 — .22 —.014 Max. flow acceleration (mL/s 2 ) AO 5510.5 [5380.8; 5637.5] 100 5797.1 [5675; 5876.3] 104.7 [103.5; 105.8] 4254.3 [3999; 4613] 77.2 [74.3; 81.7] ns ns .39 ns ns ns PA 3809.1 [3483.1; 4159.8] 100 4140 [3753.0; 4365.4] 99.6 [88.2; 117.3] 3048.2 [2895.6; 3305.1] 80.1 [79.5; 83.4] .12 ns — ns — ns Acceleration volume (mL) AO 31.5 [30.6; 32.2] 100 31.2 [29.9; 32.5] 100.7 [97.4; 103.4] 30.1 [29.8; 30.5] 97.8 [94.9; 99.7] .54 .48 — — — — PA 44.9 [40.9; 49] 100 47.8 [45.6; 48.9] 106.3 [100.1; 110.8] 38.2 [37.2; 39.6] 84.5 [80.7; 90.3] ns ns .56 .22 .083 ns Acceleration time (ms) AO 104.4 [104.2; 106.8] 100 125.2 [111.5; 134.1] 115.3 [100; 128.5] 119 [109.5; 123.8] 109.4 [98.1; 118.7] .09 .09 — — — — PA 140.5 [136.3; 145.1] 100 135.9 [128.6; 140.9] 92.7 [87.5; 100.4] 143.6 [136.9; 145.7] 98.8 [93.9; 103.5] .39 .34 — — — — Distensibility AO 21.1 [17.3; 29.0] 100 28.7 [18.2; 40.4] 113.1 [99.3; 139.9] 29.9 [23.3; 35.4] 118.4 [88.8; 159.5] .94 .77 — — — — PA 20.5 [17.3; 25.4] 100 23.6 [12.3; 32.8] 99.1 [42.2; 159] 19.7 [16.7; 22.4] 89.7 [82.3; 98.0] .84 .73 — — — — Cardiac output (L/min) 7.4 [6.5; 8.0] 100 7.4 [6.7; 8.6] 109.6 [95.4; 127.9] 6.1 [5.8; 6.2] 83.5 [75.3; 93.4] .12 ns — .22 — ns
AO, aorta; Abs., absolute; MRI, magnetic resonance imaging; ns, not significant; PA, pulmonary artery; Rel., relative.
Get Radiology Tree app to read full this article<
Get Radiology Tree app to read full this article<
Get Radiology Tree app to read full this article<
Get Radiology Tree app to read full this article<
Get Radiology Tree app to read full this article<
Get Radiology Tree app to read full this article<
Get Radiology Tree app to read full this article<
Discussion
Get Radiology Tree app to read full this article<
Get Radiology Tree app to read full this article<
Get Radiology Tree app to read full this article<
Get Radiology Tree app to read full this article<
Get Radiology Tree app to read full this article<
Get Radiology Tree app to read full this article<
References
1. Olaguibel J.M., Quirce S., Juliá B., et. al.: Measurement of asthma control according to global initiative for asthma guidelines: a comparison with the asthma control questionnaire. Respir Res 2012; 13: pp. 50.
2. Bousquet J., Dahl R., Khaltaev N.: Global alliance against chronic respiratory diseases. Eur Respir J 2007; 29: pp. 233-239.
3. Bateman E.D., Hurd S.S., Barnes P.J., et. al.: Global strategy for asthma management and prevention: GINA executive summary. European Respiratory Journal 2008; 31: pp. 143-178.
4. Masoli M., Fabian D., Holt S., et. al., Global Initiative for Asthma (GINA) Program: The global burden of asthma: executive summary of the GINA Dissemination Committee report. Allergy 2004; 59: pp. 469-478.
5. Erpenbeck V.J., Hagenberg A., Dulkys Y., et. al.: Natural porcine surfactant augments airway inflammation after allergen challenge in patients with asthma. Am J Respir Crit Care Med 2004; 169: pp. 578-586.
6. Atochina-Vasserman E.N., Winkler C., Abramova H., et. al.: Segmental allergen challenge alters multimeric structure and function of surfactant protein D in humans. Am J Respir Crit Care Med 2011; 183: pp. 856-864.
7. Krug N., Teran L.M., Redington A.E., et. al.: Safety aspects of local endobronchial allergen challenge in asthmatic patients. Am J Respir Crit Care Med 1996; 153: pp. 1391-1397.
8. Julius P., Lommatzsch M., Kuepper M., et. al.: Safety of segmental allergen challenge in human allergic asthma. Journal of Allergy and Clinical Immunology 2008; 121: pp. 712-717.
9. Denlinger L.C., Kelly E.A.B., Dodge A.M., et. al.: Safety of and cellular response to segmental bronchoprovocation in allergic asthma. PLoS ONE Public Library of Science 2013; 8: pp. e51963.
10. Giesbrandt K.J., Bolan C.W., Shapiro B.P., et. al.: Diffuse diseases of the myocardium: MRI-pathologic review of nondilated cardiomyopathies. AJR Am J Roentgenol 2013; 200: pp. W266-W273.
11. Gunaratnam K., Wong L.H., Nasis A., et. al.: Review of cardiomyopathy imaging. Eur J Radiol 2013; 82: pp. 1763-1775.
12. Wielpütz M., Kauczor H.-U.: MRI of the lung: state of the art. Diagn Interv Radiol 2012; 18: pp. 344-353.
13. Biederer J., Mirsadraee S., Beer M., et. al.: MRI of the lung (3/3)-current applications and future perspectives. Insights Imaging 2012; 3: pp. 373-386.
14. Bauman G., Eichinger M.: Ventilation and perfusion magnetic resonance imaging of the lung. Pol J Radiol 2012; 77: pp. 37-46.
15. Hopkins S.R., Wielpütz M.O., Kauczor H.-U.: Imaging lung perfusion. J Appl Physiol 2012; 113: pp. 328-339.
16. Kreitner K.-F., Wirth G.M., Krummenauer F., et. al.: Noninvasive assessment of pulmonary hemodynamics in patients with chronic thromboembolic pulmonary hypertension by high temporal resolution phase-contrast MRI: correlation with simultaneous invasive pressure recordings. Circ Cardiovasc Imaging 2013; 6: pp. 722-729.
17. Sanz J., Kuschnir P., Rius T., et. al.: Pulmonary arterial hypertension: noninvasive detection with phase-contrast MR imaging. Radiology 2007; 243: pp. 70-79.
18. Erpenbeck V.J., Schmidt R., Gunther A., et. al.: Surfactant protein levels in bronchoalveolar lavage after segmental allergen challenge in patients with asthma. Allergy 2006; 61: pp. 598-604.
19. Miller M.R., Hankinson J., Brusasco V., et. al.: Standardisation of spirometry. Eur Respir J 2005; 26: pp. 319-338.
20. Plathow C., Ley S., Zaporozhan J., et. al.: Assessment of reproducibility and stability of different breath-hold maneuvres by dynamic MRI: comparison between healthy adults and patients with pulmonary hypertension. Eur Radiol 2006; 16: pp. 173-179.
21. Fink C., Ley S., Risse F., et. al.: Effect of inspiratory and expiratory breathhold on pulmonary perfusion: assessment by pulmonary perfusion magnetic resonance imaging. Invest Radiol 2005; 40: pp. 72-79.
22. Klok F.A., Romeih S., Westenberg J.J., et. al.: Pulmonary flow profile and distensibility following acute pulmonary embolism. J Cardiovasc Magn Reson 2011; 13: pp. 14.
23. Giles J.T., Malayeri A.A., Fernandes V., et. al.: Left ventricular structure and function in patients with rheumatoid arthritis, as assessed by cardiac magnetic resonance imaging. Arthritis Rheum 2010; 62: pp. 940-951.
24. Lotz J., Meier C., Leppert A., et. al.: Cardiovascular flow measurement with phase-contrast MR imaging: basic facts and implementation. Radiographics 2002; 22: pp. 651-671.
25. Ley S., Unterhinninghofen R., Ley-Zaporozhan J., et. al.: Validation of magnetic resonance phase-contrast flow measurements in the main pulmonary artery and aorta using perivascular ultrasound in a large animal model. Invest Radiol 2008; 43: pp. 421-426.
26. Abolmaali N., Seitz U., Esmaeili A., et. al.: Evaluation of a resistance-based model for the quantification of pulmonary arterial hypertension using MR flow measurements. J Magn Reson Imaging 2007; 26: pp. 646-653.
27. Weber T.F., Tengg-Kobligk von H., Kopp-Schneider A., et. al.: High-resolution phase-contrast MRI of aortic and pulmonary blood flow during rest and physical exercise using a MRI compatible bicycle ergometer. Eur J Radiol 2011; 80: pp. 103-108.
28. Hedlin G., Freyschuss U.: Cardiac output and blood pressure in asthmatic children before and during induced asthma. Acta Paediatr Scand 1984; 73: pp. 441-447.
29. Grieco M.H., Pierson R.N.: Cardiopulmonary effects of methacholine in asthmatic and normal subjects. Journal of Allergy 1970; 45: pp. 195-207.
30. Bremner P., Woodman K., Burgess C., et. al.: A comparison of the cardiovascular and metabolic effects of formoterol, salbutamol and fenoterol. European Respiratory Journal 1993; 6: pp. 204-210.