
Rationale and Objectives
Meaningfully measuring physician outcomes and resource utilization requires appropriate patient risk adjustment. We aimed to assess Medicare patient complexity by physician specialty and to further identify radiologist characteristics associated with higher patient complexity.
Materials and Methods
The average beneficiary Hierarchical Condition Category (HCC) risk scores (Medicare’s preferred measure of clinical complexity) were identified for all physicians using 2014 Medicare claims data. HCC scores were compared among physician specialties and further stratified for radiologists based on a range of characteristics. Univariable and multivariable analyses were performed.
Results
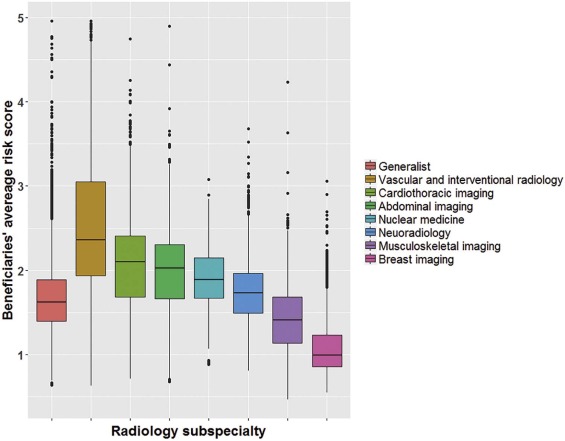
Of 549,194 physicians across 54 specialties, the mean HCC risk score was 1.62 ± 0.75. Of the 54 specialties, interventional radiology ranked 4th (2.60 ± 1.29), nuclear medicine ranked 16th (1.87 ± 0.45), and diagnostic radiology ranked 21st (1.75 ± 0.61). Among 31,175 radiologists, risk scores were higher ( P < 0.001) for those with teaching (2.03 ± 0.74) vs nonteaching affiliations (1.72 ± 0.61), practice size ≥100 (1.94 ± 0.70) vs ≤9 (1.59 ± 0.79) members, urban (1.79 ± 0.69) vs rural (1.67 ± 0.59) practices, and subspecialized (1.85 ± 0.81) vs generalized (1.68 ± 0.42) practice patterns. Among noninterventional radiology subspecialties, patient complexity was highest for cardiothoracic (2.09 ± 0.57) and lowest for breast (1.08 ± 0.32) imagers. At multivariable analysis, a teaching affiliation was the strongest independent predictor of patient complexity for both interventional (β = +0.23, P = 0.005) and noninterventional radiologists (β = +0.21, P < 0.001).
Conclusions
Radiologists on average serve more clinically complex Medicare patients than most physicians nationally. However, patient complexity varies considerably among radiologists and is particularly high for those with teaching affiliations and interventional radiologists. With patient complexity increasingly recognized as a central predictor of clinical outcomes and resource utilization, ongoing insights into complexity measures may assist radiologists navigating emerging risk-based payment models.
Introduction
Currently, most physician payments are determined on a fee-for-service basis and do not consider either the quality of services rendered or the complexity of patients served. Under the Medicare Access and CHIP Reauthorization Act (MACRA) , however, payments will become increasingly value based. Most Medicare participating physicians, whether in a community or academic setting, will soon be paid under the Merit-based Incentive Payment Service (MIPS), a modified fee-for-service system in which payments will undergo a positive, neutral, or negative adjustment based on a composite performance score determined from a wide range of metrics and compared against national performance levels .
To ensure the success of MACRA, the Centers for Medicare & Medicaid Services (CMS) seeks to recognize variation in physicians’ practices in determining value-based payment adjustments . One important source of such variation is the complexity of physicians’ unique patient populations. Physicians caring for sicker patients, as may be anticipated among university and other tertiary care centers, will be challenged in obtaining the same clinical outcomes and resource utilization as those caring for healthier patients. Risk adjustment of performance scores aims to account for such variation , and CMS has accordingly adopted risk adjustment as a prominent recurring theme throughout its implementation of MACRA , focusing particularly on the Hierarchical Condition Category (HCC) risk adjustment methodology widely applied in other CMS programs. In the Quality performance category of MACRA, for example, all outcome measures generally have risk adjustment embedded in the measure calculation. For non-MIPS Quality measures that are submitted through a qualified clinical data registry, the qualified clinical data registry must provide CMS with a plan for risk adjustment of measures, if appropriate . Moreover, all measures in the Cost performance category of MACRA specifically entail risk adjustment, which will be performed by CMS .
Get Radiology Tree app to read full this article<
Methods
Get Radiology Tree app to read full this article<
Get Radiology Tree app to read full this article<
Get Radiology Tree app to read full this article<
Get Radiology Tree app to read full this article<
Get Radiology Tree app to read full this article<
Results
Get Radiology Tree app to read full this article<
TABLE 1
Average Risk Score (Determined Using the Hierarchical Condition Category Model) of Physicians’ Covered Medicare Fee-for-Service Beneficiaries, Stratified by Medicare Physician Specialty Designations
Specialty_n_ Mean ± SDAll physicians549,1941.62 ± 0.75 Nephrology 7,790 4.20 ± 1.30 Infectious disease 5,049 2.93 ± 0.70 Hospice and palliative care 560 2.80 ± 0.53Interventional radiology1,1992.60 ± 1.29 Critical care 2,457 2.52 ± 0.66 Vascular surgery 2,814 2.52 ± 1.04 Hematology 704 2.29 ± 0.57 Pulmonary disease 9,025 2.19 ± 0.60 Hematology and oncology 7,542 2.04 ± 0.44 Medical oncology 2,755 2.02 ± 0.46 Thoracic surgery 1,960 1.99 ± 0.67 Emergency medicine 39,051 1.93 ± 0.47 Cardiac surgery 1,507 1.90 ± 0.58 Geriatric medicine 1,765 1.87 ± 0.53 Cardiac electrophysiology 1,474 1.87 ± 0.32Nuclear medicine5221.87 ± 0.45 General surgery 19,251 1.86 ± 1.01 Cardiology 22,095 1.81 ± 0.44 Internal medicine 94,151 1.77 ± 0.76 Pediatric medicine 1,841 1.77 ± 1.23Diagnostic radiology28,3801.75 ± 0.61 Geriatric psychiatry 165 1.64 ± 0.49 Anesthesiology 35,619 1.64 ± 0.56 Pathology 11,221 1.63 ± 0.57 Radiation oncology 4,219 1.62 ± 0.32 Neurology 12,876 1.61 ± 0.47 Endocrinology 5,050 1.59 ± 0.49 Physical medicine and rehabilitation 7,265 1.59 ± 0.57 Gastroenterology 12,311 1.58 ± 0.49 Addiction medicine 121 1.49 ± 0.36 Plastic and reconstructive surgery 4,337 1.47 ± 0.64 Surgical oncology 775 1.44 ± 0.48 Pain management 1,535 1.42 ± 0.37 Gynecology and oncology 893 1.42 ± 0.33 Neuropsychiatry 106 1.42 ± 0.47 Neurosurgery 4,319 1.40 ± 0.34 Psychiatry 21,764 1.40 ± 0.43 Interventional pain management 1,789 1.40 ± 0.40 Colorectal surgery 1,276 1.39 ± 0.33 Urology 8,679 1.39 ± 0.42 Preventive medicine 329 1.38 ± 0.75 General practice 5,916 1.37 ± 0.61 Rheumatology 4,180 1.36 ± 0.29 Sleep medicine 178 1.35 ± 0.37 Otolaryngology 8,467 1.26 ± 0.30 Family practice 79,368 1.24 ± 0.45 Osteopathic manipulative medicine 592 1.23 ± 0.51 Orthopedic surgery 20,566 1.21 ± 0.31 Maxillofacial surgery 965 1.19 ± 0.36 Hand surgery 1,216 1.13 ± 0.24 Sports medicine 622 1.09 ± 0.28 Dermatology 10,679 1.03 ± 0.22 Allergy and immunology 3,201 0.98 ± 0.26 Obstetrics and gynecology 26,703 0.96 ± 0.30
SD, standard deviation.
Boldface indicates radiology specialties.
Get Radiology Tree app to read full this article<
Get Radiology Tree app to read full this article<
TABLE 2
Association of Hierarchical Condition Category Risk Scores with Radiologist Characteristics
Cohort_n_ \* Mean ± SD All radiologists 31,175 1.79 ± 0.67 Gender ( P < 0.001) Female 6,890 1.68 ± 0.68 Male 24,285 1.82 ± 0.66 Years in practice ( P < 0.001) ≤9 3.826 1.89 ± 0.62 10–24 13,159 1.82 ± 0.67 ≥25 11,396 1.72 ± 0.65 Rurality ( P < 0.001) Urban 27,677 1.79 ± 0.67 Rural 1,255 1.67 ± 0.59 Subspecialization by distribution of work relative value units ( P < 0.001) Majority generalist 15,515 1.68 ± 0.42 Majority subspecialist ( P < 0.001) 12,224 1.85 ± 0.81 Vascular and interventional radiology 2,030 2.69 ± 1.23 Cardiothoracic imaging 1,570 2.09 ± 0.57 Abdominal imaging 2,138 1.99 ± 0.51 Nuclear medicine 453 1.90 ± 0.37 Neuroradiology 2,843 1.74 ± 0.38 Musculoskeletal imaging 997 1.44 ± 0.39 Breast imaging 2,193 1.08 ± 0.32 Group practice size ( P < 0.001) ≤9 4,282 1.59 ± 0.79 10–49 11,100 1.74 ± 0.55 50–99 3,730 1.80 ± 0.58 ≥100 9,223 1.94 ± 0.70 Geographic region ( P < 0.001) South 10,289 1.82 ± 0.68 Northeast 7,157 1.80 ± 0.69 West 6,495 1.77 ± 0.67 Midwest 7,007 1.76 ± 0.62 Teaching status ( P < 0.001) Nonteaching 19.702 1.72 ± 0.61 Teaching 4,780 2.03 ± 0.74
SD, standard deviation.
Get Radiology Tree app to read full this article<

Get Radiology Tree app to read full this article<
Get Radiology Tree app to read full this article<
Get Radiology Tree app to read full this article<
Get Radiology Tree app to read full this article<
TABLE 3
Independent Predictors of Hierarchical Condition Category Risk Score for Noninterventional Radiologists, Based on Multivariable Regression, Ranked in Order of Decreasing Strength of the Regression Coefficient β
Measure Criterion β_P_ Teaching status Teaching +0.21<0.001 Rurality Urban +0.17<0.001 Gender Male +0.15<0.001 Group practice size ≥100 +0.13<0.001 Years in practice ≤9 +0.05<0.001 Subspecialization Subspecialized −0.05<0.001
Boldfaced when statistically significant at p < 0.05.
TABLE 4
Independent Predictors of Risk score for Interventional Radiologists, Based on Multivariable Regression, Ranked in Order of Decreasing Strength of the Regression Coefficient β
Measure Criterion β_P_ Teaching status Teaching +0.230.005 Rurality Urban +0.17 0.315 Group practice size ≥100 +0.160.033 Years in practice ≤9 +0.05 0.662 Gender Male −0.12 0.662
Boldfaced when statistically significant at p < 0.05.
Get Radiology Tree app to read full this article<
Discussion
Get Radiology Tree app to read full this article<
Get Radiology Tree app to read full this article<
Get Radiology Tree app to read full this article<
Get Radiology Tree app to read full this article<
Get Radiology Tree app to read full this article<
Get Radiology Tree app to read full this article<
Get Radiology Tree app to read full this article<
References
1. 114th U.S. Congress : H.R.2—Medicare access and CHIP Reauthorization Act of 2015. Available at: https://www.congress.gov/bill/114th-congress/house-bill/2
2. Centers for Medicare & Medicaid Services : Medicare program; Merit-Based Incentive Payment System (MIPS) and Alternative Payment Model (APM) Incentive Under the Physician Fee Schedule, and Criteria for Physician-Focused Payment Models. Available at: https://www.gpo.gov/fdsys/pkg/FR-2016-11-04/pdf/2016-25240.pdf
3. Federal Register : Medicare Program; Revisions to Payment Policies Under the Physician Fee Schedule, DME Face-to-Face Encounters, Elimination of the Requirement for Termination of Non-Random Prepayment Complex Medical Review and Other Revisions to Part B for CY 2013. No. 222. Vol. 77; 69317–69318; Available at: https://www.gpo.gov/fdsys/pkg/FR-2012-11-16/pdf/2012-26900.pdf
4. Rosenkrantz A.B., Schoppe K.A., Duszak R.: Temporal and patient variations potentially impacting new payment models. J Am Coll Radiol 2017; 14: pp. 452-458.
5. Lin P.J., Maciejewski M.L., Paul J.E., et. al.: Risk adjustment for Medicare beneficiaries with Alzheimer’s disease and related dementias. Am J Manag Care 2010; 16: pp. 191-198.
6. Centers for Medicare & Medicaid Services : Evaluation of the CMS-HCC risk adjustment model. Available at: https://www.cms.gov/Medicare/Health-Plans/MedicareAdvtgSpecRateStats/downloads/evaluation_risk_adj_model_2011.pdf
7. Centers for Medicare & Medicaid Services : Payment standardization and risk adjustment for the Medicare physician feedback and value modifier programs. Available at: https://www.cms.gov/Medicare/Medicare-Fee-for-Service-Payment/PhysicianFeedbackProgram/Downloads/122111_Slide_Presentation.pdf
8. Centers for Medicare & Medicaid Services : Medicare fee-for-service provider utilization & payment data physician and other supplier public use file: a methodological overview. Available at: https://www.cms.gov/Research-Statistics-Data-and-Systems/Statistics-Trends-and-Reports/Medicare-Provider-Charge-Data/Downloads/Medicare-Physician-and-Other-Supplier-PUF-Methodology.pdf
9. Li P., Kim M.M., Doshi J.A.: Comparison of the performance of the CMS Hierarchical Condition Category (CMS-HCC) risk adjuster with the Charlson and Elixhauser comorbidity measures in predicting mortality. BMC Health Serv Res 2010; 10: pp. 245.
10. Missouri Census Data Center : Metadata for dataset /pub/data/georef/zcta_master. Available at: http://mcdc.missouri.edu/data/georef/zcta_master.Metadata.html
11. Centers for Medicare & Medicaid Services : Phsyician compare. Available at: https://www.medicare.gov/physiciancompare/
12. Accreditation Council for Graduate Medical Education (ACGME) : Accredited programs and sponsoring institutions. ACGME website; Available at: www.acgme.org/acgmeweb/tabid/172/GraduateMedicalEducation/AccreditedProgramsandSponsoringInstitutions.aspx
13. Vijayasarathi A., Loehfelm T., Duszak R., et. al.: Journal club: radiologists’ online identities: what patients find when they search radiologists by name. AJR Am J Roentgenol 2016; 207: pp. 952-958.
14. Rosenkrantz A.B., Wang W., Hughes D.R., et. al.: Academic radiologist subspecialty identification using a novel claims-based classification system. AJR Am J Roentgenol 2017; 208: pp. 1249-1255.
15. Rosenkrantz A.B., Wang W., Bodapati S., et. al.: Private practice radiologist subspecialty classification using Medicare claims. J Am Coll Radiol 2017; Jun 30; Epub ahead of print
16. Neiman H.L., Health Policy Institute: Neiman imaging types of service. Available at: http://www.neimanhpi.org/neiman-imaging-types-of-service-nitos/
17. OpenHeatMap : Available at: www.openheatmap.com
18. Rosenkrantz A.B., Nicola G.N., Allen B., et. al.: MACRA, alternative payment models, and the physician-focused payment model: implications for radiology. J Am Coll Radiol 2017; 14: pp. 744-751.
19. Rosenkrantz A.B., Hirsch J.A., Allen B., et. al.: Identifying radiology’s place in the expanding landscape of episode payment models. J Am Coll Radiol 2017; 14: pp. 882-888.
20. Newhouse J.P., Wilensknagtay G.R.: Paying for graduate medical education: the debate goes on. Health Aff (Millwood) 2001; 20: pp. 136-147.
21. Rich E.C., Liebow M., Srinivasan M., et. al.: Medicare financing of graduate medical education. J Gen Intern Med 2002; 17: pp. 283-292.
22. Rosenkrantz A.B., Wang W., Duszak R.: The ongoing gap in availability of imaging services at teaching versus nonteaching hospitals. Acad Radiol 2016; 23: pp. 1057-1063.
23. Fleishon H.B., Itri J.N., Boland G.W., et. al.: Academic medical centers and community hospitals integration: trends and strategies. J Am Coll Radiol 2017; 14: pp. 45-51.
24. Bai G., Anderson G.F.: Variation in the ratio of physician charges to Medicare payments by specialty and region. JAMA 2017; 317: pp. 315-318.
25. Centers for Medicare & Medicaid Services : Proposed changes to the CMS-HCC risk adjustment model for payment year 2017. Available at: https://www.cms.gov/Medicare/Health-Plans/MedicareAdvtgSpecRateStats/Downloads/RiskAdj2017ProposedChanges.pdf
26. Sorace J., Wong H.H., Worrall C., et. al.: The complexity of disease combinations in the Medicare population. Popul Health Manag 2011; 14: pp. 161-166.
27. Chang E., Ruder T., Setodji C., et. al.: Differences in nursing home quality between Medicare advantage and traditional Medicare patients. J Am Med Dir Assoc 2016; 17: 960.e969–960.e914
28. Kronick R., Welch W.P.: Measuring coding intensity in the Medicare advantage program. Medicare Medicaid Res Rev 2014; 4: