
Rationale and Objectives
To evaluate the clinical utility of three-dimensional (3D) computed tomography (CT) for predicting pleural invasion by peripheral lung cancer.
Materials and Methods
CT findings (tumor size, vertical diameter, length and area of the interface between tumor and the pleura, ratios of length and area [R area ] of interface between tumor and the pleura to tumor size, angle between the tumor and adjacent pleura, presence or absence of pleural thickening, and originally developed 3D pleural patterns) in 201 consecutive patients with lung cancer of ≤3 cm in contact with pleural surface were correlated with pathologic findings. Logistic modeling was used for determining the significant factors for prediction of pleural invasion, and receiver operating characteristic (ROC) curves were used for investigating diagnostic capability of significant factors, resulting in a recommendation to the optimal criteria for predicting pleural invasion and to the optimal threshold for differentiating parietal from visceral invasion.
Results
Sixty-one (30%) of the 201 patients had pathologically verified pleural invasion. Logistic modeling revealed that the 3D pleural pattern was the only significant factor ( P < .001; relative risk of 7.34). Among every combination of the 3D patterns, skirt-like pattern showed the highest accuracy of 77% for predicting pleural invasion. In differentiating parietal from visceral pleural invasion, ROC analysis revealed that R area was optimal for differentiating parietal from visceral pleural invasion, and the highest accuracy of 77% was obtained with a cut-off value of 13.4 for this criterion.
Conclusions
Computer-aided 3D CT analysis of the pleura was useful for predicting pleural invasion.
The anatomic extent of disease as expressed by the tumor, node, and metastasis staging system is the most important prognostic factor for lung cancer. Presence of visceral pleural invasion by lung cancer increases T staging from T1 to T2, and the presence of parietal pleural invasion upstages it from T2 to T3, when the tumor is <3 cm in size . Therefore, prognosis of patients with T1-sized (≤3 cm) lung cancer depends on the presence or absence of pleural invasion and the depth of invasion of the pleura . Five-year survival rates are reported to worsen from 86% (for patients with no pleural invasion) to 62%–70% (for patients with visceral pleural invasion) and then to 57% (for patients with parietal pleural invasion) for non–small cell lung cancer (NSCLC) .
Computed tomography (CT) is currently the imaging method of choice in staging of lung cancer. However, a well-known limitation of conventional CT is the diagnosis of pleural invasion by peripheral lung cancer. Sensitivity in diagnosing invasion of the parietal pleura or chest wall based on two-dimensional (2D) CT is reported to range from 38% to 89.7% and specificity from 40% to 96% . However, the visceral pleural invasion is difficult to diagnose with CT and has not been assessed in detail, especially in patients with T1-sized lung cancer. Thin-section spiral CT allows continuous data collection and provides uninterrupted volume data that can be reconstructed to produce three-dimensional (3D) images, which have been reported to be superior to 2D CT in the assessment of pleural invasion by lung cancer .
Get Radiology Tree app to read full this article<
Materials and methods
Get Radiology Tree app to read full this article<
Patients
Get Radiology Tree app to read full this article<
Thin-Section CT
Get Radiology Tree app to read full this article<
Get Radiology Tree app to read full this article<
Get Radiology Tree app to read full this article<
Get Radiology Tree app to read full this article<
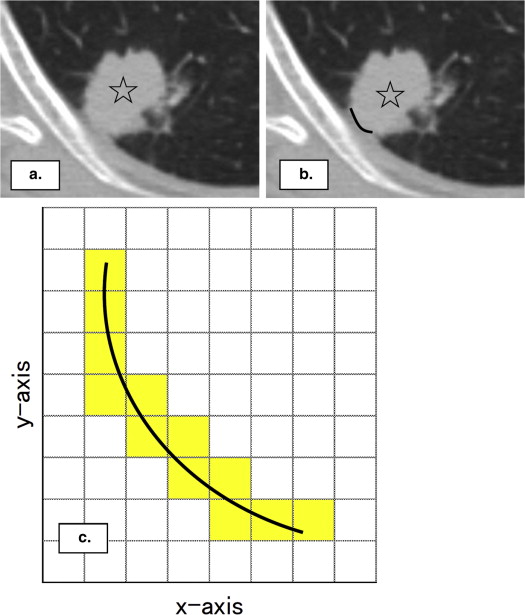
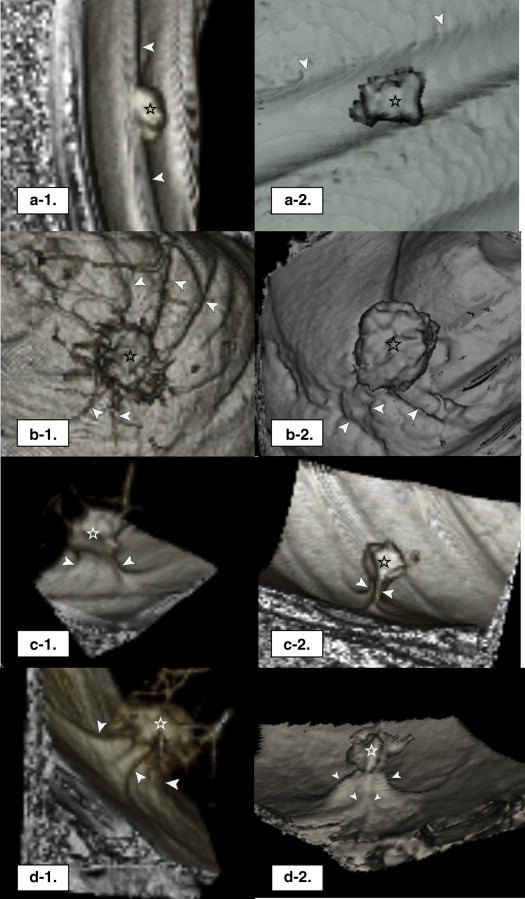
Pleural Patterns on 3D CT
Get Radiology Tree app to read full this article<
Get Radiology Tree app to read full this article<
Pathology
Get Radiology Tree app to read full this article<
Statistical Analysis
Get Radiology Tree app to read full this article<
Results
Get Radiology Tree app to read full this article<
Table 1
Clinicopathologic Features of 201 Patients with Lung Cancer
Clinicopathologic Features Data Patient number 201 Gender (men/women) 126/75 Age, mean ± SD (years) 66.7 ± 9.3 Tumor size, mean ± SD (range) (cm) 1.9 ± 0.6 (0.5–2.7) Tumor histology Adenocarcinoma 161 Squamous cell carcinoma 35 Others 5 Tumor (T stage) T1 140 T2 52 T3 9 Node (N stage) N0 156 N1 17 N2 28 Grade of pleural invasion PL 0 140 PL 1 38 PL 2 14 PL 3 9
PL 0, lack of pleural invasion beyond the elastic layer; PL 1, pleural invasion beyond the elastic layer; PL 2, pleural invasion to the pleural surface; PL 3, pleural invasion into any component of the parietal pleura; SD, standard deviation.
Get Radiology Tree app to read full this article<
Pleural Invasion
Get Radiology Tree app to read full this article<
Table 2
Comparison of Clinicopathologic Features and CT Findings in 201 Patients with Lung Cancer with and without Pleural Invasion
Clinicopathologic Features Pleural Absence (PL 0) Invasion Presence (PL 1–3)P Value Patient number 140 61 Gender, n (%) .017 Men ( n = 126) 80 (57) 46 (75) Women ( n = 75) 60 (43) 15 (25) Age, mean ± SD (years) 65.9 ± 9.5 68.5 ± 8.7 .061 Tumor histology, n (%) .842 Adenocarcinoma ( n = 161) 111 (79) 50 (82) Squamous cell carcinoma ( n = 35) 25 (18) 10 (16) Others ( n = 5) 4 (3) 1 (2) CT imaging findings Tumor size, mean ± SD (mm) 14.3 ± 4.9 16.7 ± 4.2 .001 Vertical diameter, mean ± SD (mm) 9.1 ± 7.9 11.9 ± 10.3 .063 Interface, mean ± SD Length (mm) 12.0 ± 7.7 15.4 ± 6.8 .003 Area (mm 2 ) 149.8 ± 184.3 196.9 ± 161.3 .064 Ratio, mean ± SD Length/tumor size 0.8 ± 0.3 0.9 ± 0.3 .064 Area/tumor size 9.5 ± 8.6 11.4 ± 7.7 .144 Angle, n (%) .062 Acute ( n = 144) 106 (76) 38 (62) Obtuse ( n = 57) 34 (24) 23 (38) Pleural thickening ( n = 86), n (%) 62 (44) 24 (39) .539 3D CT pleural patterns, n (%) <.001 Flat ( n = 81) 71 (51) 10 (16) Waving ( n = 33) 19 (13) 14 (23) Rectangular solid ( n = 30) 29 (21) 1 (2) Skirt like ( n = 57) 21 (15) 36 (59)
CT, computed tomography; 3D, three dimensional; PL 0, absence of pleural invasion; PL 1, visceral pleural invasion without reaching visceral pleural surface; PL 2, visceral pleural invasion reaching visceral pleural surface; PL 3, parietal pleural invasion.
Table 3
Diagnostic Statistics of CT Findings for Predicting Pleural Invasion
Predictors Sensitivity, % Specificity, % Accuracy, % PPV, % NPV, % CT imaging measurements Tumor size, mm ≥8.2 100 5 34 31 100 ≥19.4 33 87 71 53 75 Length of interface, mm ≥4.1 100 9 36 32 100 ≥17.6 36 86 71 52 76 3D CT pleural patterns Flat pattern 84 51 61 43 88 Rectangular solid pattern 98 21 44 35 97 Waving pattern 23 86 67 42 72 Skirt-like pattern 59 85 77 63 83 Skirt-like or waving pattern 82 71 75 56 90 Skirt-like or flat pattern 75 34 48 33 76 Skirt-like or rectangular solid pattern 61 64 63 43 79
CT, computed tomography; 3D, three dimensional; NPV, negative predictive value; PPV, positive predictive value.
Get Radiology Tree app to read full this article<
Get Radiology Tree app to read full this article<
Table 4
Comparison of Clinicopathologic Features and CT Findings Between 52 Patients with Visceral Pleural Invasion and Nine Patients with Parietal Pleural Invasion
Features Visceral Pleural Invasion (PL 1–2) Parietal Pleural Invasion (PL 3)P Value Patient number 52 9 Gender, n (%) .676 Men ( n = 46) 40 (77) 6 (67) Women ( n = 15) 12 (23) 3 (33) Age, mean ± SD (years) 68.3 ± 8.6 70.2 ± 9.7 .536 Tumor histology, n (%) .313 Adenocarcinoma ( n = 50) 41 (79) 9 (100) Squamous cell carcinoma ( n = 10) 10 (19) 0 (0) Other ( n = 1) 1 (2) 0 (0) Findings on CT images Tumor size, mean ± SD (mm) 16.8 ± 4.3 16.3 ± 3.3 .755 Vertical diameter, mean ± SD (mm) 10.8 ± 8.7 11.8 ± 9.9 .521 Interface, mean ± SD Length (mm) 15.1 ± 7.0 17.3 ± 5.4 .365 Area (mm 2 ) 180.1 ± 163.0 294.2 ± 115.5 .049 Ratio, mean ± SD Length/tumor size 0.9 ± 0.3 1.1 ± 0.3 .139 Area/tumor size 10.3 ± 7.6 17.9 ± 4.8 .005 Angle, n (%) .278 Acute ( n = 38) 34 (65) 4 (44) Obtuse ( n = 23) 18 (35) 5 (56) Pleural thickening ( n = 24), n (%) 20 (38) 4 (44) .729 3D CT pleural patterns, n (%) .474 Flat ( n = 10) 10 (19) 0 (0) Waving ( n = 14) 11 (21) 3 (33) Rectangular solid ( n = 1) 1 (2) 0 (0) Skirt like ( n = 36) 30 (58) 6 (67)
CT, computed tomography; 3D, three dimensional; PL 1, visceral pleural invasion without reaching visceral pleural surface; PL 2, visceral pleural invasion reaching visceral pleural surface; PL 3, parietal pleural invasion; SD, standard deviation.
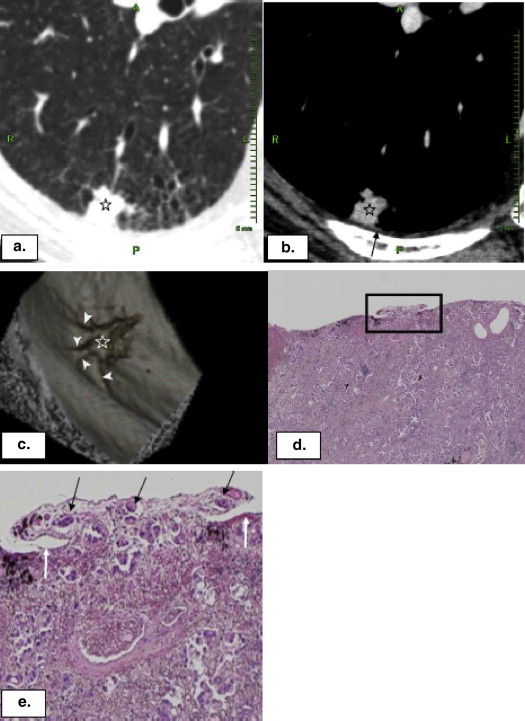
![Figure 4, Adenocarcinoma with parietal pleural invasion in a 58-year-old woman. A 17-mm pulmonary nodule ( star ) in contact with the pleura >13.7 mm (a) and no associated pleural thickening (b) are seen. 3D rendering CT imaging demonstrated a skirt-like pattern of the pleura [ (c and d) ; (c) lateral view; (d) view as seen from above.] Calculated R area was 17.6, which exceeded the optimal threshold of R area of 13.4 for diagnosing parietal pleural invasion, and therefore, parietal pleural invasion was correctly predicted with our criterion. Low-power micrograph (e) hematoxylin–eosin stain; original magnification, ×40) of the resected specimen showed local pleural adhesion ( arrows ) in the neighboring area of the tumor. High-power micrograph [ (f) hematoxylin–eosin stain; original magnification, ×200] of the rectangular area in e revealed subtle tumor invasion in the parietal pleura ( black arrows ). Star , pleural cavity; white arrow , surface of visceral pleura. (Color version of figure is available online.)](https://storage.googleapis.com/dl.dentistrykey.com/clinical/PleuralInvasionbyPeripheralLungCancer/3_1s20S1076633214003857.jpg)
Get Radiology Tree app to read full this article<
Discussion
Get Radiology Tree app to read full this article<
Get Radiology Tree app to read full this article<
Get Radiology Tree app to read full this article<
Get Radiology Tree app to read full this article<
Get Radiology Tree app to read full this article<
Get Radiology Tree app to read full this article<
Get Radiology Tree app to read full this article<
Get Radiology Tree app to read full this article<
Get Radiology Tree app to read full this article<
Acknowledgments
Get Radiology Tree app to read full this article<
References
1. UyBico S.J., Wu C.C., Suh R.D., et. al.: Lung cancer staging essentials: the new TNM staging system and potential imaging pitfalls. Radiographics 2010; 30: pp. 1163-1181.
2. Travis W.D., Brambilla E., Rami-Porta R., et. al.: Visceral pleural invasion: pathologic criteria and use of elastic stains: proposal for the 7th edition of the TNM classification for lung cancer. J Thorac Oncol 2008; 3: pp. 1384-1390.
3. Oyama M., Miyagi Maeshima A., Tochigi N., et. al.: Prognostic impact of pleural invasion in 1488 patients with surgically resected non-small cell lung carcinoma. Jpn J Clin Oncol 2013; 43: pp. 540-546.
4. Glazer H.S., Duncan-Meyer J., Aronberg D.J., et. al.: Pleural and chest wall invasion in bronchogenic carcinoma: CT evaluation. Radiology 1985; 157: pp. 191-194.
5. Pennes D.R., Glazer G.M., Wimbish K.J., et. al.: Chest wall invasion by lung cancer: limitations of CT evaluation. AJR 1985; 144: pp. 507-511.
6. Kuriyama K., Tateishi R., Kumatani T., et. al.: Pleural invasion by peripheral bronchogenic carcinoma: assessment with three-dimensional helical CT. Radiology 1994; 191: pp. 365-369.
7. Blum A., Feldmann L., Bresler F., et. al.: Value of calculation of the kappa coefficient in the evaluation of an imaging method. J Radiol 1995; 76: pp. 441-443.
8. Bland J.M., Altman D.G.: Comparing methods of measurement: why plotting difference against standard method is misleading. Lancet 1995; 346: pp. 1085-1087.
9. Hanley J.A., McNeil B.J.: A method of comparing the areas under receiver operating characteristic curves derived from the same cases. Radiology 1983; 148: pp. 839-843.
10. DiPerna C.A., Wood D.E.: Surgical management of T3 and T4 lung cancer. Clin Cancer Res 2005; 11: pp. 5038s-5044s.
11. Facciolo F., Cardillo G., Lopergolo M., et. al.: Chest wall invasion in non-small cell lung carcinoma: a rationale for en bloc resection. J Thorac Cardiovasc Surg 2001; 121: pp. 649-656.
12. Tsuboi M., Ohira T., Saji H., et. al.: The present status of postoperative adjuvant chemotherapy for completely resected non-small cell lung cancer. Ann Thorac Cardiovasc Surg 2007; 13: pp. 73-77.
13. Imai K., Minamiya Y., Ishiyama K., et. al.: Use of CT to evaluate pleural invasion in non-small cell lung cancer: measurement of the ratio of the interface between tumor and neighboring structures to maximum tumor diameter. Radiology 2013; 267: pp. 619-626.
14. Gallagher B., Urbanski S.J.: The significance of pleural elastica invasion by lung carcinomas. Hum Pathol 1990; 21: pp. 512-517.
15. Shimosato Y., Suzuki A., Hashimoto T., et. al.: Prognostic implications of fibrotic focus (scar) in small peripheral lung cancers. Am J Surg Pathol 1980; 4: pp. 365-373.