
Rationale and Objectives
To investigate the effect of different reporting methods and performance measures on the assessment of the benefit of computer-aided diagnosis (CAD) in characterizing malignant and benign breast lesions on mammography and sonography.
Materials and Methods
In a previous study, 10 observers provided three types of reporting data (probability of malignancy [PM] estimates, Breast Imaging Reporting and Data System [BI-RADS] ratings, and biopsy decisions), both without and with CAD. The current study compares alternative performance measures computed from the three types of reporting data. The area under the receiver operating characteristic curve (AUC) was computed from both the PM estimates and the BI-RADS ratings, whereas sensitivity and specificity were computed from all three data types. Sensitivity and specificity values calculated from either the PM estimates or the BI-RADS ratings were determined by setting both constant and user-dependent thresholds. Student’s t -tests were used to evaluate the statistical significance of the differences in the performance measures without and with CAD.
Results
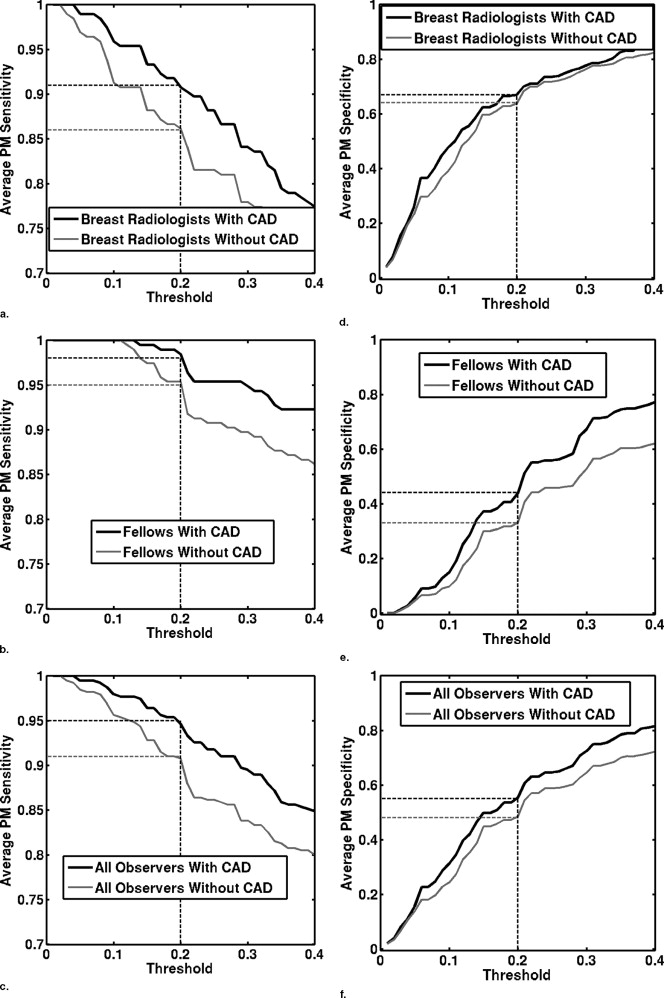
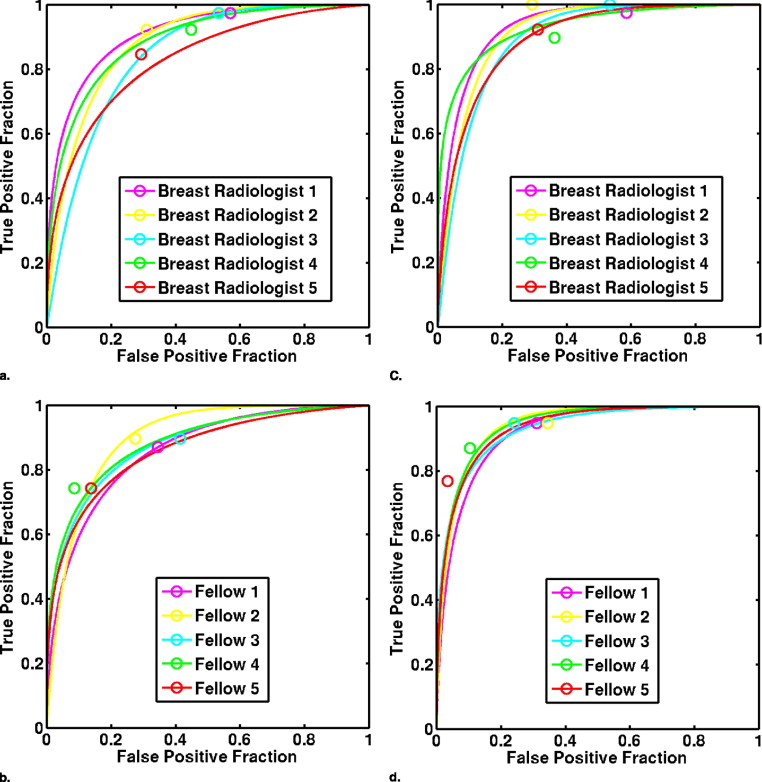
The average AUC values of the 10 observers calculated from either PM estimates or BI-RADS ratings demonstrated statistically significant improvements in performance with CAD, increasing from 0.87 to 0.92 or 0.93, respectively. However, the statistical significance of improvements in sensitivity or specificity depended on the type of reporting data used.
Conclusions
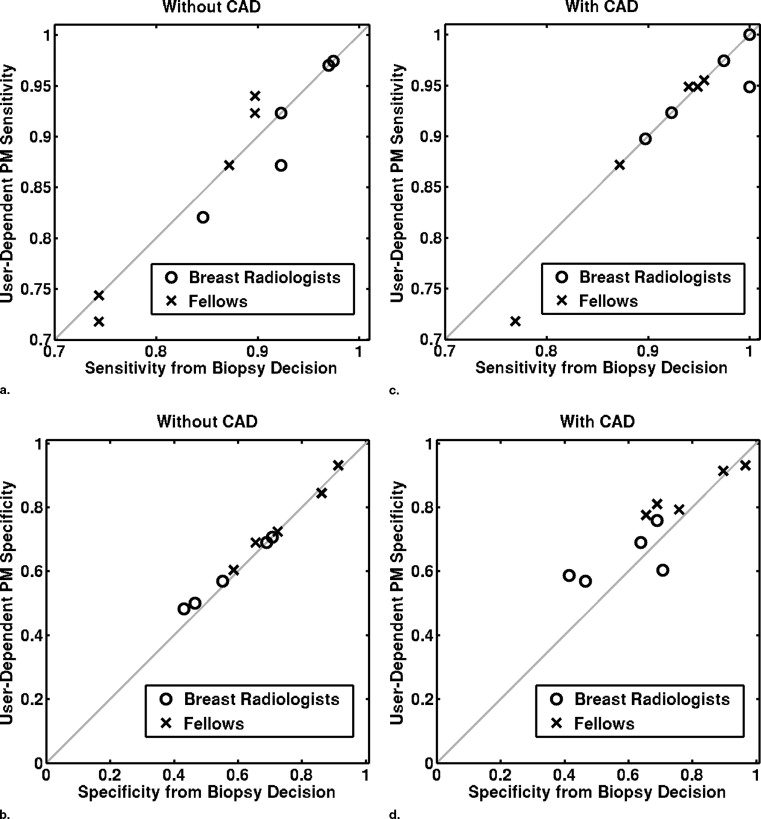
Use of different types of reporting data in the computation of sensitivity and specificity may result in different conclusions concerning the benefit of CAD. Meaningful determination of sensitivity and specificity from PM estimates require the use of user-dependent thresholds.
Accurate diagnostic interpretation of breast images requires that the radiologist visually identify various features known to be associated with malignancy or benignity. Considering such features together with the clinical findings, the radiologist must ultimately make a biopsy decision (ie, to recommend biopsy, follow-up, or no further action). To reduce confusion and increase standardization in malignant and benign feature identification on breast images, as well as in overall assessment of abnormality, the American College of Radiologists (ACR) provides reporting standards, known as the Breast Imaging Reporting and Data System (BI-RADS), which include breast-imaging lexicons of descriptors and a group of assessment categories ( ). Lexicons for mammography, breast sonography, and magnetic resonance imaging are available. The assessment categories used in diagnostic workup are: 1) negative, 2) benign findings, 3) probably benign findings—initial short-interval follow-up suggested, 4) suspicious abnormality—biopsy should be considered, and 5) highly suggestive of malignancy. The ACR recommends that a probably benign assessment should be given to those cases with a probability of malignancy of less than 2%, whereas a highly suggestive of malignancy assessment be reserved for those cases with probability of malignancy greater than 95%. Abnormalities found suspicious can be subdivided into categories 4a) low probability of malignancy, 4b) intermediate probability of malignancy, and 4c) high probability of malignancy. Diagnostic workup of breast abnormalities therefore requires that the radiologist report various types of data, including feature descriptors, categoric assessment, rough probability of malignancy (PM) estimates, and biopsy decision.
Improvements in reporting standards have resulted in improved accuracy in the diagnosis of breast cancer. Nonetheless, radiologists still fail to correctly characterize malignant and benign breast lesions. Computer-aided diagnosis (CAD) has been investigated as a method of improving radiologists’ diagnostic accuracy in the interpretation of breast lesions on both mammography and sonography ( and the references therein). To determine the benefit of CAD to the performance of radiologists in differentiating malignant and benign breast lesions, observer studies are frequently conducted ( ). During such studies, observers are shown the images from a number of different cases, first without and then with the CAD. Under each reading condition, the observer is asked to report some sort of data—for example, a BI-RADS category, a rating on a scale of 0 to 100 representing the observer’s estimate of the lesion’s PM, or a biopsy decision on whether to biopsy or not. These reporting data can then be used to compute unaided and aided performance measures, which serve to quantify the performance of each observer in the task of distinguishing malignant from benign lesions under each reading condition. For example, receiver operating characteristic (ROC) analysis ( ) of either the BI-RADS or PM ratings can be used to compute the area under the ROC curve (AUC) performance measure.
Get Radiology Tree app to read full this article<
Get Radiology Tree app to read full this article<
Get Radiology Tree app to read full this article<
Get Radiology Tree app to read full this article<
Materials and methods
Get Radiology Tree app to read full this article<
Get Radiology Tree app to read full this article<
Prior Observer Study: Databases
Get Radiology Tree app to read full this article<
Get Radiology Tree app to read full this article<
Prior Observer Study: Intelligent Workstation for CAD
Get Radiology Tree app to read full this article<
Get Radiology Tree app to read full this article<
Prior Observer Study: Study Design
Get Radiology Tree app to read full this article<
Additional Analysis of Data from the Prior Observer Study: Comparison of Performance Measures
Get Radiology Tree app to read full this article<
Get Radiology Tree app to read full this article<
Get Radiology Tree app to read full this article<
sensitivityBD=(NumberofmalignantlesionswithaBDofbiopsy)Numberofmalignantlesions; sensitivit
y
B
D
=
(
Number
of
malignant
lesions
with
a
BD
of
biopsy
)
Number
of
malignant
lesions
;
specificityBD=(NumberofbenignlesionswithaBDoffollowup)Numberofbenignlesions. specificit
y
B
D
=
(
Number
of
benign
lesions
with
a
BD
of
follow
up
)
Number
of
benign
lesions
.
Get Radiology Tree app to read full this article<
Get Radiology Tree app to read full this article<
Get Radiology Tree app to read full this article<
sensitivityBIRADS=(NumberofmalignantlesionswithBIRADSrating>3)Numberofmalignantlesions; sensitivit
y
B
I
R
A
D
S
=
(
Number
of
malignant
lesions
with
BIRADS
rating
3
)
Number
of
malignant
lesions
;
specificityBIRADS=(NumberofbenignlesionswithBIRADSrating≤3)Numberofbenignlesions specificit
y
B
I
R
A
D
S
=
(
Number
of
benign
lesions
with
BIRADS
rating
≤
3
)
Number
of
benign
lesions
Get Radiology Tree app to read full this article<
Get Radiology Tree app to read full this article<
sensitivityPM(c)=(NumberofmalignantlesionswithPM>c)Numberofmalignantlesions; sensitivit
y
P
M
(
c
)
=
(
Number
of
malignant
lesions
with
PM
c
)
Number
of
malignant
lesions
;
specificityPM(c)=(NumberofbenignlesionswithPM≤c)Numberofbenignlesions specificit
y
P
M
(
c
)
=
(
Number
of
benign
lesions
with
PM
≤
c
)
Number
of
benign
lesions
Get Radiology Tree app to read full this article<
Get Radiology Tree app to read full this article<
cUD=csen+cspe2, c
U
D
=
c
s
e
n
+
c
s
p
e
2
,
where
csenminimizes|sensitivityPM(csen)−sensitivityBD| c
s
e
n
minimizes
|
sensitivit
y
PM
(
c
s
e
n
)
−
sensitivit
y
BD
|
and
cspeminimizes|specificityPM(cspe)−specificityBD|. c
s
p
e
minimizes
|
specificit
y
PM
(
c
s
p
e
)
−
specificit
y
BD
|
.
Get Radiology Tree app to read full this article<
Get Radiology Tree app to read full this article<
Get Radiology Tree app to read full this article<
Table 1
The 12 Performance Measures, Indicated by “X”, for Various Combinations of Performance Measure Type and Interpretation Data Type
Performance Measures Interpretation Data Type PM O Data BI-RADS Data BD Data Performance measure type AUC value X X 2% threshold 20% threshold User-dependent threshold Sensitivity X X X X X Specificity X X X X X
BI-RADS: Breast Imaging Reporting and Data System; PM O : observer probability of malignancy estimates; BD: biopsy decision.
Get Radiology Tree app to read full this article<
Get Radiology Tree app to read full this article<
Results
Get Radiology Tree app to read full this article<
Table 2
Average AUC Values, as Computed From BI-RADS and PM O Ratings, for Each Observer Group, Without and With CAD
AUC Value Observer Group Without Aid With Aid Difference 95% Confidence Interval_P_ Value From BI-RADS ratings Breast radiologists 0.86 ± 0.04 0.91 ± 0.04 0.05 ± 0.02 (0.02, 0.08) .01 Fellows 0.88 ± 0.01 0.94 ± 0.01 0.06 ± 0.01 (0.04, 0.07) .0004 All observers 0.87 ± 0.03 0.93 ± 0.03 0.06 ± 0.02 (0.04, 0.06) .000009 From PM O ratings Breast radiologists 0.87 ± 0.03 0.91 ± 0.02 0.04 ± 0.02 (0.02, 0.07) .008 Fellows 0.88 ± 0.02 0.93 ± 0.01 0.05 ± 0.01 (0.04, 0.07) .0004 All observers 0.87 ± 0.03 0.92 ± 0.02 0.05 ± 0.02 (0.04, 0.06) .000006
AUC: area under the curve; CAD: computer-assisted diagnosis; BI-RADS: Breast Imaging Reporting and Data System; PM O : observer probability of malignancy estimates; BD: biopsy decision.
Get Radiology Tree app to read full this article<
Get Radiology Tree app to read full this article<
Get Radiology Tree app to read full this article<
Get Radiology Tree app to read full this article<
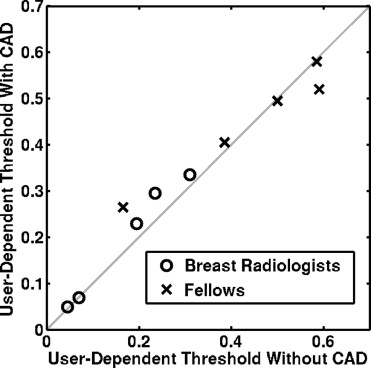
Table 3
Average User-Dependent Threshold for Each Observer Group, Without and With CAD
Observer Group Average User-Dependent Threshold Without Aid Average User-Dependent Threshold With Aid Difference 95% Confidence Interval_P_ Value Breast radiologists 17 ± 11% 20 ± 13% 3 ± 2% (−0.5%, 5%) .08 Fellows 44 ± 18% 45 ± 12% 1 ± 6% (−7%, 8%) .78 All observers 31 ± 20% 32 ± 18% 1 ± 4% (−2%, 5%) .28
CAD: computer-assisted diagnosis.
Get Radiology Tree app to read full this article<
Get Radiology Tree app to read full this article<
Table 4
Average Sensitivity and Specificity (as Computed from Different Data Types) for Each Observer Group, Both Without and With CAD
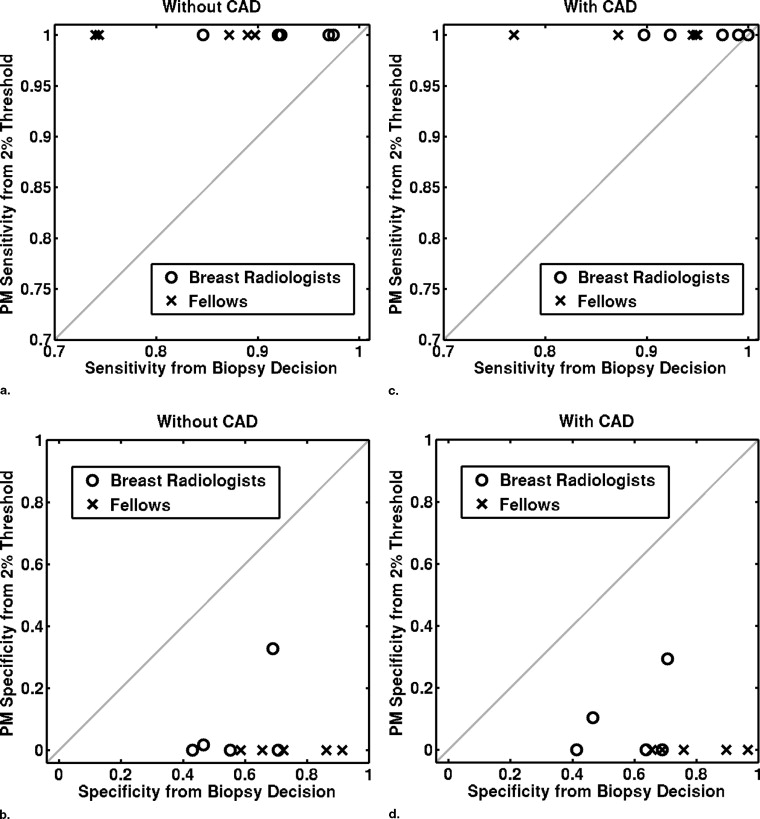
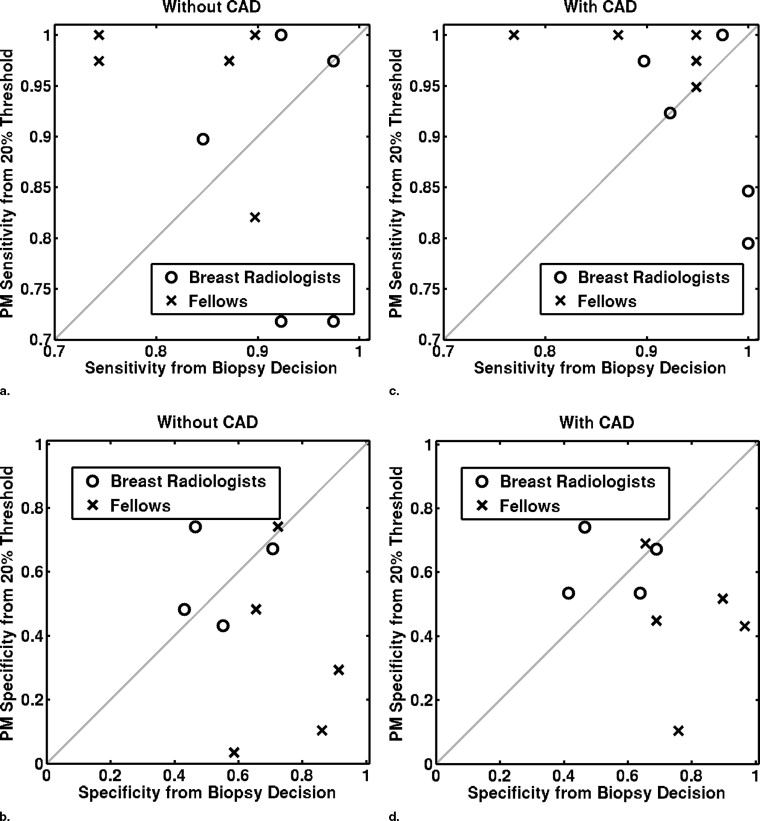
Sensitivity/Specificity Observer Group Without Aid With Aid Difference Confidence Interval_P_ Value From biopsy decision Breast radiologists 0.93 ± 0.05 0.96 ± 0.05 0.03 ± 0.04 (−0.02, 0.09) .17 0.57 ± 0.13 0.58 ± 0.14 0.01 ± 0.05 (−0.04, 0.07) .53 Fellows 0.83 ± 0.08 0.90 ± 0.08 0.07 ± 0.04 (0.02, 0.12).02 0.75 ± 0.13 0.80 ± 0.13 0.05 ± 0.09 (−0.07, 0.16) .31 All observers 0.88 ± 0.08 0.93 ± 0.07 0.05 ± 0.04 (0.02, 0.08).005 0.66 ± 0.15 0.69 ± 0.17 0.03 ± 0.07 (−0.02, 0.08) .20 From BI-RADS ratings Breast radiologists 0.90 ± 0.05 0.95 ± 0.06 0.05 ± 0.03 (0.002, 0.09).04 0.64 ± 0.08 0.68 ± 0.11 0.04 ± 0.07 (–0.05, 0.12) .32 Fellows 0.82 ± 0.08 0.89 ± 0.09 0.07 ± 0.04 (0.02, 0.12).02 0.75 ± 0.14 0.80 ± 0.13 0.05 ± 0.09 (−0.06, 0.16) .30 All observers 0.86 ± 0.08 0.92 ± 0.08 0.06 ± 0.04 (0.03, 0.09).001 0.70 ± 0.12 0.74 ± 0.13 0.04 ± 0.08 (−0.01, 0.10) .32 From PM O ratings with a constant threshold of 20% Breast radiologists 0.86 ± 0.13 0.91 ± 0.09 0.05 ± 0.06 (−0.03, 0.12) .18 0.64 ± 0.18 0.67 ± 0.14 0.03 ± 0.04 (−0.03, 0.09) .21 Fellows 0.95 ± 0.08 0.98 ± 0.02 0.03 ± 0.06 (−0.04, 0.11) .30 0.33 ± 0.29 0.44 ± 0.21 0.11 ± 0.17 (−0.10, 0.32) .21 All observers 0.91 ± 0.11 0.95 ± 0.07 0.04 ± 0.06 (−0.003, 0.08) .06 0.48 ± 0.28 0.55 ± 0.21 0.07 ± 0.12 (−0.02, 0.16) .10 From PM O ratings with a user-dependent threshold Breast radiologists 0.91 ± 0.07 0.95 ± 0.04 0.04 ± 0.05 (−0.03, 0.10) .17 0.59 ± 0.11 0.64 ± 0.08 0.05 ± 0.08 (−0.05, 0.16) .24 Fellows 0.82 ± 0.09 0.89 ± 0.10 0.07 ± 0.05 (0.003, 0.13).04 0.76 ± 0.13 0.84 ± 0.07 0.08 ± 0.08 (−0.008, 0.18) .06 All observers 0.86 ± 0.09 0.92 ± 0.08 0.06 ± 0.05 (0.02, 0.09).01 0.67 ± 0.14 0.74 ± 0.13 0.07 ± 0.08 (0.01, 0.13).02
CAD: computer-assisted diagnosis; BI-RADS: Breast Imaging Reporting and Data System; PM O : observer probability of malignancy estimates.
Sensitivity is given in the first line of each cell, and specificity in the second.
P values in boldface indicate a statistically significance difference ( P < .05).
Get Radiology Tree app to read full this article<
Discussion
Get Radiology Tree app to read full this article<
Get Radiology Tree app to read full this article<
Get Radiology Tree app to read full this article<
Get Radiology Tree app to read full this article<
Get Radiology Tree app to read full this article<
Get Radiology Tree app to read full this article<
Get Radiology Tree app to read full this article<
Get Radiology Tree app to read full this article<
Get Radiology Tree app to read full this article<
Get Radiology Tree app to read full this article<
Conclusion
Get Radiology Tree app to read full this article<
Get Radiology Tree app to read full this article<
References
1. American College of Radiology: Breast Imaging Reporting and Data System Atlas (BI-RADS Atlas).2003.American College of RadiologyReston, Va
2. Giger M.L., Huo Z., Kupinski M.A., et. al.: Computer-aided diagnosis in mammography.Fitzpatrick M.J.Sonka M.2000.SPIE PressBellingham, Wash:pp. 915-1004.
3. Vyborny C.J., Giger M.L.: Computer vision and artificial intelligence in mammography. AJR Am J Roentgenol 1994; 162: pp. 699-708.
4. Giger M.L.: CAD in diagnostic mammography and multimodality breast imaging.Karellas A.Giger M.L.RSNA categorical course in diagnostic radiology physics: physical aspects of breast imaging.2004.Radiological Society of North AmericaOak Brook, Ill:pp. 205-217.
5. Jiang Y.: Classification of breast lesions in mammograms.Bankman Handbook of medical imaging, processing and analysis.2000.Academic PressSan Diego, Calif:pp. 341-358.
6. Jiang Y., Nishikawa R.M., Schmidt R.A., et. al.: Improving breast cancer diagnosis with computer-aided diagnosis. Acad Radiol 1999; 6: pp. 22-33.
7. Hou Z., Giger M.L., Vyborny C.J., et. al.: Breast cancer: effectiveness of computer-aided diagnosis—observer study with independent database of mammograms. Radiology 2002; 224: pp. 560-588.
8. Giger M.L., Huo Z., Vyborny C.J.: Results of an observer study with an intelligent mammographic workstation for CAD.Peitgen H.-O.Digital mammography: IWDM 2002.2002.SpringerBerlin:pp. 297-303.
9. Hadjiiski L., Chan H.P., Sahiner B., et. al.: Improvement in radiologists’ characterization of malignant and benign masses on serial mammograms with computer-aided diagnosis: an ROC study. Radiology 2004; 233: pp. 255-265.
10. Horsch K., Giger M.L., Vyborny C.J., et. al.: Performance of computer-aided diagnosis in the interpretation of lesions on breast sonography. Acad Radiol 2004; 3: pp. 272-280.
11. Horsch K., Giger M.L., Vyborny C.J., et. al.: Multi-modality computer-aided diagnosis for the classification of breast lesions: observer study results on an independent clinical dataset. Radiology 2006; 240: pp. 357-368.
12. Metz C.: ROC methodology in radiologic imaging. Invest Radiol 1986; 21: pp. 720-733.
13. Wagner R.F.: Toward a strategy for consensus development on a quantitative approach to medical imaging. Acad Radiol 2007; 13: pp. 137-139.
14. R2 Technology, Inc, ImageChecker® CT CAD Software, Professional Labeling. http://www.fda.gov/cdrh/PDF3/p030012.html Accessed 2007
15. Rockette H.E., Gur D., Metz C.E.: The use of continuous and discrete confidence judgments in receiver operating characteristic studies of diagnostic imaging techniques. Invest Radiol 1992; 27: pp. 169-172.
16. King J.L., Bitton C.A., Gur D., et. al.: On the validity of the continuous and discrete confidence rating scales in receiver operating characteristic studies. Invest Radiol 1993; 28: pp. 962-963.
17. Wagner R.F., Beiden S.V., Metz C.E.: Continuous versus categorical data for ROC analysis: some quantitative considerations. Acad Radiol 2001; 8: pp. 328-334.
18. Hadjiiski L., Chan H.P., Sahiner B., et. al.: Quasi-continuous and discrete confidence rating scales for observer performance studies: effects on ROC analysis. Acad Radiol 2007; 17: pp. 38-48.
19. Giger M.L., Huo Z., Lan L.: Intelligent search workstation for computer aided diagnosis.Lemke H.U.Inamura K.Kunio D. et. al.Proceedings of Computer Assisted Radiology and Surgery (CARS) 2000.2000.ElsevierPhiladelphia, Pa:pp. 822-827.
20. Huo Z., Giger M.L., Vyborny C.J., et. al.: Analysis of spiculation in the computerized classification of mammographic masses. Med Phys 1995; 22: pp. 1569-1579.
21. Huo Z., Giger M.L., Vyborny C.J., et. al.: Automated computerized classification of malignant and benign masses on digitized mammograms. Acad Radiol 1998; 5: pp. 155-168.
22. Giger M.L., Al-Hallaq H., Huo Z., et. al.: Computerized analysis of lesions in US images of the breast. Acad Radiol 1999; 6: pp. 665-674.
23. Horsch K., Giger M.L., Venta L.A., et. al.: Automatic segmentation of breast lesions on ultrasound. Med Phys 2001; 28: pp. 1652-1659.
24. Horsch K., Giger M.L., Venta L.A., et. al.: Computerized diagnosis of breast lesions on ultrasound. Med Phys 2002; 29: pp. 157-164.
25. LABROC4: Website of Kurt Rossman Laboratories, Department of Radiology, University of Chicago. http://www-radiology.uchicago.edu/krl/roc_soft.htm Accessed June 10, 2004
26. Metz C.E., Herman B.A., Shen J.-H.: Maximum-likelihood estimation of ROC curves from continuously-distributed data. Statist Med 1998; 17: pp. 1033-1053.
27. PROPROC: Website of Kurt Rossman Laboratories, Department of Radiology, University of Chicago. http://www-radiology.uchicago.edu/krl/roc_soft.htm Accessed 2004
28. Metz C.E., Pan X.: “Proper” binormal ROC curves: theory and maximum-likelihood estimation. J Math Psych 1999; 43: pp. 1-33.
29. Pan X., Metz C.E.: The “proper” binormal model: parametric receiver operating characteristic curve estimation with degenerate data. Acad Radiol 1997; 4: pp. 380-389.
30. Pesce L.L., Metz C.E.: Reliable and computationally efficient maximum-likelihood estimation of “proper” binormal ROC curves. Acad Radiol 2007; 14: pp. 814-829.
31. Sahiner B., Chan H.P., Hadjiski L., et. al.: The effect of a multi-modality computer classifier on radiologists’ accuracy in characterizing breast masses using mammograms and volumetric ultrasound images: an ROC study. Scientific Paper. RSNA.2004.
32. Metz C.E.: Some practical issues of experimental-design and data-analysis in radiological ROC studies. Invest Radiol 1989; 24: pp. 234-245.
33. Wagner R.F., Metz C.E., Campbell G.: Assessment of medical imaging systems and computer aids: a tutorial review. Acad Radiol 2007; 14: pp. 723-748.