
Oral presentations remain a common teaching method in academic radiology. The goal of these presentations is to transfer knowledge from the presenter’s brain to brains in the audience in a way that sticks. A number of studies from the recent psychological and physiological literature offer some rather practical and evidence-based advice on ways to optimize our oral presentations. The purpose of this paper is to summarize this work, and to give examples of how it can be harnessed to increase the efficacy of radiology presentations, whether they are for resident education, a continuing medical education course, or for a scientific presentation at a national radiology meeting.
INTRODUCTION
What is the best way to present information to our students so that they remember it? Radiology educators have experimented with many approaches over the years, which boil down to four principle techniques: we show them images, we talk about the images, we give them materials to read (and write), and we teach them to do procedures. In the educational literature, these four learning styles are sometimes summarized with the acronym VARK (visual, aural, reading/writing, and kinesthetic) . Most of our educational presentations involve the first three of these learning styles.
Learning is all the more remarkable, when one considers that we forget most of the things that happen to us in a given day. What is it that distinguishes these events from those that we choose to learn and remember? A number of studies from the recent psychological and physiological literature offer some practical insights into how this happens. It is clear that learning is influenced by the characteristics of particular stimuli and how they are processed. There is also evidence that motivational states can play an important role in information that is consigned to long-term memory.
Much of the early work in educational psychology relied on subjective information from the experimental subjects. More recently, experimenters have employed electroencephalography, positron-emission tomography, magnetoencephalography, and functional magnetic resonance imaging (fMRI) to obtain objective data about which parts of the brain are active during various educational interventions. This type of research has led to some fascinating results. For example, one fMRI study showed that when a speaker and a listener are communicating well, the brain activity of the listener actually mirrors that of the speaker . This synchronization of brain activity has been termed neural coupling, and greater neural coupling between the speaker and the listener is associated with greater understanding by the listener.
Advances in the psychology and physiology of learning have been paralleled by similar advances in pedagogical techniques. However, despite a current trend toward more active teaching techniques, the oral presentation remains one of the main tools in our educational arsenal. This is true not only for residency training but also for scientific meetings and for continuing medical education events . Until oral presentations are someday replaced by more effective methods, we want our presentations to be as effective as possible.
Much has been written on the topic of optimal presentation design . National organizations such as the Radiological Society of North America, the American Roentgen Ray Society, and the Association of University Radiologists have long sponsored programs to improve the presentation skills of their speakers. However, much of the presentation advice in these publications and programs consists of personal preferences, anecdotes, and opinions, and little of it has undergone experimental validation. Fortunately, recent research into the psychology and physiology of learning has led to a number of practical results that have undergone such validation. The purpose of this paper is to summarize some of this work, and to present several evidence-based principles that can be harnessed to optimize radiology presentations.
COGNITIVE BIASES AND PHYSIOLOGIC EFFECTS THAT INFLUENCE LEARNING
Get Radiology Tree app to read full this article<
Get Radiology Tree app to read full this article<
Cognitive Biases
Get Radiology Tree app to read full this article<
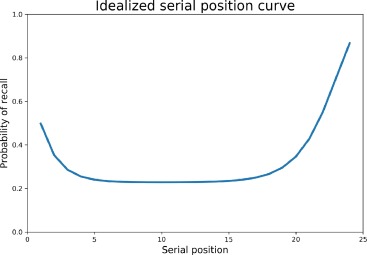
Serial Position Bias
Get Radiology Tree app to read full this article<
Get Radiology Tree app to read full this article<
Levels of Processing Effect
Get Radiology Tree app to read full this article<
Get Radiology Tree app to read full this article<
Get Radiology Tree app to read full this article<
Curiosity Effect
Get Radiology Tree app to read full this article<
Get Radiology Tree app to read full this article<
Visual Channel Effects
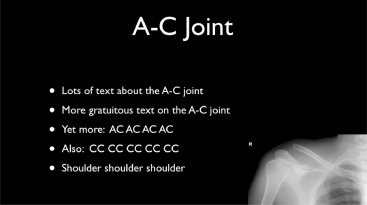
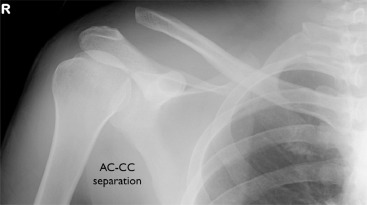
Picture Superiority Bias
Get Radiology Tree app to read full this article<
Get Radiology Tree app to read full this article<
von Restorff Effect
Get Radiology Tree app to read full this article<
Get Radiology Tree app to read full this article<
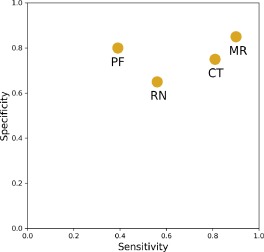
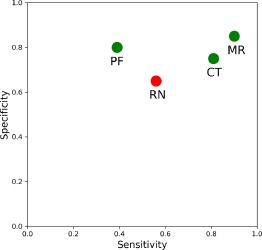
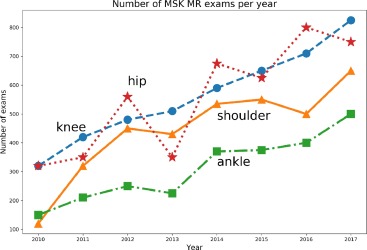
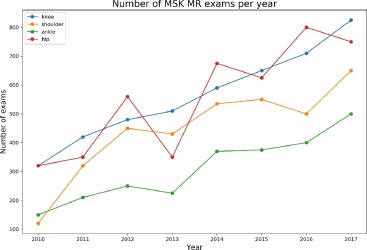
Color Vision Deficiency
Get Radiology Tree app to read full this article<
Get Radiology Tree app to read full this article<
Get Radiology Tree app to read full this article<
Get Radiology Tree app to read full this article<
![Figure 7, The optimized color palette from Table 1 . This also includes simulations of how this palette might appear to persons with three different types of color vision deficiency, similar to the chart from Okabe et al. [35] .](https://storage.googleapis.com/dl.dentistrykey.com/clinical/PracticalPresentationPearlsEvidencebasedRecommendationsFromthePsychologyandPhysiologyLiterature/6_1s20S1076633218301910.jpg)
Table 1
A Color Palette Optimized for Persons With Color Vision Deficiency
Color Name RGB (0–255) RGB(hexadecimal) CMYK (%) Black 0,0,0 #000000 0, 0, 0, 100 Orange 230, 159, 0 #e69f00 0, 50, 100, 0 Sky blue 86, 180, 233 #56b4e9 80, 0, 0, 0 Bluish green 0, 158, 115 #009e73 97, 0, 75, 0 Yellow 240, 228, 66 #f0e442 10, 5, 90, 0 Blue 0, 114, 178 #0072b2 100, 50, 0, 0 Vermilion 213, 94, 0 #d55e00 0, 80, 100, 0 Reddish purple 204, 121, 167 #cc79a7 10, 70, 0, 0
Get Radiology Tree app to read full this article<
Get Radiology Tree app to read full this article<
Get Radiology Tree app to read full this article<
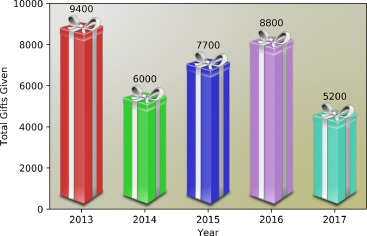
Visual Embellishments
Get Radiology Tree app to read full this article<
Get Radiology Tree app to read full this article<
Get Radiology Tree app to read full this article<
Get Radiology Tree app to read full this article<
Auditory Channel Effects
Get Radiology Tree app to read full this article<
Get Radiology Tree app to read full this article<
Get Radiology Tree app to read full this article<
Get Radiology Tree app to read full this article<
Get Radiology Tree app to read full this article<
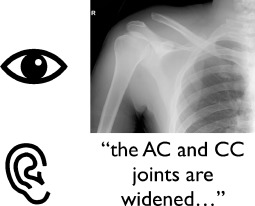
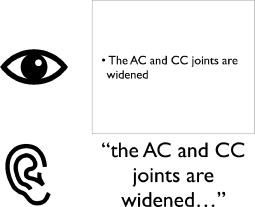
Dual-processing Model: Interactions Between the Visual and Auditory Channels
Get Radiology Tree app to read full this article<
Get Radiology Tree app to read full this article<
Get Radiology Tree app to read full this article<
Get Radiology Tree app to read full this article<
Get Radiology Tree app to read full this article<
Cognitive Overload
Get Radiology Tree app to read full this article<
Get Radiology Tree app to read full this article<
Visual Channel Overload
Get Radiology Tree app to read full this article<
Overload of Both Channels
Get Radiology Tree app to read full this article<
Get Radiology Tree app to read full this article<
Overload by Extraneous Material
Get Radiology Tree app to read full this article<
Overload by Confusing Presentation Style
Get Radiology Tree app to read full this article<
Get Radiology Tree app to read full this article<
Overload by Need to Hold Excessive Information in Working Memory
Get Radiology Tree app to read full this article<
Get Radiology Tree app to read full this article<
Conclusions
Get Radiology Tree app to read full this article<
Table 2
Evidence-based Principles for Improving Presentation Efficacy
Effect Main Concept Recommendations_Serial-position bias_ 1st & last items in list are best remembered Place most important points at beginning & end of presentation_Levels of processing effect_ Deeper levels of mental processing enhance recall Frame key points so as to require more mental processing_Curiosity effect_ Curiosity about a subject enhances recall Start session with quiz or mystery case_Picture-superiority bias_ Recall is higher for pictures than for text Use more image slides & less text_von Restorff effect_ The stimulus most different is best remembered Use differences in size, shape, & color to emphasize key points_Color vision deficiency_ ≥ 8% of North American population has some form of this Use color-safe palette & redundant coding to clearly emphasize key points_Visual embellishments_ Appropriate visual embellishments can enhance recall but increase cognitive load Sparing use of embellishments for key points_Auditory channel effect_ Voice-only communication enhances empathic accuracy Use black or blank slides during emotional appeals_Dual-processing model_ Learning occurs in visual & auditory channels; some interactions may hamper recall Present mostly images & tell stories about them
Get Radiology Tree app to read full this article<
Get Radiology Tree app to read full this article<
Get Radiology Tree app to read full this article<
References
1. Lujan H.L., DiCarlo S.E.: First-year medical students prefer multiple learning styles. Adv Physiol Educ 2006; 30: pp. 13-16.
2. Newton P.M., Miah M.: Evidence-based higher education – is the learning styles ‘myth’ important?. Front Psychol 2017; 8: pp. 444.
3. Papanagnou D., Serrano A., Barkley K., et. al.: Does tailoring instructional style to a medical student’s self-perceived learning style improve performance when teaching intravenous catheter placement? A randomized controlled study. BMC Med Educ 2016; 16: pp. 205.
4. Prithishkumar I.J., Michael S.A.: Understanding your student: using the VARK model. J Postgrad Med 2014; 60: pp. 183-186.
5. Thepsatitporn S., Pichitpornchai C.: Visual event-related potential studies supporting the validity of VARK learning styles’ visual and read/write learners. Adv Physiol Educ 2016; 40: pp. 206-212.
6. Urval R.P., Kamath A., Ullal S., et. al.: Assessment of learning styles of undergraduate medical students using the VARK questionnaire and the influence of sex and academic performance. Adv Physiol Educ 2014; 38: pp. 216-220.
7. Stephens G.J., Silbert L.J., Hasson U.: Speaker-listener neural coupling underlies successful communication. Proc Natl Acad Sci USA 2010; 107: pp. 14425-14430.
8. Brown G., Manogue M.: AMEE Medical Education Guide No. 22: refreshing lecturing: a guide for lecturers. Med Teach 2001; 23: pp. 231-244.
9. Palis A.G., Quiros P.A.: Adult learning principles and presentation pearls. Middle East Afr J Ophthalmol 2014; 21: pp. 114-122.
10. Collins J.: Education techniques for lifelong learning: making a PowerPoint presentation. Radiographics 2004; 24: pp. 1177-1183.
11. Harolds J.A.: Tips for giving a memorable presentation, part I: the speaker as an educator. Clin Nucl Med 2012; 37: pp. 669-670.
12. Harolds J.A.: Tips for giving a memorable presentation, part 2: the speaker as a leader. Clin Nucl Med 2012; 37: pp. 763-765.
13. Harolds J.A.: Tips for giving a memorable presentation, part III: composing an important formal presentation. Clin Nucl Med 2012; 37: pp. 872-873.
14. Harolds J.A.: Tips for giving a memorable presentation, part IV: using and composing PowerPoint slides. Clin Nucl Med 2012; 37: pp. 977-980.
15. Harolds J.A.: Tips for giving a memorable presentation, part V: stage fright and rehearsing a presentation. Clin Nucl Med 2012; 37: pp. 1094-1096.
16. Harolds J.A.: Tips for giving a memorable presentation, part VI: the effective use of questions by a speaker, and answering questions from listeners. Clin Nucl Med 2012; 37: pp. 1173-1175.
17. Kosslyn S.M.: 2007.Oxford University Press
18. Scarsbrook A.F., Graham R.N.J., Perriss R.W.: Expanding the use of Microsoft PowerPoint. An overview for radiologists. Clin Radiol 2006; 61: pp. 113-123.
19. Schacter D.L.: The seven sins of memory. Insights from psychology and cognitive neuroscience. Am Psychol 1999; 54: pp. 182-203.
20. Wikipedia contributors. List of memory biases—Wikipedia, the free encyclopedia. 2018. [Online; Accessed January 14, 2018]; URL https://en.wikipedia.org/w/index.php?title=List_of_memory_biases&oldid=819228788 .
21. Deese J., Kaufman R.A.: Serial effects in recall of unorganized and sequentially organized verbal material.. J Exp Psychol 1957; 54: pp. 180-187.
22. Murdock B.B.: The serial position effect of free recall. J Exp Psychol 1962; 64: pp. 482-488.
23. Craik F.I.M., Lockhart R.S.: Levels of processing: a framework for memory research. J Verbal Learn Verbal Behav 1972; 11: pp. 671-684.
24. Kapur S., Craik F.I., Tulving E., et. al.: Neuroanatomical correlates of encoding in episodic memory: levels of processing effect. Proc Natl Acad Sci USA 1994; 91: pp. 2008-2011.
25. Gruber M.J., Gelman B.D., Ranganath C.: States of curiosity modulate hippocampus-dependent learning via the dopaminergic circuit. Neuron 2014; 84: pp. 486-496.
26. Paivio A., Csapo K.: Picture superiority in free recall: imagery or dual coding?. Cognit Psychol 1973; 5: pp. 176-206.
27. McBride D.M., Anne Dosher B.: A comparison of conscious and automatic memory processes for picture and word stimuli: a process dissociation analysis. Conscious Cogn 2002; 11: pp. 423-460.
28. Nelson D.L., Reed V.S., Walling J.R.: Pictorial superiority effect. J Exp Psychol Hum Learn 1976; 2: pp. 523-528.
29. von Restorff H.: Über die wirkung von bereichsbildungen im spurenfeld. Psychol Forsch 1933; 18: pp. 299-342.
30. Parker A., Wilding E., Akerman C.: The von Restorff effect in visual object recognition memory in humans and monkeys. The role of frontal/perirhinal interaction. J Cogn Neurosci 1998; 10: pp. 691-703.
31. Scanlon J., Roberts J.: Color vision deficiencies in children. Vital Health Stat 1972; 11: pp. 1-34.
32. Slaby D., Roberts J.: Color vision deficiencies in youths 12-17 years of age, United States. Vital Health Stat 1974; 11: pp. 1-41.
33. Xie J.Z., Tarczy-Hornoch K., Lin J., et. al.: Color vision deficiency in preschool children: the multi-ethnic pediatric eye disease study. Ophthalmology 2014; 121: pp. 1469-1474.
34. Wong B.: Color blindness. Nat Methods 2011; 8: pp. 441.
35. Okabe M., Ito K Color universal design (CUD) – how to make figures and presentations that are friendly to colorblind people. 2018. http://jfly.iam.u-tokyo.ac.jp/color/ .
36. Borkin M.A., Vo A.A., Bylinskii Z., et. al.: What makes a visualization memorable?. IEEE Trans Vis Comput Graph 2013; 19: pp. 2306-2315.
37. Tufte E.R.: 1990.Graphics Press
38. Tufte E.R.: 2001.Graphics Press
39. Cleveland W.S., McGill R.: Graphical perception: theory, experimentation, and application to the development of graphical methods.. J Am Stat Assn 1984; 79: pp. 531-554.
40. Cleveland W.S., McGill R.: Graphical perception and graphical methods for analyzing scientific data. Science 1985; 229: pp. 828-833.
41. Bateman S., Mandryk R.L., Gutwin C., et. al.: Useful junk? The effects of visual embellishment on comprehension and memorability of charts.2010.pp. 2573-2582.
42. Borgo R., Abdul-Rahman A., Mohamed F., et. al.: An empirical study on using visual embellishments in visualization. IEEE Trans Vis Comput Graph 2012; 18: pp. 2759-2768.
43. Hullman J., Adar E., Shah P.: Benefitting InfoVis with visual difficulties. IEEE Trans Vis Comput Graph 2011; 17: pp. 2213-2222.
44. Kraus M.W.: Voice-only communication enhances empathic accuracy. Am Psychol 2017; 72: pp. 644-654.
45. Schirmer A., Adolphs R.: Emotion perception from face, voice, and touch: comparisons and convergence. Trends Cogn Sci 2017; 21: pp. 216-228.
46. Mayer R.E., Moreno R.: A split-attention effect in multimedia learning: Evidence for dual processing systems in working memory. J Educ Psychol 1998; 90: pp. 312-320.
47. Mayer R.E., Moreno R.: Nine ways to reduce cognitive load in multimedia learning. Educ Psychol 2003; 38: pp. 43-52.
48. Molloy K., Griffiths T.D., Chait M., et. al.: Inattentional deafness: visual load leads to time-specific suppression of auditory evoked responses. J Neurosci 2015; 35: pp. 16046-16054.