
Rationale and Objectives
Imaging utilization has significantly increased over the last two decades, and is only recently showing signs of moderating. To help healthcare providers identify patients at risk for high imaging utilization, we developed a prediction model to recognize high imaging utilizers based on their initial imaging reports.
Materials and Methods
The prediction model uses a machine learning text classification framework. In this study, we used radiology reports from 18,384 patients with at least one abdomen computed tomography study in their imaging record at Stanford Health Care as the training set. We modeled the radiology reports in a vector space and trained a support vector machine classifier for this prediction task. We evaluated our model on a separate test set of 4791 patients. In addition to high prediction accuracy, in our method, we aimed at achieving high specificity to identify patients at high risk for high imaging utilization.
Results
Our results (accuracy: 94.0%, sensitivity: 74.4%, specificity: 97.9%, positive predictive value: 87.3%, negative predictive value: 95.1%) show that a prediction model can enable healthcare providers to identify in advance patients who are likely to be high utilizers of imaging services.
Conclusions
Machine learning classifiers developed from narrative radiology reports are feasible methods to predict imaging utilization. Such systems can be used to identify high utilizers, inform future image ordering behavior, and encourage judicious use of imaging.
Introduction
Imaging utilization and cost has increased significantly in the last two decades , although it has stabilized more recently . Nevertheless, imaging remains a focus of cost-control efforts. The cost of imaging is currently estimated to be $100 billion annually in the United States . These issues are especially relevant to high-cost imaging technologies such as computed tomography (CT), magnetic resonance imaging, and positron emission tomography . A recent study of imaging utilization in large integrated healthcare systems showed a significant increase in the rate of advanced diagnostic imaging and associated radiation exposure between 1996 and 2010 . The utilization of CT studies increased by 7.8% annually, and tripled during the 15 years examined by the study. Although national data show the growth rate moderating somewhat, there remain concerns about cost and radiation exposure.
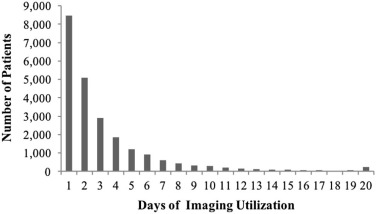
The abdomen is often affected by chronic diseases, such as renal stones and inflammatory bowel disease. Thus, a subset of patients undergoing abdomen-related imaging studies such as abdomen CTs are an appropriate target for the identification of patients at risk for repeated studies, elevated exposure to ionizing radiation, and high costs.
Get Radiology Tree app to read full this article<
Get Radiology Tree app to read full this article<
Materials and Methods
Data Set Construction
Get Radiology Tree app to read full this article<
Get Radiology Tree app to read full this article<
Study Design
Get Radiology Tree app to read full this article<
Get Radiology Tree app to read full this article<
Get Radiology Tree app to read full this article<
Radiology Report Modeling
Get Radiology Tree app to read full this article<
SVM Prediction Model
Get Radiology Tree app to read full this article<
Evaluation and Results
Get Radiology Tree app to read full this article<
TABLE 1
Top Ten Most Common Imaging Procedures and Their Frequencies in Our Data Set
Imaging Procedure Frequency CT abdomen pelvis with contrast 17,419 XR chest two views 10,367 XR chest one view portable 10,310 XR chest one view 6,759 CT abdomen pelvis 5,437 XR abdomen one view 3,394 CT head 3,016 US abdomen 2,772 XR pelvis one view 1,780 US pelvis nonobstetric with transvaginal 1,593
CT, computed tomography; US, ultrasound; XR, radiography.
Get Radiology Tree app to read full this article<
Get Radiology Tree app to read full this article<
Get Radiology Tree app to read full this article<
Get Radiology Tree app to read full this article<
TABLE 2
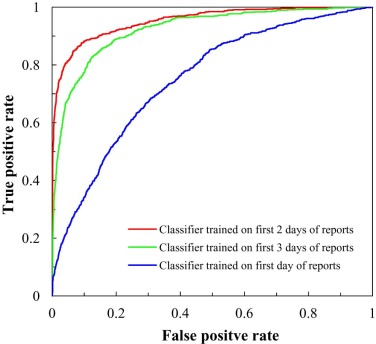
Evaluation Results for Three Classifiers on First Day of Radiology Reports for a Test Set of 4791 Patients
Classifier Accuracy Sensitivity Specificity Positive Predictive Value Negative Predictive Value Trained on first day of report(s) 82.9% 25.5% 94.2% 46.2% 86.6% Trained on first 2 days of reports 94.0% 74.4% 97.9% 87.3% 95.1% Trained on first 3 days of reports 85.5% 84.4% 85.7% 53.6% 96.5%
The shaded row highlights the model with the highest accuracy.
Get Radiology Tree app to read full this article<
Get Radiology Tree app to read full this article<
Get Radiology Tree app to read full this article<
Get Radiology Tree app to read full this article<
TABLE 3
A Contingency Table Showing the Number of TP, FP, TN, FN for Our Best Classifier (Trained on First 2 Days of Reports) on the Test Set
≤5 Days of Imaging Utilization (Low) >5 Days of Imaging Utilization (High) Total (Row) Classifier low outcome (TN)
3920 (FN)
201 4121 Classifier high outcome (FP)
85 (TP)
585 670 Total (Column) 4005 786 4791
FN, false negative; FP, false positive; TN, true negative; TP, true positive.
Get Radiology Tree app to read full this article<
Get Radiology Tree app to read full this article<
TABLE 4
Top 10 Words and Phrases with the Most Predictive Influence in Our Best SVM Classifier (Trained on First 2 Days of Reports)
Rank Predictive Term/Phrase in SVM Model 1 Pelvis 2 Spleen 3 Abdomen 4 Adrenal glands 5 Glandular 6 Pancreas 7 Freed 8 Kidney volumes 9 Adrenalectomies 10 Free fluid
Get Radiology Tree app to read full this article<
Discussion
Get Radiology Tree app to read full this article<
Get Radiology Tree app to read full this article<
Get Radiology Tree app to read full this article<
Get Radiology Tree app to read full this article<
Get Radiology Tree app to read full this article<
Get Radiology Tree app to read full this article<
Get Radiology Tree app to read full this article<
Get Radiology Tree app to read full this article<
Conclusion
Get Radiology Tree app to read full this article<
Acknowledgments
Get Radiology Tree app to read full this article<
References
1. Medicare Payment Advisory Commission : Options to improve Medicare’s payments to physicians. Statement of Glenn M. Hackbarth, Chairman, Medicare Payment Advisory Commission. Available at: http://67.59.137.244/documents/051007_Testimony_MedPAC_physician_payment.pdf Accessed August 25, 2015
2. Levin D.C., Rao V.M., Parker L.: Physician orders contribute to high-tech imaging slowdown. Health Aff (Millwood) 2010; 29: pp. 189-195.
3. Fazel R., Krumholz H.M., Wang Y., et. al.: Exposure to low-dose ionizing radiation from medical imaging procedures. N Engl J Med 2009; 361: pp. 849-857.
4. Bhargavan M., Sunshine J.H.: Utilization of radiology services in the United States: levels and trends in modalities, regions, and populations. Radiology 2005; 234: pp. 824-832.
5. Winter A., Stensland J.: Introduction: expert panel on new research on use of imaging services [Presentation to Medicare Payment Advisory Commission, September 5, 2008]. Available at: http://67.59.137.244/transcripts/imaging%20expert%20panel_Sept%2008_public.pdf Accessed August 25, 2015
6. Iglehart J.K.: Health insurers and medical-imaging policy—a work in progress. N Engl J Med 2009; 360: pp. 1030-1037.
7. Lee D.W., Duszak R., Hughes D.R.: Comparative analysis of Medicare spending for medical imaging: sustained dramatic slowdown compared with other services. AJR Am J Roentgenol 2013; 201: pp. 1277-1282.
8. Lee D.W., Levy F.: The sharp slowdown in growth of medical imaging: an early analysis suggests combination of policies was the cause. Health Aff (Millwood) 2012; 31: pp. 1876-1884.
9. Dodoo M.S., Duszak R., Hughes D.R.: Trends in the utilization of medical imaging from 2003 to 2011: clinical encounters offer a complementary patient-centered focus. J Am Coll Radiol 2013; 10: pp. 507-512.
10. Levin D.C., Rao V.M., Parker L., et. al.: Bending the curve: the recent marked slowdown in growth of noninvasive diagnostic imaging. AJR Am J Roentgenol 2011; 196: pp. W25-W29.
11. America’s Health Insurance Plans (AHIP) : Ensuring quality through appropriate use of diagnostic imaging [white paper]. http://www.medsolutions.com/clinical_quality/facts/AHIP%202008%20Imaging%20Stats.pdf Accessed August 25, 2015
12. Glabman M.: Health plans strain to contain rapidly rising costs of imaging. Managed Care magazine http://www.managedcaremag.com/archives/0501/0501.imaging.html Accessed August 25, 2015
13. Medicare Payment Advisory Commission (MEDPAC) : June 2014: a data book: healthcare spending and the Medicare Program. Available at: http://www.medpac.gov/documents/publications/jun14databookentirereport.pdf Accessed August 25, 2015
14. United States Government Accountability Office : Report to congressional requesters: Medicare Part B imaging services: rapid spending growth and shift to physician offices indicated need for CMS to consider additional management practices GAO-08-452. Government Accountability Office; Available at: http://www.gao.gov/new.items/d08452.pdf Accessed August 25, 2015
15. Smith-bindman R., Miglioretti D.L., Johnson E., et. al.: Use of diagnostic imaging studies and associated radiation exposure for patients enrolled in large integrated health care systems, 1996–2010. JAMA 2012; 307: pp. 2400-2409.
16. Bayati M., Braverman M., Gillam M., et. al.: Data-driven decisions for reducing readmissions for heart failure: general methodology and case study. PLoS ONE 2014; 9: pp. e109264.
17. Fitzgerald M.: Introducing regular expressions.1st ed.2012.O’Reilly MediaSebastopolpp. 13-28.
18. Cortes C., Vapnik V.: Support-vector networks. Mach Learn 1995; 20: pp. 273-297.
19. Manning C.D., Schütze H.: Foundations of statistical natural language processing.1999.MIT PressCambridge 543 pp
20. Chang C.-C., Lin C.-J.: LIBSVM. ACM Trans Intell Syst Technol 2011; 2: pp. 1-27.
21. Chen Y.-W., Lin C.-J.: Combining SVMs with various feature selection strategies.Guyon I.Nikravesh M.Gunn S. et. al.Feature extraction SE—13.2006.Springer BerlinHeidelberg:pp. 315-324.
22. Greene W.H.: Econometric analysis.7th ed.2012.Pearson EducationBostonpp. 803-806.
23. Deng L., Yu D.: Deep learning: methods and applications. Found Trends Signal Processing 2013; 7: pp. 197-387.