
Rationale and Objectives
Before computer-aided detection (CAD) algorithms can be used in clinical practice, they must be shown to improve readers’ diagnostic accuracy over their unaided performance. This is usually accomplished through a large multireader, multicase (MRMC) clinical trial. It is burdensome, however, for an MRMC study to be performed with each new release of a CAD algorithm. The aim of this report is to present an approach for building models to predict readers’ accuracy with a new CAD algorithm.
Materials and Methods
A modeling approach for predicting readers’ results with a new CAD algorithm is described. Multiple-variable logistic regression was used to build models for readers’ sensitivity and false-positive rate, given the results of an MRMC study with an older CAD algorithm and the stand-alone performance results of a new CAD algorithm. Data from a large lung MRMC CAD trial are used to illustrate the modeling approach and test the ability of the models to predict readers’ accuracy with the new CAD algorithm.
Results
The model overestimated the readers’ actual sensitivity with the new CAD algorithm, but this did not reach statistical significance (0.621 vs 0.603, P = .147). The observed and predicted false-positive rates also did not differ significantly (0.275 vs 0.285, P = .250).
Conclusions
Using one clinical study as a test case, it is shown that the modeling approach is feasible. More testing of the approach is needed to determine if and under what circumstances it can be used as an alternative to a full-scale MRMC study. Meanwhile, the approach can be used to determine if a new CAD algorithm is likely to improve readers’ accuracy before embarking on a full-scale MRMC study.
Computer-aided detection (CAD) algorithms have been developed to help physicians find early disease, often missed on standard imaging tests. CAD algorithms have been developed and tested for the detection of breast cancer , colon polyps , vertebral fractures , lung nodules , pulmonary emboli , and intracranial aneurysms . In a typical clinical setting, radiologists first interpret radiographic images without CAD and then apply the CAD algorithm and reevaluate the images given the CAD findings (sequential reading); other times, radiologists view images for the first time with the CAD marks displayed (concurrent reading). Findings found to be suspicious by CAD are sometimes marked by simple equally sized circles surrounding the suspicious area or circles of different sizes depending on the size of the suspected lesion. Newer CAD algorithms often provide readers with adjunct information about why the algorithms identified areas as suspicious.
Before CAD algorithms can be used in clinical practice, they must be shown to improve readers’ diagnostic accuracy over their unaided performance. Clinical trials are conducted to test for an improvement in diagnostic accuracy. These trials often involve 15 to 30 readers who each interpret 100 to 200 patients (some patients with clinically significant lesions and some without, as determined by an independent gold standard ), so-called multireader, multicase (MRMC) studies. Readers’ average sensitivity, specificity, and the area under the receiver-operating characteristic curve without versus with CAD are compared. The large sample sizes are required because the improvement in accuracy with CAD tends to be small (eg, a 0.02–0.05 increase in area under the receiver-operating characteristic curve).
Get Radiology Tree app to read full this article<
Get Radiology Tree app to read full this article<
Materials and methods
Clinical Example
Get Radiology Tree app to read full this article<
Get Radiology Tree app to read full this article<
Get Radiology Tree app to read full this article<
Table 1
Summary of Clinical Trial
Lung CAD trial Goal To estimate and compare the effect of two CAD algorithms on readers’ ability to detect malignant lung nodules on chest x-rays Sample sizes 100 patients with malignant cancers, 100 patients without cancer; 18 readers Measures of test accuracy Sensitivity, specificity, AUC Design Sequential: each image was interpreted without CAD, then the CAD marks were shown and the image was reinterpreted. CAD algorithms were randomized; readers were blinded to CAD algorithm. Gold Standard Pathology, CT Standalone accuracy with older and new CAD RapidScreen version 1.1 ∗ (older algorithm): sensitivity = 0.442, 3.9 FPs OnGuard version 3.0 ∗ (new algorithm): sensitivity = 0.625, 3.3 FPs MRMC study Unaided: sensitivity = 0.598, FPR = 0.268, AUC = 0.707 Older CAD algorithm: sensitivity = 0.602, FPR = 0.275, AUC = 0.702
AUC, area under the receiver-operating characteristic curve; CAD, computer-aided detection; CT, computed tomography; FP, false-positive; FPR, false-positive rate; MRMC, multireader, multicase.
Get Radiology Tree app to read full this article<
Get Radiology Tree app to read full this article<
Prediction Models
Get Radiology Tree app to read full this article<
Get Radiology Tree app to read full this article<
Get Radiology Tree app to read full this article<
Get Radiology Tree app to read full this article<
Get Radiology Tree app to read full this article<
Get Radiology Tree app to read full this article<
Get Radiology Tree app to read full this article<
Get Radiology Tree app to read full this article<
Probx=β0+βX, Probx
=
β
0
+
βX
,
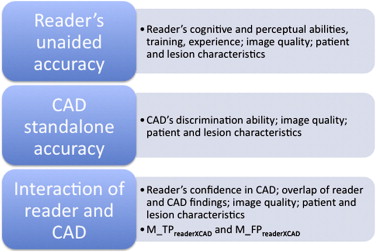
where exp(probx)/[1 + exp(probx)] = Prob(TP reader × CAD X ) or Prob(FP reader × CAD X ), which is the probability that the reader, aided by CAD, correctly detected the true lesion or incorrectly detected a false lesion, respectively, given X . X is a vector of independent variables. Because there were multiple readers interpreting the same image, generalized estimating equations were used to assess the significance of the predictors in the models, accounting for the correlation between readers’ observations.
Get Radiology Tree app to read full this article<
Get Radiology Tree app to read full this article<
Get Radiology Tree app to read full this article<
Get Radiology Tree app to read full this article<
Testing the Effect of CAD on Readers’ Performance
Get Radiology Tree app to read full this article<
Get Radiology Tree app to read full this article<
Get Radiology Tree app to read full this article<
Get Radiology Tree app to read full this article<
Comparing Predicted and Observed Accuracy with the New CAD Algorithm
Get Radiology Tree app to read full this article<
Results
Predicting Reader Performance with the New CAD Algorithm
Get Radiology Tree app to read full this article<
Get Radiology Tree app to read full this article<
Get Radiology Tree app to read full this article<
Probx(TPreader×CAD)ik=3.671−0.025(ifreaderisaradiologist)−3.082(ifreadermissedthelesionwhileunaided)−1.531(ifCADdidnotmarkthelesion)+1.772(ifCADidentifiedlessthanoneFPontheimage)−1.752(ifverysubtlelesion)−0.542(ifmoderatelysubtlelesion)−1.108(ifnoduleisverydense)+0.678(ifreadermissedthenodulewhileunaidedandreaderisaradiologist)−0.223(ifreadermissedthenodulewhileunaidedandnoduleisverysubtle)−1.070(ifreadermissedthenodulewhileunaidedandnoduleismoderatelysubtle)+1.471(ifnoduleisverydenseandCADmissedthenodule)−1.311(ifCADmissedthenoduleandCADFPs<1). Probx
(
TP
reader
×
CAD
)
ik
=
3
.
671
−
0
.
025
(
if
reader
is
a
radiologist
)
−
3
.
082
(
if
reader
missed
the
lesion
while
unaided
)
−
1
.
531
(
if
CAD
did
not
mark
the
lesion
)
+
1
.
772
(
if
CAD
identified
less
than
one
FP
on
the
image
)
−
1
.
752
(
if
very
subtle
lesion
)
−
0
.
542
(
if
moderately
subtle
lesion
)
−
1
.
108
(
if
nodule
is
very
dense
)
+
0
.
678
(
if
reader
missed
the
nodule
while
unaided
and
reader
is
a
radiologist
)
−
0
.
223
(
if
reader
missed
the
nodule
while
unaided
and
nodule
is
very
subtle
)
−
1
.
070
(
if
reader
missed
the
nodule
while
unaided
and
nodule
is
moderately
subtle
)
+
1
.
471
(
if
nodule
is
very
dense
and
CAD
missed
the
nodule
)
−
1
.
311
(
if
CAD
missed
the
nodule
and
CAD
FPs
<
1
)
.
The model for sensitivity had a concordance index of 0.914. The model suggests that the strongest predictor of readers’ accuracy with CAD is their accuracy while unaided. Nodules missed by the reader while unaided were likely to be missed when interpreting the image with CAD, especially if the reader was not a radiologist. When CAD marked the nodule, readers’ sensitivity improved, while the presence of more than one CAD FP mark decreased sensitivity. Very subtle and moderately subtle lesions were less likely to be detected, especially if the reader missed the lesion while unaided. Lower density nodules, missed by CAD, were less likely to be detected by the reader than similarly dense nodules marked by CAD.
Probx(FPreader×CAD)jk=1.279−2.892(ifreaderdidnotidentifyanyFPswhileunaided)+0.677(ifimagequalityisgood)−0.962(ifreaderisaradiologist)−0.753(ifimagequalityisgoodandreaderdidnotidentifyaFPwhileunaided). Probx
(
FP
reader
×
CAD
)
j
k
=
1
.
279
−
2
.
892
(
if
reader
did
not
identify
any
FPs
while
unaided
)
+
0
.
677
(
if
image
quality
is
good
)
−
0
.
962
(
if
reader
is
a
radiologist
)
−
0
.
753
(
if
image
quality
is
good
and
reader
did
not
identify
a
FP
while
unaided
)
.
Get Radiology Tree app to read full this article<
Get Radiology Tree app to read full this article<
Get Radiology Tree app to read full this article<
Comparing Predicted Accuracy with the New CAD Algorithm to Unaided Accuracy
Get Radiology Tree app to read full this article<
Table 2
Comparison of Observed and Predicted Readers’ Accuracy
Observed Unaided Accuracy Observed Accuracy with New CAD Predicted Accuracy with New CAD_P_ Value Comparing Unaided to Predicted Accuracy with New CAD Algorithm_P_ Value Comparing Observed to Predicted Accuracy with New CAD Algorithm Sensitivity 0.598 0.603 0.621 .060 .147 FP rate 0.268 0.285 0.275 .194 .250
CAD, computer-aided detection; FP, false-positive.
Get Radiology Tree app to read full this article<
Comparing Predicted Accuracy with the New CAD Algorithm to Observed Accuracy with the New CAD Algorithm
Get Radiology Tree app to read full this article<
Get Radiology Tree app to read full this article<
Table 3
Comparison of Observed and Predicted False Detection Rates
Reader Detected FP While Unaided Reader Detected No FPs While Unaided Radiologists ( n = 246) ( n = 954) Predicted 0.70 0.07 Observed 0.76 0.07 Nonradiologists ( n = 237) ( n = 363) Predicted 0.85 0.16 Observed 0.86 0.16
FP, false-positive.
Get Radiology Tree app to read full this article<
Get Radiology Tree app to read full this article<
Table 4
Comparison of Observed and Predicted True Detection Rates
Reader Detected Lesion While Unaided Reader Missed Lesion While Unaided Very Subtle Moderately Subtle Obvious Very Subtle Moderately Subtle Obvious CAD marked lesion ( n = 27) ( n = 206) ( n = 575) ( n = 63) ( n = 154) ( n = 73) Predicted 0.78 0.93 0.94 0.13 0.31 0.55 Observed 0.70 0.95 0.94 0.08 0.19 0.33 CAD missed lesion ( n = 96) ( n = 79) ( n = 94) ( n = 336) ( n = 65) ( n = 32) Predicted 0.61 0.87 0.93 0.09 0.14 0.44 Observed 0.80 0.86 0.91 0.05 0.23 0.34
CAD, computer-aided detection.
Get Radiology Tree app to read full this article<
Discussion
Get Radiology Tree app to read full this article<
Get Radiology Tree app to read full this article<
Get Radiology Tree app to read full this article<
Get Radiology Tree app to read full this article<
Get Radiology Tree app to read full this article<
Acknowledgment
Get Radiology Tree app to read full this article<
Get Radiology Tree app to read full this article<
References
1. Noble M., Bruening W., Uhl S., et. al.: Computer-aided detection mammography for breast cancer screening: systematic review and meta-analysis. Arch Gynecol Obstet 2009; 279: pp. 881-890.
2. Ko J.M., Nicholas M.J., Mendel J.B., et. al.: Prospective assessment of computer-aided detection in interpretation of screening mammography. AJR Am J Roentgenol 2006; 187: pp. 1483-1491.
3. Khoo L.A.L., Taylor P., Given-Wilson R.M.: Computer-aided detection in the United Kingdom National Breast Screening Programme: prospective study. Radiology 2005; 237: pp. 444-449.
4. Freer T.W., Ulissey M.J.: Screening mammography with computer-aided detection: prospective study of 12,860 patients in a community breast center. Radiology 2001; 220: pp. 781-786.
5. Warren-Burhenne L.J., Wood S.A., D’Orsi C.J., et. al.: Potential contribution of computer-aided detection to the sensitivity of screening mammography. Radiology 2000; 215: pp. 554-562.
6. Summers R.M., Liu J., Rehani B., et. al.: CT colonography computer-aided polyp detection: effect on radiologist observers of polyp identification by CAD on both the supine and prone scans. Acad Radiol 2010; 17: pp. 948-959.
7. Halligan S., Mallett S., Altman D.G., et. al.: Incremental benefit of computer-aided detection when used as a second and concurrent reader of CT colonographic data: multiobserver study. Radiology 2011; 258: pp. 469-476.
8. Dachman A.H., Obuchowski N.A., Hoffmeister J.W., et. al.: Effect of computer-aided detection for CT colonography in a multireader, multicase trial. Radiology 2010; 256: pp. 827-835.
9. Kasai S., Li F., Shiraishi J., et. al.: Usefulness of computer-aided diagnosis schemes for vertebral fractures and lung nodules on chest radiographs. AJR Am J Roentgenol 2008; 191: pp. 260-265.
10. Brown M.S., Goldin J.G., Rogers S., et. al.: Computer-aided lung nodule detection in CT: results of large-scale observer test. Acad Radiol 2005; 12: pp. 681-686.
11. de Hoop D.W., De Boo H.A., Gietema F., et. al.: Computer-aided detection of lung cancer on chest radiographs: effect on observer performance. Radiology 2010; 257: pp. 532-540.
12. Szucs-Farkas Z., Patak M.A., Yuksel-Hatz S., et. al.: Improved detection of pulmonary nodules on energy-subtracted chest radiographs with a commercial computer-aided diagnosis software: comparison with human observers. Eur Radiol 2010; 20: pp. 1289-1296.
13. MacMahon H., Engelmann R., Behlen F.M., et. al.: Computer-aided diagnosis of pulmonary nodules: results of a large-scale observer test. Radiology 1999; 213: pp. 723-726.
14. Engelke C., Schidt S., Auer F., et. al.: Does computer-assisted detection of pulmonary emboli enhance severity assessment and risk stratification in acute pulmonary embolism?. Clin Radiol 2010; 65: pp. 137-144.
15. Kakeda S., Korogi Y., Arimura H., et. al.: Diagnostic accuracy and reading time to detect intracranial aneurysms on MR angiography using a computer-aided diagnosis system. AJR Am J Roentgenol 2008; 190: pp. 459-465.
16. Hirai T., Korogi Y., Arimura H., et. al.: Intracranial aneurysms at MR angiography: effect of computer-aided diagnosis on radiologists’ detection performance. Radiology 2005; 237: pp. 605-610.
17. Dodd L.E., Wagner R.F., Armato S.G., et. al.: Assessment methodologies and statistical issues for computer-aided diagnosis of lung nodules in computed tomography: contemporary research topics relevant to the lung image database consortium. Acad Radiol 2004; 11: pp. 462-475.
18. Wagner R.F., Beiden S.V., Campbell G., et. al.: Assessment of medical imaging and computer-assist systems: lessons from recent experience. Acad Radiol 2002; 9: pp. 1264-1277.
19. Wagner R.F., Metz C.E., Campbell G.: Assessment of medical imaging systems and computer aids: a tutorial review. Acad Radiol 2007; 14: pp. 723-748.
20. Meziane M., Obuchowski N.A., Lababede O., et. al.: A comparison of follow-up recommendations by chest radiologists, general radiologists, and pulmonologists using computer-aided detection (CAD) to assess radiographs for actionable pulmonary nodules. AJR Am J Roentgenol 2011; 196: pp. W542-W549.
21. Meziane M, Mazzone P, Novak E, et al. A comparison of four versions of a computer-aided detection system for pulmonary nodules on chest radiographs. J Thorac Imaging. In press.
22. Shiraishi J., Abe H., Li F., et. al.: Computer-aided diagnosis for the detection and classification of lung cancers on chest radiographs: ROC analysis of radiologists’ performance. Acad Radiol 2006; 13: pp. 995-1003.
23. Hoffman R., Fiore S.M.: Perceptual (re)learning: a leverage point for human-centered computing. IEEE Intell Syst 2007; 22: pp. 79-83.
24. Robinson P.J.A.: Radiology’s Achilles’ heel: error and variation in the interpretation of the Roentgen image. Br J Radiol 1997; 70: pp. 1085-1098.
25. Miglioretti D.L., Smith-Bindman R., Abraham L., et. al.: Radiologist characteristics associated with interpretative performance of diagnostic mammography. J Natl Cancer Inst 2007; 99: pp. 1854-1863.
26. Jiang Y., Metz C.E.: A quadratic model for combining quantitative diagnostic assessments from radiologist and computer in computer-aided diagnosis. Acad Radiol 2006; 13: pp. 140-151.
27. Gur D., Sumkin J.H.: CAD in screening mammography. AJR Am J Roentgenol 2006; 187: pp. 1474.
28. Paquerault S., Hardy P.T., Wersto N., et. al.: Investigation of optimal use of computer-aided detection systems: the role of the “machine” in decision making process. Acad Radiol 2010; 17: pp. 1112-1121.
29. Liang K.Y., Zeger S.: Longitudinal data analysis using generalized linear models. Biometrika 1986; 73: pp. 13-22.
30. Harrell F., Lee K., Mark D.: Multivariable prognostic models: issues in developing models, evaluating assumptions and adequacy, and measuring and reducing errors. Stat Med 1996; 15: pp. 361-387.
31. Obuchowski N.A., Mazzone P.J., Dachman A.H.: Bias, underestimation of risk, and loss of statistical power in patient-level analyses of lesion detection. Eur Radiol 2010; 20: pp. 584-594.
32. Pencina M.J., D’Agostino R.B., D’Agostino R.B., et. al.: Evaluating the added predictive ability of a new marker: from area under the ROC curve to reclassification and beyond. Stat Med 2008; 27: pp. 157-172.
33. Steyerberg E.W., Eijkemans M.J.C., Harrell F.E.: Prognostic modeling with logistic regression analysis: in search of a sensible strategy for small data sets. Med Decis Making 2001; 21: pp. 45-56.
34. Taylor S.A., Robinson C., Boone D., et. al.: Polyp characteristics correctly annotated by computer-aided detection software but ignored by reporting radiologists during CT colonography. Radiology 2009; 253: pp. 715-723.
35. Manning D.J., Ethell S.C., Donovan T.: Detection or decision errors? Missed lung cancer from the posteroanterior chest radiograph. Br J Radiol 2004; 77: pp. 231-235.