
Rationale and Objective
To develop and evaluate a method for predicting and reducing motion artifacts in free-breathing liver perfusion computed tomography (CT) scanning with couch shuttling and to compare tumor and liver parenchyma perfusion values.
Materials and Methods
Thirty patients (23 males, 7 females, median age of 74 years) with primary or metastatic intrahepatic tumors underwent dynamic contrast enhanced CT scans with axial shuttling. A semiautomatic respiratory motion correction algorithm was applied to align the acquired images along the z-axis. Perfusion maps were generated using the dual-input Johnson-Wilson model. Root mean squared deviation (RMSD) maps of the model fit to the pixel time-density curves were calculated.
Results
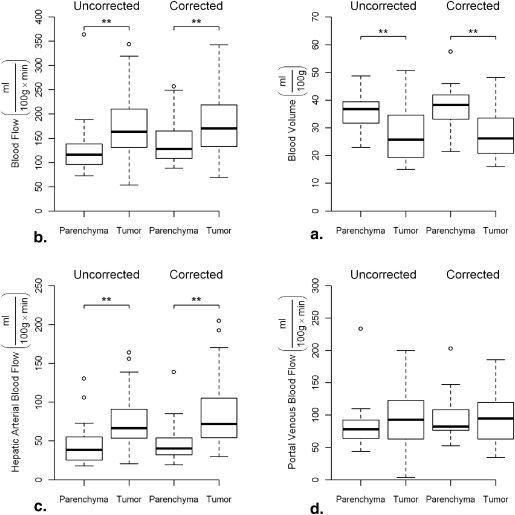
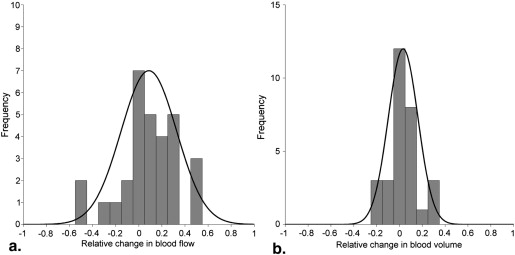
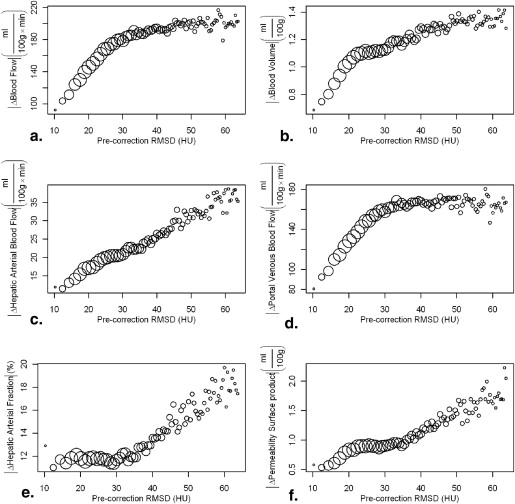
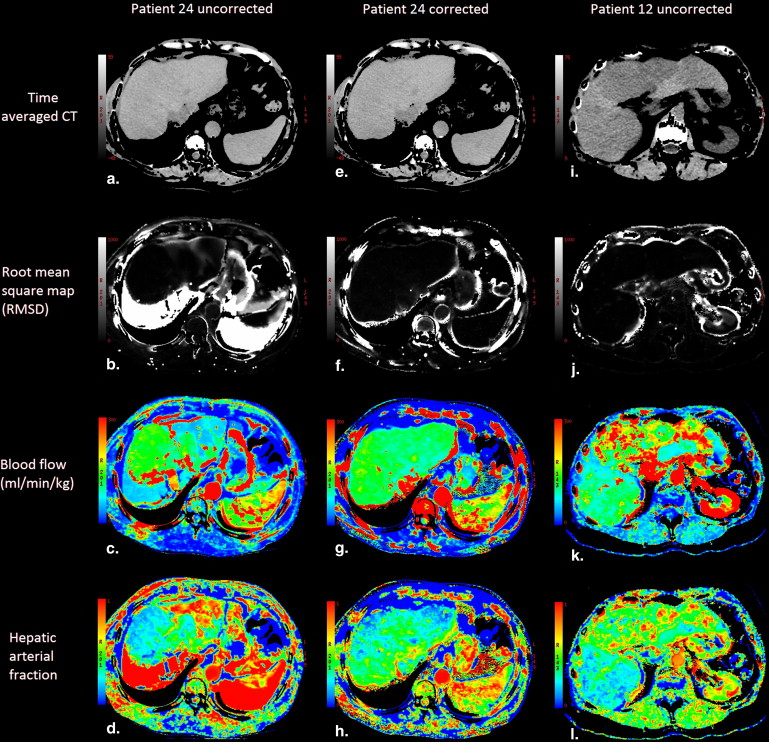
Precorrection RMSD correlated positively with magnitude of change in functional values resulting from motion. Blood flow, arterial blood flow, and permeability surface product were significantly increased in tumor compared to normal tissue ( P < .05), blood volume was significantly reduced in tumor compared to normal tissue ( P < .05). In a subgroup of patients with high-amplitude motion significant difference was observed between uncorrected and motion correction blood flow maps.
Conclusions
Patients can breathe freely during hepatic perfusion imaging if retrospective motion correction is applied to reduce motion artifacts. RMSD provides a regional assessment of motion induced artifacts in liver perfusion maps.
Key points:
1. Allowing patients to breathe freely during liver DCE-CT acquisition is possible if images are corrected for motion before functional maps are generated.
- 4. Get Radiology Tree app to read full this article<
Get Radiology Tree app to read full this article<
Get Radiology Tree app to read full this article<
Get Radiology Tree app to read full this article<
Get Radiology Tree app to read full this article<
Get Radiology Tree app to read full this article<
Get Radiology Tree app to read full this article<
Get Radiology Tree app to read full this article<
Materials and methods
Get Radiology Tree app to read full this article<
Get Radiology Tree app to read full this article<
Get Radiology Tree app to read full this article<
Get Radiology Tree app to read full this article<
Get Radiology Tree app to read full this article<
Get Radiology Tree app to read full this article<
Get Radiology Tree app to read full this article<
Get Radiology Tree app to read full this article<
Get Radiology Tree app to read full this article<
Get Radiology Tree app to read full this article<
Get Radiology Tree app to read full this article<
Results
Get Radiology Tree app to read full this article<
Table 1
Perfusion Parameters in Tumor Versus Normal Tissue
Functional Parameter Normal Tissue Tumor_P_ Value ∗ BF (mlmin⋅100g) (
ml
min
⋅
100
g
) 140 ± 45 182 ± 71 .006 BV (ml100g) (
ml
100
g
) 37 ± 7 28 ± 9 <.001 HAF (%) 33 ± 9 46 ± 11 <.001 PS (mlmin⋅100g) (
ml
min
⋅
100
g
) 13 ± 5 19 ± 9 .002 HABF (mlmin⋅100g) (
ml
min
⋅
100
g
) 47 ± 25 85 ± 44 <.001 PVBF (mlmin⋅100g) (
ml
min
⋅
100
g
) 93 ± 31 97 ± 40 .6
BF, hepatic blood flow; BV, hepatic blood volume; HABF, hepatic arterial blood flow; HAF, hepatic arterial fraction (fraction of total blood flow that is arterial); PS, permeability surface product; PVBF, portal venous blood flow.
Mean perfusion values for entire patient group after motion correction. Values are mean ± standard deviation.
Get Radiology Tree app to read full this article<
Get Radiology Tree app to read full this article<
Get Radiology Tree app to read full this article<
Table 2
Normal Tissue Versus Tumor in Patients with High- and Low-Amplitude Motion
Functional Parameter Motion Normal Tissue Tumor_P_ Value † BF (mlmin⋅100g) (
ml
min
⋅
100
g
) High Uncorrected 150 ± 82 191 ± 73 .10 ∗ Corrected 160 ± 56 222 ± 70 .03 ∗ Low Uncorrected 113 ± 26 166 ± 72 .002 Corrected 130 ± 36 163 ± 64 .03 BV (ml100g) (
ml
100
g
) High Uncorrected 37 ± 6 29 ± 9 .006 Corrected 39 ± 5 31 ± 8 .003 Low Uncorrected 35 ± 6 27 ± 10 <.001 Corrected 37 ± 8 27 ± 10 <.001 HAF (%) High Uncorrected 35 ± 11 50 ± 20 .007 Corrected 29 ± 12 46 ± 12 <.001 Low Uncorrected 34 ± 10 44 ± 9 <.001 Corrected 35 ± 7 47 ± 11 <.001 PS (mlmin⋅100g) (
ml
min
⋅
100
g
) High Uncorrected 19 ± 10 22 ± 14 .21 Corrected 16 ± 6 22 ± 12 .08 Low Uncorrected 12 ± 6 16 ± 8 .01 Corrected 12 ± 3 18 ± 8 .002
BF, hepatic blood flow; BV, hepatic blood volume; HAF, hepatic arterial fraction; PS, permeability surface product.
Values are mean ± standard deviation. Paired t -test was used to determine significance. (fraction of total blood flow that is arterial).
Get Radiology Tree app to read full this article<
Get Radiology Tree app to read full this article<
Get Radiology Tree app to read full this article<
Get Radiology Tree app to read full this article<
Get Radiology Tree app to read full this article<
Get Radiology Tree app to read full this article<
Get Radiology Tree app to read full this article<
Get Radiology Tree app to read full this article<
Get Radiology Tree app to read full this article<
Get Radiology Tree app to read full this article<
Get Radiology Tree app to read full this article<
Discussion
Get Radiology Tree app to read full this article<
Get Radiology Tree app to read full this article<
Get Radiology Tree app to read full this article<
Get Radiology Tree app to read full this article<
Get Radiology Tree app to read full this article<
Get Radiology Tree app to read full this article<
Get Radiology Tree app to read full this article<
Acknowledgments
Get Radiology Tree app to read full this article<
Appendix 1
Get Radiology Tree app to read full this article<
Get Radiology Tree app to read full this article<
Get Radiology Tree app to read full this article<
r=∑nmaxn=1∑mmaxm=1(Refm,n−Ref¯¯¯¯¯)(Testm,n−Test¯¯¯¯¯¯¯)∑nmaxn=1∑mmaxm=1(Refm,n−Ref¯¯¯¯¯)2∑nmaxn=1∑mmaxm=1(Testm,n−Test¯¯¯¯¯¯¯)2√ r
=
∑
n
=
1
n
max
∑
m
=
1
m
max
(
Ref
m
,
n
−
Ref
¯
)
(
Test
m
,
n
−
Test
¯
)
∑
n
=
1
n
max
∑
m
=
1
m
max
(
Ref
m
,
n
−
Ref
¯
)
2
∑
n
=
1
n
max
∑
m
=
1
m
max
(
Test
m
,
n
−
Test
¯
)
2
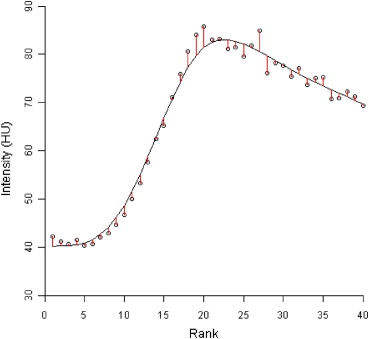
Calculation of two-dimensional discrete cross-correlation coefficient, r = Ref is the selected reference image, and test is the image being tested for correlation.
Get Radiology Tree app to read full this article<
Get Radiology Tree app to read full this article<
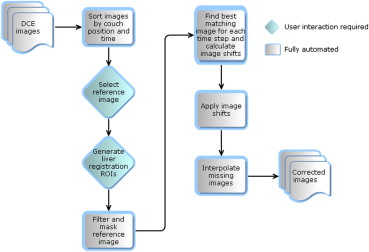
Step 1
Get Radiology Tree app to read full this article<
Step 2
Get Radiology Tree app to read full this article<
Step 3
Get Radiology Tree app to read full this article<
Step 4
Get Radiology Tree app to read full this article<
Step 5
Get Radiology Tree app to read full this article<
References
1. Gatenby R.A., Kessler H.B., Rosenblum J.S., et. al.: Oxygen distribution in squamous cell carcinoma metastases and its relationship to outcome of radiation therapy. Int J Radiat Oncol Biol Phys 1988; 14: pp. 831-838.
2. Law M., Yang S., Wang H., et. al.: Glioma grading: sensitivity, specificity, and predictive values of perfusion MR imaging and proton MR spectroscopic imaging compared with conventional MR imaging. Am J Neuroradiol 2003; 24: pp. 1989-1998.
3. Bentzen S.M.: Theragnostic imaging for radiation oncology: dose-painting by numbers. Lancet Oncol 2005; 6: pp. 112-117.
4. Richardson P.D., Withrington P.G.: Liver blood flow. I. Intrinsic and nervous control of liver blood flow. Gastroenterology 1981; 81: pp. 159-173.
5. Schenk W.G., McDonald J.C., McDonald K., et. al.: Direct measurement of hepatic blood flow in surgical patients: with related observations on hepatic flow dynamics in experimental animals. Ann Surg 1962; 156: pp. 463-471.
6. Breedis C., Young G.: The blood supply of neoplasms in the liver. Am J Pathol 1954; 30: pp. 969-977.
7. Lee T.: Functional CT: physiological models. Trends Biotechnol 2002; 20: pp. S3-S10.
8. Cenic A., Nabavi D.G., Craen R.A., et. al.: Dynamic CT measurement of cerebral blood flow: a validation study. Am J Neuroradiol 1999; 20: pp. 63-73.
9. Cenic A., Nabavi D.G., Craen R.A., et. al.: A CT method to measure hemodynamics in brain tumors: validation and application of cerebral blood flow maps. Am J Neuroradiol 2000; 21: pp. 462-470.
10. Stewart E.E., Chen X., Hadway J., et. al.: Correlation between hepatic tumor blood flow and glucose utilization in a rabbit liver tumor model. Radiology 2006; 239: pp. 740-750.
11. Stewart E.E., Chen X., Hadway J., et. al.: Hepatic perfusion in a tumor model using DCE-CT: an accuracy and precision study. Phys Med Biol 2008; 53: pp. 4249-4267.
12. Suramo I., Paivansalo M., Myllyla V.: Cranio-caudal movements of the liver, pancreas and kidneys in respiration. Acta Radiol Diagn (Stockh) 1984; 25: pp. 129-131.
13. Shimizu S., Shirato H., Xo B., et. al.: Three-dimensional movement of a liver tumor detected by high-speed magnetic resonance imaging. Radiother Oncol 1999; 50: pp. 367-370.
14. Sahani D.V., Holalkere N., Mueller P.R., et. al.: Advanced hepatocellular carcinoma: CT perfusion of liver and tumor tissue–initial experience. Radiology 2007; 243: pp. 736-743.
15. Goetti R., Leschka S., Desbiolles L., et. al.: Quantitative computed tomography liver perfusion imaging using dynamic spiral scanning with variable pitch: feasibility and initial results in patients with cancer metastases. Invest Radiol 2010; 45: pp. 419-426.
16. Ng C.S., Chandler A.G., Wei W., et. al.: Reproducibility of CT perfusion parameters in liver tumors and normal liver. Radiology 2011; 260: pp. 762-770.
17. Miles K.A., Hayball M.P., Dixon A.K.: Functional images of hepatic perfusion obtained with dynamic CT. Radiology 1992; 188: pp. 405-411.
18. Van Beers B.E., Leconte I., Materne R., et. al.: Hepatic perfusion parameters in chronic liver disease: dynamic CT measurements correlated with disease severity. Am J Roentgenol 2001; 176: pp. 667-673.
19. Ippolito D., Sironi S., Pozzi M., et. al.: Perfusion CT in cirrhotic patients with early stage hepatocellular carcinoma: assessment of tumor-related vascularization. Eur J Radiol 2010; 73: pp. 148-152.
20. Saddi K.A., Chefd’hotel C., Cheriet F.: Large deformation registration of contrast-enhanced images with volume-preserving constraint. Proc SPIE 2007; 6512: pp. 651203.
21. Lee T.Y., Purdie T.G., Stewart E.: CT imaging of angiogenesis. Q J Nucl Med 2003; 47: pp. 171-187.
22. Team R.D.C.: R: a language and environment for statistical computing.2011.R Foundation for Statistical ComputingVienna, Austria
23. Meijerink M., van Waesberghe J., van der Weide L., et. al.: Total-liver-volume perfusion CT using 3-D image fusion to improve detection and characterization of liver metastases. Eur Radiol 2008; 18: pp. 2345-2354.
24. Li J.P., Zhao D.L., Jiang H.J., et. al.: Assessment of tumor vascularization with functional computed tomography perfusion imaging in patients with cirrhotic liver disease. Hepatobiliary Pancreat Dis Int 2011; 10: pp. 43-49.
25. Roberts H.C., Roberts T.P., Smith W.S., et. al.: Multisection dynamic CT perfusion for acute cerebral ischemia: the “toggling-table” technique. Am J Neuroradiol 2001; 22: pp. 1077-1080.
26. Shrimpton P., Hillier M., Lewis M., et. al.: Doses from computed tomography (CT) examinations in the UK–2003 review. Chilton 2005; pp. 1-107.
27. Thibault J., Sauer K.D., Bouman C.A., et. al.: A three-dimensional statistical approach to improved image quality for multislice helical CT. Med Phys 2007; 34: pp. 4526-4544.