
Rationale and Objectives
To investigate whether baseline apparent diffusion coefficient (ADC) maps can be employed to predict both infarct core and salvageable ischemic tissue volumes in acute ischemic stroke.
Materials and Methods
An automated image analysis system based on baseline ADC maps was tested against 30 patients with acute ischemic stroke of anterior circulation to predict both infarct core and salvageable ischemic tissue volumes. The predicted infarct core and predicted salvageable ischemic tissue were quantitatively and qualitatively compared with follow-up imaging data in recanalization and no recanalization groups, respectively. Direct comparisons with perfusion- and diffusion- weighted magnetic resonance imaging measures were also made. Wilcoxon signed-rank test, Spearman rank correlation, and Bland-Altman plots were performed.
Results
In the recanalization group, the predicted infarct core volume was significantly correlated with the final infarct volume ( r = 0. 868, P < .001). In the no recanalization group, the predicted final infarct volume (sum of the predicted infarct core and salvageable ischemic tissue volumes), as well as the predicted salvageable ischemic tissue volume, was also significantly correlated with the true final infarct volume ( r = 0.955, P < .001) and infarct growth ( r = 0.918, P < .001), respectively. The volumes of perfusion-diffusion mismatch were significantly larger than those of infarct growth and predicted salvageable ischemic tissue. Good agreement between predicted and true final infarct lesions was visualized by Bland-Altman plots in two groups. Direct visual comparative analysis revealed good qualitative agreement between the true final infarct and predicted lesions in 21 patients.
Conclusion
The proposed ADC based approach may be a feasible and practical tool to predict the volumes of infarct core and salvageable ischemic tissue without intravenous contrast media–enhanced perfusion-weighted imaging at baseline.
The ischemic penumbra is defined as tissue at risk of infarction but with the potential to recover . Current clinical imaging protocol for acute ischemic stroke attempts to identify irreversible injured brain tissue and the ischemic penumbra. Accurate and rapid estimation of the size of these regions during the early therapeutic window will influence the very choice of the most effective therapy and be necessary to estimate the likely benefit after treatment . Currently, multimodal magnetic resonance imaging (MRI) modalities, including diffusion-weighted imaging (DWI), dynamic susceptibility contrast-enhanced perfusion-weighted imaging (DSC-PWI), and magnetic resonance angiography (MRA) are recommended by the guidelines as the most clinically useful tools to characterize the ischemic deficit in a clinical setting . The mismatch between a larger lesion on DSC-PWI and a smaller lesion on DWI has been widely used to mirror the ischemic penumbra, and the concept of the penumbra has been represented by that of PWI-DWI mismatch .
However, the PWI-DWI mismatch model suffers from several serious drawbacks and has been greatly challenged . First, DWI abnormal areas, which are widely used as routine protocols to delineate irreversibly infarct tissues in the PWI-DWI mismatch model, may still be viable and reversible . In addition, DWI signal intensity depends on variable factors such as confounding T2 effects and diffusion rate of water molecules. Second, it has not been determined yet which DSC-PWI parameter most closely identifies tissue at risk . The PWI abnormal areas cannot reliably distinguish the penumbral tissue from oligemia. Consequently, the putative ischemic penumbra is in rather crude estimates and may be overestimated, which may result in overtreatment of thrombolysis . Furthermore, DSC-PWI requires intravenous contrast agent injection, is invasive and tedious in limited time scheme of acute ischemic stroke, and is contraindicated in cases of severe renal insufficiency. Although arterial spin labeling can be used to measure perfusion deficits noninvasively, it is usually used for imaging cerebral blood flow. Cerebral blood flow is more difficult to be visually interpreted as prolonged mean transit time (MTT) obtained by DSC-PWI , as recommended by the guidelines for acute stroke imaging . Cerebral blood flow also has lower intrinsic signal to noise than MTT for accurate volume measurement . Finally, volume measurements of the DWI and PWI lesions for quantifying the mismatch are currently performed through manual outlining, which is tedious and unreliable among observers, and may in turn lead to inaccurate clinical characterization of the individual patient and underpowered clinical trials . Thus, overcoming these drawbacks may require standardized and automatic approaches to obviate the need for manually delineating the volumes.
Get Radiology Tree app to read full this article<
Get Radiology Tree app to read full this article<
Materials and methods
Patients
Get Radiology Tree app to read full this article<
Imaging
Get Radiology Tree app to read full this article<
Get Radiology Tree app to read full this article<
Get Radiology Tree app to read full this article<
Quantitative Analysis
Predicted volumes through ADC-based method
Get Radiology Tree app to read full this article<
Get Radiology Tree app to read full this article<
Get Radiology Tree app to read full this article<
Lesion volume through manually drawing regions of interest
Get Radiology Tree app to read full this article<
Get Radiology Tree app to read full this article<
Qualitative Analysis
Get Radiology Tree app to read full this article<
Statistical Analyses
Get Radiology Tree app to read full this article<
Get Radiology Tree app to read full this article<
Get Radiology Tree app to read full this article<
Results
Patients
Get Radiology Tree app to read full this article<
Get Radiology Tree app to read full this article<
Get Radiology Tree app to read full this article<
Get Radiology Tree app to read full this article<
Table 1
Patient Data of Recanalization Group
Baseline Volumes (mL) Follow-up Volumes (mL) Patient No. Age (y) Sex Treatment Vol IR Vol DWI Vol final 1 45 M IA 2.26 4.18 4.60 2 71 M IV 0.82 1.90 5.68 3 68 M — 12.35 12.35 15.54 4 45 F IA 27.59 23.26 65.26 5 68 M IA 19.39 39.25 34.97 6 47 M IA 5.68 10.06 8.16 7 70 F — 13.41 11.46 16.84 8 73 F IA 1.83 1.70 2.00 9 48 M IA 16.83 26.17 20.04 10 44 F — 10.60 9.96 10.66 11 57 M IV 0.63 1.82 3.68 12 73 M IV 3.66 3.74 3.93 13 70 F — 13.23 17.25 19.30 14 41 F IV 1.64 4.08 3.04 15 40 M IV 5.84 6.30 7.10 16 62 F IV 3.37 6.24 25.00 17 61 F IV 1.92 4.32 4.74 18 74 M IV 0.47 4.39 0.84 19 70 F IV 4.31 4.67 6.25
Vol IR , predicted infarct core volume; Vol DWI , baseline diffusion-weighted imaging lesion volume; Vol Final , final infarct volume.
Table 2
Patient Data of No Recanalization Group
Baseline Volumes
(mL) Follow-up Volumes (mL) Patient No. Age (y) Sex Treatment Vol IR Vol TR Vol IR+TR Vol DWI Vol PWI Vol PWI-DWI Vol final Vol IG 20 51 M IV 8.00 5.63 13.63 7.22 152.42 145.19 11.40 4.18 21 51 M — 1.73 7.31 9.04 2.80 12.40 9.61 2.27 −0.52 ∗ 22 55 M IA 7.59 8.71 16.30 8.84 155.21 146.36 16.48 7.63 23 53 M — 10.76 13.54 24.30 10.02 123.92 113.91 24.08 14.06 24 52 M IV 56.58 47.33 103.91 56.56 117.84 61.29 93.82 37.26 25 45 M — 26.32 52.73 79.05 29.87 288.40 258.54 87.06 57.19 26 51 M — 3.78 3.71 7.49 5.26 54.44 49.18 3.12 −2.13 ∗ 27 65 F — 7.56 6.36 13.92 10.94 224.22 213.28 15.08 4.14 28 59 M — 12.89 23.63 36.52 24.02 270.32 246.30 42.66 18.64 29 60 M IV 6.70 8.66 15.36 8.48 168.14 159.66 14.10 5.62 30 43 M IV 1.59 2.37 3.96 2.03 70.39 68.36 5.15 3.12
Vol IR , predicted infarct core volume; Vol TR , predicted salvageable ischemic tissue volume; Vol IR+TR , the sum of predicted infarct core and predicted salvageable ischemic tissue volumes; Vol DWI , baseline diffusion-weighted imaging lesion volume; Vol PWI , baseline perfusion-weighted imaging lesion volume; Vol PWI-DWI , difference between baseline PWI lesion and baseline DWI lesion; Vol Final , final infarct volume; Vol IG , infarct growth volume.
Get Radiology Tree app to read full this article<
Get Radiology Tree app to read full this article<
Quantitative Analysis
Predicted infarct core volume versus final infarct volume
Get Radiology Tree app to read full this article<

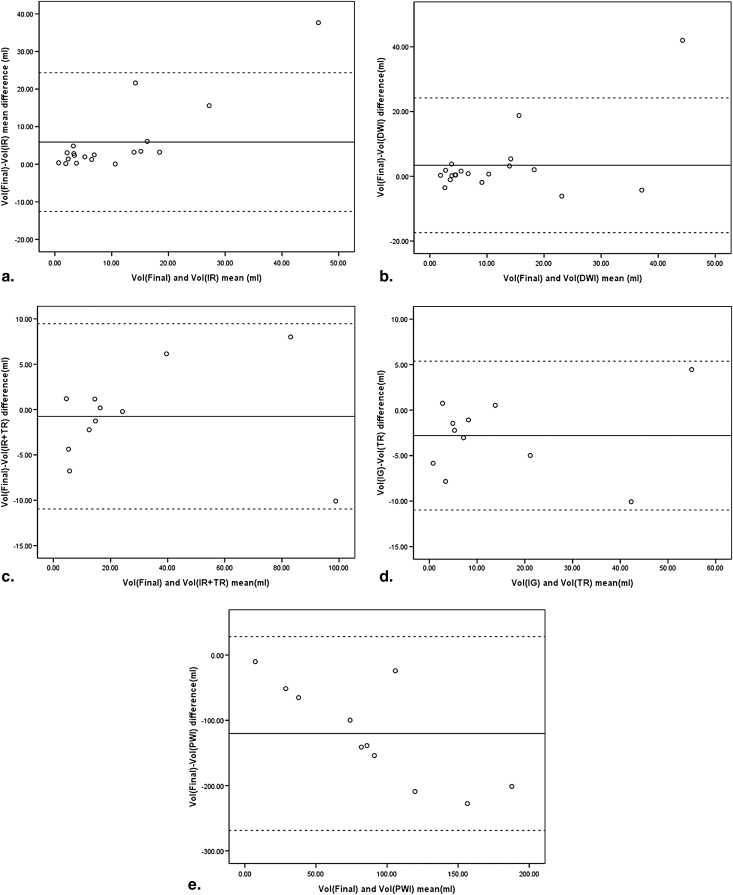
Get Radiology Tree app to read full this article<
Baseline DWI volume versus final infarct volume
Get Radiology Tree app to read full this article<
Predicted salvageable ischemic tissue volume versus infarct growth volume
Get Radiology Tree app to read full this article<
PWI-DWI mismatch volume versus infarct growth volume
Get Radiology Tree app to read full this article<
Qualitative Visual Analysis
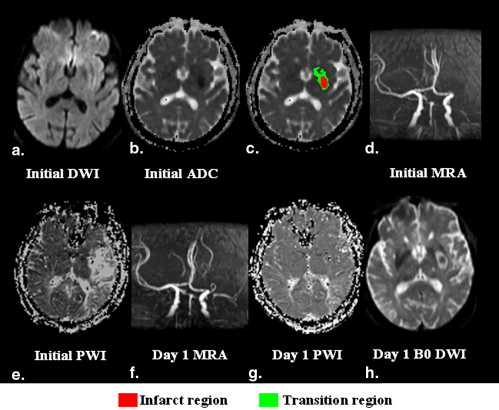
Predicted infarct core versus final infarct lesion in recanalization group
Get Radiology Tree app to read full this article<
Predicted infarct core and salvageable ischemic tissue versus final infarct lesion in no recanalization group
Get Radiology Tree app to read full this article<
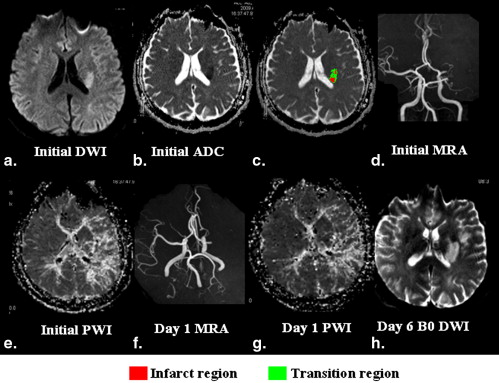
Get Radiology Tree app to read full this article<
Discussion
Get Radiology Tree app to read full this article<
Infarct Core: ADC-based Approach versus Baseline DWI
Get Radiology Tree app to read full this article<
Ischemic Salvageable Ischemic Tissue: ADC-based Approach versus PWI/DWI Data
Get Radiology Tree app to read full this article<
Qualitative Agreement: ADC-based Approach versus Follow-up Data
Get Radiology Tree app to read full this article<
Comparison with Previous Studies
Get Radiology Tree app to read full this article<
Table 3
Comparison with Previous Studies using ADC to Predict Salvageable Ischemic Tissue
Paper Determination of Infarct Core Volume at Baseline Semi- or Fully Automated Processing Time (min.) Group or Individual Level Comparison with PWI-DWI Mismatch Data Statistical Analysis of Volumes Results Present study Automated segmentation of the baseline ADC Fully automated 1 Individual level Provided Wilcoxon
Spearman
Bland-Altman plots_r_ = 0.868 for predicted infarct core volume;
r = 0.918 for predicted salvageable ischemic tissue Montiel Manual segmentation of the baseline DWI Semi automated <10 Group level Not provided Spearman_r_ = 0.65 for predicted infarct growth Rosso Manual segmentation of the baseline DWI Semi automated 10 Group level Not provided Spearman_r_ = 0.828 or 0.777 for predicted final infarct volume;
r = 0.506 or 0.479 for predicted infarct growth
ADC, apparent diffusion coefficient; DWI, diffusion-weighted imaging; PWI, perfusion-weighted imaging.
Get Radiology Tree app to read full this article<
Limitations of the Study
Get Radiology Tree app to read full this article<
Conclusions
Get Radiology Tree app to read full this article<
Acknowledgments
Get Radiology Tree app to read full this article<
Get Radiology Tree app to read full this article<
References
1. Astrup J., Siesjo B., Symon L.: Threshold in cerebral ischemia: the ischemic penumbra. Stroke 1981; 12: pp. 723-725.
2. Hackney D.B.: Does MR imaging improve precision in stroke thrombolysis trials?. Radiology 2007; 244: pp. 323-324.
3. Schiemanck S.K., Post M.W., Kwakkel G., et. al.: Ischemic lesion volume correlates with long-term functional outcome and quality of life of middle cerebral artery stroke survivors. Restor Neurol Neurosci 2005; 23: pp. 257-263.
4. Albers G.W., Thijs V.N., Wechsler L., et. al.: DEFUSE investigators magnetic resonance Imaging profiles predict clinical response to early reperfusion: the diffusion and perfusion imaging evaluation for understanding stroke evolution (DEFUSE) study. Ann Neurol 2006; 60: pp. 508-517.
5. Adams H.P., Zoppo G.D., Alberts M.J., et. al.: Guidelines for the early management of adults with ischemic stroke: a guidelines from the American Heart Association/American Stroke Association Stroke Council, Clinical Cardiology Council, Cardiovascular Radiology and Intervention Council, and the Atherosclerotic Peripheral Vascular Disease and Quality of Care Outcomes in Research Interdisciplinary Working Groups: The American Academy of Neurology affirms the value of this guideline as an educational tool for neurologists. Stroke 2007; 38: pp. 1655-1711.
6. Wintermark M., Alberts G.W., Alexandrov A.V., et. al.: Acute stroke imaging research roadmap. AJNR 2008; 29: pp. E23-E30.
7. Kidwell C.S., Alger J.R., Saver J.L.: Beyond mismatch: evolving paradigms in imaging the ischemic penumbra with multimodal magnetic resonance imaging. Stroke 2003; 34: pp. 2729-2735.
8. Fiehler J., Foth M., Kucinski T., et. al.: Severe ADC decreases do not predict irreversible tissue damage in humans. Stroke 2002; 33: pp. 79-86.
9. Sobesky J., Zaro Weber O., Lehnhardt F.G., et. al.: Which time-to-peak threshold best identifies penumbral flow? A comparison of perfusion-weighted magnetic resonance imaging and positron emission tomography in acute ischemic stroke. Stroke 2004; 35: pp. 2843-2847.
10. Sorensen A.G., Copen W.A., Ostergaard L., et. al.: Hyperacute stroke: simultaneous measurement of relative cerebral blood volume, relative cerebral blood volume, and mean tissue transit time. Radiology 1999; 210: pp. 519-527.
11. Kucinski T., Naumann D., Knab R., et. al.: Tissue at risk is overestimated in perfusion-weighted imaging: MR imaging in acute stroke patients without vessel recanalization. AJNR 2005; 26: pp. 815-819.
12. Wintermark M., Sesay M., Barbier E., et. al.: Comparative overview of brain perfusion imaging techniques. Stroke 2005; 36: pp. e83-e99.
13. Brown G.G., Clark C., Liu T.T.: Measurement of cerebral perfusion with arterial spin labeling: part 2. Applications. J Int Neuropsychol Soc 2007; 13: pp. 526-538.
14. Coutts S.B., Simon J.E., Tomanek A.I., et. al.: Reliability of assessing diffusion-perfusion mismatch. Stroke 2003; 34: pp. 1681-1685.
15. Desmond P.M., Lovell A.C., Rawlinson A.A., et. al.: The value of apparent diffusion coefficient maps in early cerebral ischemia. AJNR 2001; 22: pp. 260-267.
16. Na D.G., Thijs V.N., Albers G.W., et. al.: Diffusion-weighted MR imaging in acute ischemia: value of apparent diffusion coefficient and signal intensity thresholds in predicting tissue at risk and final infarct size. AJNR 2004; 25: pp. 1331-1336.
17. Oppenheim C., Grandin C., Samson Y., et. al.: Is there an apparent diffusion coefficient threshold in predicting tissue viability in hyperacute stroke?. Stroke 2001; 32: pp. 2486-2491.
18. Fiehler J., Knab R., Reichenbach J.R., et. al.: Apparent diffusion coefficient decreases and magnetic resonance imaging perfusion parameters are associated in ischemic tissue of acute stroke patients. J Cereb Blood Flow Metab 2001; 21: pp. 577-584.
19. Hu Q.M., Gao P.Y., Ma L., et. al.: Assessing the existence of ischemic penumbra through automatically analyzing baseline diffusion-weighted imaging. J Cerebr Blood Flow Metab 2009; 29: pp. S600-S601. [abstract]
20. Shimosegawa E., Hatazawa J., Ibaraki M., et. al.: Metabolic penumbra of acute brain infarction: a correlation with infarct growth. Ann Neurol 2005; 57: pp. 495-504.
21. Hoehn-Berlage M., Norris D., Kohno K., et. al.: Evolution of regional changes in apparent diffusion coefficient during focal ischemia of rat brain: the relationship of quantitative diffusion NMR imaging to reduction in cerebral blood flow and metabolic disturbances. J Cerebr Blood Flow Metab 1995; 15: pp. 1002-1011.
22. Davis S.M., Donnan G.A., Parsons M.W., et. al.: Effects of alteplase beyond 3h after stroke in the echoplanar imaging thrombolytic evaluation trial (EPITHET): a placebo-controlled randomized trial. Lancet Neurol 2008; 7: pp. 299-309.
23. Rivers C.S., Wardlaw J.M., Armitage P.A., et. al.: Do acute diffusion- and perfusion- weighted MRI lesions identify final infarct volume in ischemic stroke?. Stroke 2006; 37: pp. 98-104.
24. Montiel N.H., Rosso C., Chupin N.: Automatic prediction of infarct growth in acute ischemic stroke from MR apparent diffusion coefficient maps. Acad Radiol 2008; 15: pp. 77-83.
25. Rosso C., Montiel N.H., Deltour S.: Prediction of infarct growth based on apparent diffusion coefficients: penumbral assessment without intravenous contrast material. Radiology 2009; 250: pp. 184-192.
26. Rivers C.S., Wardlaw J.M., Armitage P.A., et. al.: Acute ischemic stroke lesion measurement on diffusion-weighted imaging-important considerations in designing acute stroke trials with magnetic resonance imaging. J Stroke Cerebrovasc Dis 2007; 16: pp. 64-70.
27. Fiehler J., Knudsen K., Kucinski T., et. al.: Predictors of apparent diffusion coefficient normalization in stroke patients. Stroke 2004; 35: pp. 514-519.
28. Kidwell C.S., Saver J.L., Starkman S., et. al.: Late secondary ischemic injury in patients receiving intraarterial thrombolysis. Ann Neurol 2002; 52: pp. 698-703.
29. Schaefer P.W., Barak E.R., Kamalian S., et. al.: Quantitative assessment of core/penumbra mismatch in acute stroke. CT and MR perfusion imaging are strongly correlated when sufficient brain volume is imaged. Stroke 2008; 39: pp. 2986-2992.
30. Luby M., Warach S.: Reliability of MR perfusion-weighted and diffusion-weighted imaging mismatch measurement methods. AJNR 2007; 28: pp. 1674-1678.