
Rationale and Objectives
To investigate the accuracy of M staging (staging of metastatic disease) in esophageal carcinoma based on a visual interpretation and based on tumor volume measurements on positron emission tomography (PET) computed tomography (CT).
Materials and Methods
Fifty-nine untreated patients with gastroesophageal junction tumors were enrolled, including 36 subcardial gastric tumors (type III according to Siewert classification) and 23 adenocarcinomas of the cardia (AEG, type II Siewert). Patients were grouped in metastasis free (M0 stage, n = 34) and metastatic stages (M1 stage, n = 25). Tumor volume and mean and maximum standardized uptake value were measured on PET-CT. The accuracy of these quantitative tumor volume parameters in distinguishing metastasis-free tumors (M0 stage) from metastatic stages (M1 stage) was compared to the accuracy of a visual analysis with fused PET-CT. Furthermore, accuracy of PET-CT was compared to PET reviewed side by side with CT in a lesion-based analysis of 84 distant metastatic sites.
Results
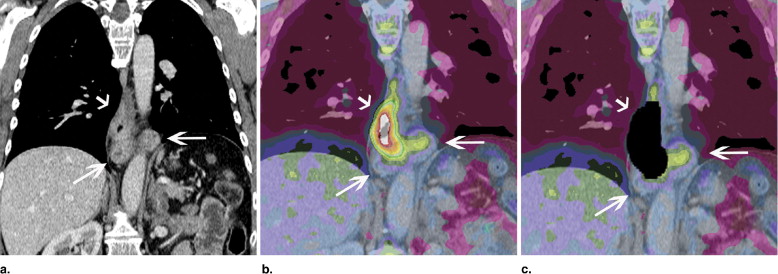
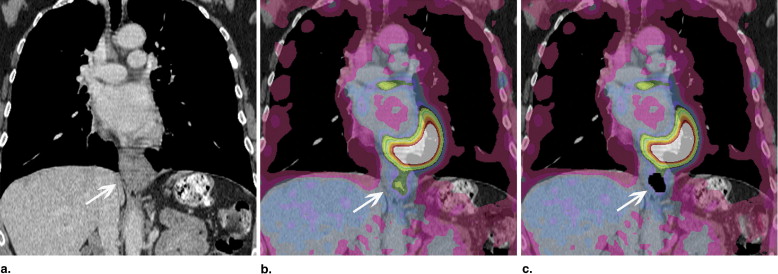
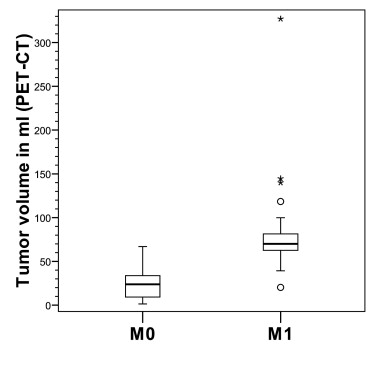
In the visual interpretation, PET-CT (accuracy 88%, 74/84) was more accurate than PET (accuracy 78%, 66/84; P = .008) in characterizing the 84 potential metastatic sites in the 59 patients. Among the tumor parameters, the PET-CT tumor volume was the most accurate predictor of M1 stage and overall survival. With a threshold of 39 mL, PET-CT volume was able to predict M1 stage disease with a sensitivity of 96% and a specificity of 85%. The accuracy of M-staging was increased further when combining tumor volume measurements with the results from the visual analysis (combined results: sensitivity 96%, specificity 94%).
Conclusions
PET-CT was more accurate than PET (reviewed side by side with CT) in characterizing distant metastatic sites of gastroesophageal junction carcinomas. The highest accuracy for M-staging was obtained when combining the results of the visual analysis with the results from primary tumor volume measurements. Primary tumor volume was shown to be an independent prognostic factor.
Tumors of the gastroesophageal junction (GEJ) and distal esophagus are mostly classified according to location: type I (adenocarcinoma of the distal esophagus), type II (true carcinoma of the cardia and GEJ), and type III (subcardial gastric carcinoma that infiltrates the GEJ) ( ). The incidence of GEJ tumors is increasing and the prognosis remains poor with a 5-year survival of 15%–40% ( ). The presence of metastatic tumor spread is an important predictor of survival and determines the therapeutic approach in gastroesophageal tumors ( ). Metastatic disease can be assessed by a variety of modalities, including endoscopic ultrasound (EUS), computed tomography (CT), positron emission tomography (PET), and combined PET-CT. The most important clinical question for pretherapy staging is to determine patients with incurable due to distant metastasis (M1 disease). Patients with distant metastases do not benefit from a curable approach and are best served with palliative care. The present study investigates the advantage of a visual analysis on fused PET-CT over that on PET (reviewed side by side with CT) for the differentiation of distant metastatic disease (M1) from metastasis-free stages (M0). Furthermore, it was evaluated whether primary tumor volume parameters can be used to differentiate M0 from M1 tumors. Several studies have shown that the degree of the local extent of the primary tumor is predictive of metastatic spread. It is the extent of tumor both in axial and longitudinal dimension that is associated with metastatic disease and prognosis ( ). Therefore, primary tumor volume, a variable that considers axial and longitudinal progression, might be the most accurate predictor of tumor spread and metastatic disease. Studies on radiation treatment planning suggest that tumor volume might be measured more accurately with combined PET-CT than with conventional modalities becasue PET-CT provides both metabolic and anatomic information ( ). The aim of the present investigation was to investigate whether tumor volume is associated with tumor stage and can help to predict metastatic disease and overall survival.
Methods and materials
Patients
Study subjects were 59 patients with adenocarcinomas of the GEJ, including 36 patients with subcardial gastric carcinomas (type III according to the Siewert classification) and 23 patients with tumors of the cardia (type II Siewert) ( ). The study was compliant with the Health Insurance Portability and Accountability Act, and approval from the institutional review board was obtained.
Get Radiology Tree app to read full this article<
Table 1
Demographic Data in Metastasis-Free (M0 or Stage I–III) and Metastatic Disease (M1)
Sex Male Age (y) Weight (lb) Height (cm) Glucose (mg/dL) Histology: AEG II; Gastric (AEG III) Site: GE Junction; Gastric M0 ( n = 34) 26 (77%) 65.1 ± 12.6 173.1 ± 35.0 171.7 ± 10.9 108.6 ± 12.5 10 (29%); 10 (29%); 24 (71%) 24 (71%) M1 ( n = 25) 16 (64%) 66.1 ± 8.6 171.1 ± 32.2 170.4 ± 7.4 109.6 ± 12.7 13 (52%); 13 (52%); 12 (48%) 12 (48%) Differences_P_ = .39 ⁎ t = −0.32;t = 0.23t = 0.50t = −0.31P = .11 ⁎ P = .11 ⁎ P = .75 † P = .82 † P = .62 † P = .76 †
AEG II, type II adenocarcinoma of the esophagogastric (AEG) junction based on the Siewert classification (1); GE, gastroesophageal; gastric, gastric carcinoma.
Get Radiology Tree app to read full this article<
Get Radiology Tree app to read full this article<
Get Radiology Tree app to read full this article<
PET-CT Imaging
Get Radiology Tree app to read full this article<
Characterization of Metastatic Sites Based on Visual Analysis
Get Radiology Tree app to read full this article<
Assessing Risk of Metastatic Spread (M1 Stage) Based on Primary Tumor Volume Measurements
Get Radiology Tree app to read full this article<
Get Radiology Tree app to read full this article<
Get Radiology Tree app to read full this article<
Data Analysis and Statistics
Get Radiology Tree app to read full this article<
Results
Association between Tumor Volume Parameters and Risk of Metastatic Disease
Get Radiology Tree app to read full this article<
Table 2
Differentiation of M1 Stage (metastatic) from M0 Stage (metastasis-free) Based on Primary Tumor Volume
PET-CT PET SUV Max Volume (mL) SUV of Volume Volume (mL) SUV of Volume M0 ( n = 34) 24.7 ± 16.8 4.1 ± 1.0 29.7 ± 24 3.9 ± 0.9 7.7 ± 3.3 M1 ( n = 25) 84.7 ± 58 5.3 ± 1.7 94.5 ± 69.2 5.1 ± 1.7 10.6 ± 4.1 Differences_Z_ = −5.9 ⁎ t = −3.5 † Z = −5.5 ⁎ t = −3.7 † t = −3.0 † P < .001P = .001P < .001P = .001P = .004 AUC 0.954 0.741 0.922 0.744 0.718 Threshold 39.0 SUV 4.7 41 SUV 4.2 SUV 7.8 Sensitivity 96% 60% 96% 60% 88% Specificity 85% 71% 82% 68% 56%
AUC, area under the curve; CT, computed tomography; PET, position emission tomography; SUV, standardized uptake value.
Tumor volume and mean SUV were measured both on PET-CT and PET.
Get Radiology Tree app to read full this article<
Get Radiology Tree app to read full this article<
Get Radiology Tree app to read full this article<
Get Radiology Tree app to read full this article<
Prediction of a Metastatic Stage (M1 Stage) Based on a Combination of a Visual Analysis and Tumor Volume Measurements
Get Radiology Tree app to read full this article<
Table 3
Differentiation of Metastatic from Metastasis-free Stages Based on a Visual Analysis, Based on Tumor Volume Measurements and Based on a Combination of Both
M Staging (M0 vs. M1) PET-CT PET Visual Analysis Volume (>39 mL) Combination of Both ( ⁎ combination Score ≥1) Visual Analysis Volume (>41 mL) Combination of Both ( ⁎ combination Score ≥1) Sensitivity 80% 96% 96% 72% 96% 96% Specificity 97% 85% 94% 91% 82% 88%
CT, computed tomography; PET, position emission tomography.
Get Radiology Tree app to read full this article<
Table 4
Definition of the Combination Score for the Differentiation of Metastatic from Metastasis-free Stages Based on a Combination of a Visual Interpretation (qualitative interpretation) and Tumor Volume Measurements (quantitative interpretation)
M staging (M0 vs. M1) Visual Interpretation Quantitative Interpretation (with tumor volume) Combination of Both: Combination Score: PET-CT M0 disease M1 disease ≤59 mL 59 mL Maximum score = 2 Score = 0 Score = 1 Score = 0 Score = 1 PET M0 disease M1 disease ≤60 mL >60 mL Maximum score = 2 Score = 0 Score = 1 Score = 0 Score = 1
CT, computed tomography; PET, position emission tomography.
Get Radiology Tree app to read full this article<
Accuracy of PET-CT Compared to PET in a Lesion-Based Analysis of Distant Metastatic Sites
Get Radiology Tree app to read full this article<
Table 5
Accuracy of PET-CT Compared to PET (reviewed side by side with CT) in Identifying Metastatic Sites Based on a Visual Analysis
PET-CT PET Distant Metastatic Sites Visual Analysis Visual Analysis Sensitivity 79% (36/45) 65% (29/45) Specificity 97% (38/39) 94% (37/39) PPV 97% (36/37) 94% (29/31) NPV 81% (38/47) 70 % (37/53) Accuracy 88% (74/84) 78% (66/84)
CT, computed tomography; NPV, negative predictive value; PET, position emission tomography; PPV, positive predictive value.
Get Radiology Tree app to read full this article<
Tumor Volume Predicts Overall Survival
Get Radiology Tree app to read full this article<
Discussion
Get Radiology Tree app to read full this article<
Get Radiology Tree app to read full this article<
Get Radiology Tree app to read full this article<
Get Radiology Tree app to read full this article<
Get Radiology Tree app to read full this article<
References
1. Siewert J.R., Stein H.J.: Classification of adenocarcinoma of the oesophagogastric junction. Br J Surg 1998; 85: pp. 1457-1459.
2. Botterweck A.A., Schouten L.J., Volovics A., et. al.: Trends in incidence of adenocarcinoma of the oesophagus and gastric cardia in ten European countries. Int J Epidemiol 2000; 29: pp. 645-654.
3. Devesa S.S., Blot W.J., Fraumeni F.J.: Changing patterns in the incidence of esophageal and gastric carcinoma in the United States. Cancer 1998; 83: pp. 2049-2053.
4. Ellis F.H., Heatley G.J., Krasna M.J., et. al.: Esophagogastrectomy for carcinoma of the esophagus and cardia: a comparison of findings and results after standard resection in three consecutive eight-year intervals with improved staging criteria. J Thorac Cardiovasc Surg 1997; 113: pp. 836-846.
5. Lagarde S.M., ten Kate F.J., Reitsma J.B., et. al.: Prognostic factors in adenocarcinoma of the esophagus or gastroesophageal junction. J Clin Oncol 2006; 24: pp. 4347-4355.
6. Rice T.W., Blackstone E.H., Adelstein D.J., et. al.: Role of clinically determined depth of tumor invasion in the treatment of esophageal carcinoma. J Thorac Cardiovasc Surg 2003; 125: pp. 1091-1102.
7. Hong R., Halama J., Bova D., et. al.: Correlation of PET standard uptake value and CT window-level thresholds for target delineation in CT-based radiation treatment planning. Int J Radiat Oncol Biol Phys 2007; 67: pp. 720-726.
8. Leong T., Everitt C., Yuen K., et. al.: A prospective study to evaluate the impact of FDG-PET on CT-based radiotherapy treatment planning for oesophageal cancer. Radiother Oncol 2006; 78: pp. 254-261.
9. Nestle U., Kremp S., Schaefer-Schuler A., et. al.: Comparison of different methods for delineation of 18F-FDG PET-positive tissue for target volume definition in radiotherapy of patients with non-small cell lung cancer. J Nucl Med 2005; 46: pp. 1342-1348.
10. Konski A., Doss M., Milestone B., et. al.: The integration of 18-fluoro-deoxy-glucose positron emission tomography and endoscopic ultrasound in the treatment-planning process for esophageal carcinoma. Int J Radiat Oncol Biol Phys 2005; 61: pp. 1123-1128.
11. Bruzzi F., Swisher S.G., Truong M.T., et. al.: Detection of interval distant metastases. Cancer 2007; 109: pp. 125-134.
12. Cerfolio R.J., Bryant A.S., Ohja B., et. al.: The accuracy of endoscopic ultrasonography with fine-needle aspiration, integrated positron emission tomography with computed tomography, and computed tomography in restaging patients with esophageal cancer after neoadjuvant chemoradiotherapy. J Thorac Cardiovasc Surg 2005; 129: pp. 1232-1241.
13. Reed C.E.: Surgical management of esophageal carcinoma. Oncologist 1999; 4: pp. 95-105.
14. Flamen P., Lerut A., Van Cutsem E., et. al.: Utility of positron emission tomography for the staging of patients with potentially operable esophageal carcinoma. J Clin Oncol 2000; 18: pp. 3202-3210.
15. Heeren P.A., Jager P.L., Bongaerts F., et. al.: Detection of distant metastases in esophageal cancer with (18)F-FDG PET. J Nucl Med 2004; 45: pp. 980-987.
16. Liberale G., Van Laethem J.L., Gay F., et. al.: The role of PET scan in the preoperative management of oesophageal cancer. Eur J Surg Oncol 2004; 30: pp. 942-947.
17. Meltzer C.C., Luketich J.D., Friedman D., et. al.: Whole-body FDG positron emission tomographic imaging for staging esophageal cancer comparison with computed tomography. Clin Nucl Med 2000; 25: pp. 882-887.
18. McAteer D., Wallis F., Couper G., et. al.: Evaluation of 18F-FDG positron emission tomography in gastric and oesophageal carcinoma. Br J Radiol 1999; 72: pp. 525-529.
19. Kole A., Plukker J., Nieweg O., et. al.: Positron emission tomography for staging of oesophageal and gastroesophageal malignancy. Br J Cancer 1998; 78: pp. 521-527.
20. van Westreenen H.L., Westerterp M., Bossuyt P.M., et. al.: Systematic review of the staging performance of 18F-fluorodeoxyglucose positron emission tomography in esophageal cancer. J Clin Oncol 2004; 22: pp. 3805-3812.
21. Jadvar H., Henderson R.W., Conti P.S.: 2-deoxy-2-[F-18]fluoro-D-glucose-positron emission tomography/computed tomography imaging evaluation of esophageal cancer. Mol Imaging Biol 2006; 8: pp. 193-200.