
Rationale and Objectives
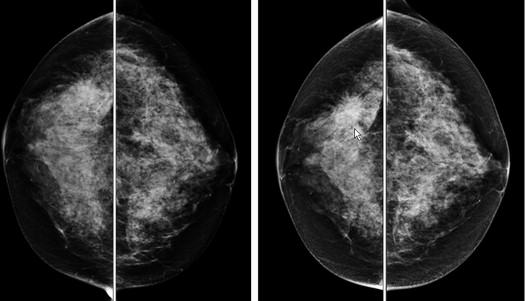
The objective of this study is to investigate the feasibility of predicting near-term risk of breast cancer development in women after a negative mammography screening examination. It is based on a statistical learning model that combines computerized image features related to bilateral mammographic tissue asymmetry and other clinical factors.
Materials and Methods
A database of negative digital mammograms acquired from 994 women was retrospectively collected. In the next sequential screening examination (12 to 36 months later), 283 women were diagnosed positive for cancer, 349 were recalled for additional diagnostic workups and later proved to be benign, and 362 remain negative (not recalled). From an initial pool of 183 features, we applied a Sequential Forward Floating Selection feature selection method to search for effective features. Using 10 selected features, we developed and trained a support vector machine classification model to compute a cancer risk or probability score for each case. The area under the receiver operating characteristic curve and odds ratios (ORs) were used as the two performance assessment indices.
Results
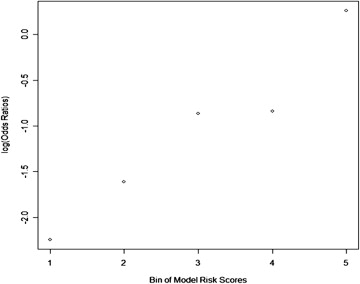
The area under the receiver operating characteristic curve = 0.725 ± 0.018 was obtained for positive and negative/benign case classification. The ORs showed an increasing risk trend with increasing model-generated risk scores (from 1.00 to 12.34, between positive and negative/benign case groups). Regression analysis of ORs also indicated a significant increase trend in slope ( P = .006).
Conclusions
This study demonstrates that the risk scores computed by a new support vector machine model involving bilateral mammographic feature asymmetry have potential to assist the prediction of near-term risk of women for developing breast cancer.
Breast cancer is the most prevalent cancer in women and is a very heterogeneous disease . The majority of breast cancers are detected among women with no known cancer risk factors . Hence, a uniform, population-based mammography screening protocol is currently recommended for all women who are older than the qualifying age. Although scientific evidence has shown that early detection of breast cancer combined with improved treatment strategies has incrementally and significantly reduced patients’ mortality and morbidity rates over the past four decades , interpreting screening mammograms is a difficult task for radiologists due to the large variability of breast abnormalities, overlapping dense fibroglandular tissues (FGTs), and the low cancer detection rate (ie, three to five cancers in 1,000 nonbaseline screening examinations) . These factors substantially reduce the detection sensitivity and specificity of screening mammography . One study reported that during a 10-year period, more than half of screened women will receive at least one false-positive recall, and 7% to 9% will have at least one benign biopsy . In addition to anxiety in women that can cause long-term psychosocial consequences and other side effects of the false-positive recalls due to cumulative radiation exposure and unnecessary biopsies, limited health care resources and associated high costs are other major factors that have to be considered in this issue . Thus, the efficacy of current mammography screening remains controversial . To overcome these limitations, it is desirable to develop personalized screening recommendations based on individualized risk assessment ; this concept has recently been attracting significant research interests . The prerequisite of reaching this goal of establishing a new and more effective personalized cancer screening paradigm is to identify cancer risk factors and/or develop risk prediction models with improved discriminatory power, which aim to stratify women into different risk groups whereby different screening methods and intervals can be recommended.
Studies have shown that with the exception of women’s age and specific gene mutations that apply to a very small fraction of the population, breast density is the strongest and most likely heritable breast cancer risk indicator . A woman with higher breast density has a higher risk of developing breast cancer (between four to six times greater) than another age-matched woman with lower breast density, in her lifetime . As the process of directly detecting and/or measuring actual breast density is difficult, mammographic density measured by the percentage of FGT segmented from mammograms is currently used to report breast density in the breast cancer screening environment. The American College of Radiology has established a Breast Imaging Reporting and Data System (BI-RADS) to rate mammographic density into four categories: (i) almost entirely fatty with percentage of FGT ≤25%, (ii) scattered fibroglandular density (25% < FGT ≤50%), (iii) heterogeneously dense (50% < FGT ≤75%), and (iv) extremely dense (FGT > 75%) . However, subjectively rated mammographic density using BI-RADS has been found unreliable due to considerable interobserver and intraobserver variability among radiologists . To achieve more reliable and consistent mammographic density assessment results, a number of research groups have developed various computerized schemes to detect and quantify mammographic density . In these previous researches, different image features and machine learning-based classifiers were investigated and compared. Studies have reported high correlation [eg, >0.87 (28)] between averaged visual and automated assessments of mammographic density categories (ie, between automated/semiautomated tissue segmentation and BI-RADS ratings).
Get Radiology Tree app to read full this article<
Materials and methods
Image Data Sets
Get Radiology Tree app to read full this article<
Get Radiology Tree app to read full this article<
Get Radiology Tree app to read full this article<
Get Radiology Tree app to read full this article<
Get Radiology Tree app to read full this article<
![Figure 2, Histogram distribution of the three groups of cases (negative, benign, and positive) in four categories of mammographic density (Breast Imaging Reporting and Data System [BI-RADS]) ratings.](https://storage.googleapis.com/dl.dentistrykey.com/clinical/PredictionofNeartermBreastCancerRiskBasedonBilateralMammographicFeatureAsymmetry/1_1s20S1076633213004017.jpg)
Get Radiology Tree app to read full this article<
Computation and Measurement of Image Features to Measure Breast Tissue Asymmetry
Get Radiology Tree app to read full this article<
Table 1
Computed Features According to Grouping or Type, and Their Description/Explanation
Feature Group/Type Feature ID Notes/Description Generic gray value (statistical)–based features, and a fractal dimension feature , ∗ 1-10 Mean, standard deviation, skewness, and kurtosis of pixel values. Fractal dimension feature originally described in Mean and maximum values of gray-level run length–based texture features, computed along 0° and 90° (horizontal and vertical directions) 11-32 Short run emphasis, long run emphasis, low gray level run emphasis, high gray level run emphasis, short run low gray level emphasis, short run high gray level emphasis, long run low gray level emphasis, long run high gray level emphasis, gray level non-uniformity, run length non-uniformity, and run percentage_x_ -axis and y -axis histogram (cumulative projection) features , ∗ 33-52 Mean, standard deviation, skewness, kurtosis, and median values Gray-level co-occurrence matrix-based features ∗ 53-60 Statistics computed from a gray-level co-occurrence matrix (created by calculating how often a pixel with gray-level value i occurs horizontally adjacent to a pixel with value j ), namely:
Contrast=∑i,j|i−j|2p(i,j) Contrast
=
∑
i
,
j
|
i
−
j
|
2
p
(
i
,
j
)
Correlation=∑i,j(i−μi)(j−μj)p(i,j)σiσj Correlation
=
∑
i
,
j
(
i
−
μ
i
)
(
j
−
μ
j
)
p
(
i
,
j
)
σ
i
σ
j
Energy=∑i,jp(i,j)2 Energy
=
∑
i
,
j
p
(
i
,
j
)
2
Homogeneity=∑i,jp(i,j)1+|i−j| Homogeneity
=
∑
i
,
j
p
(
i
,
j
)
1
+
|
i
−
j
| Biological features 181-183 Age, family history, and breast density
Get Radiology Tree app to read full this article<
Get Radiology Tree app to read full this article<
Get Radiology Tree app to read full this article<
Get Radiology Tree app to read full this article<
Get Radiology Tree app to read full this article<
Get Radiology Tree app to read full this article<
Get Radiology Tree app to read full this article<
FASYMM1−60=|fi−gi|max(fi,gi) F
1
−
60
A
S
Y
M
M
=
|
f
i
−
g
i
|
max
(
f
i
,
g
i
)
FASYMM61−120=|fi−gi| F
61
−
120
A
S
Y
M
M
=
|
f
i
−
g
i
|
FASYMM121−180=|fi−gi|3 F
121
−
180
A
S
Y
M
M
=
|
f
i
−
g
i
|
3
Get Radiology Tree app to read full this article<
Get Radiology Tree app to read full this article<
Optimization and Evaluation of a SVM Classifier
Get Radiology Tree app to read full this article<
Get Radiology Tree app to read full this article<
Get Radiology Tree app to read full this article<
Results
Get Radiology Tree app to read full this article<
Get Radiology Tree app to read full this article<
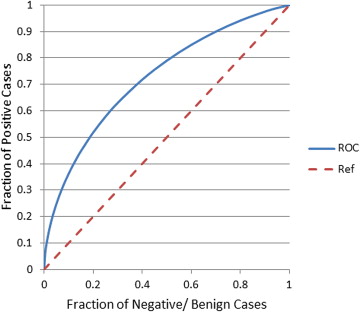
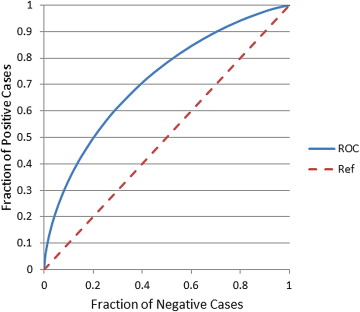
Table 2
Relative, Adjusted Odds Ratios (ORs) and 95% Confidence Intervals (CIs) with Increasing Levels of the Trained Support Vector Machine Classifier-Generated Risk Scores
Subgroup Number of Cases (Positive – Negative/Benign) Adjusted OR 95% CI 1 19 – 180 1.00 Baseline 2 33 – 166 1.88 1.03–3.44 3 59 – 140 3.99 2.28–7.00 4 60 – 139 4.09 2.33–7.17 5 112 – 86 12.34 7.12–21.38
Table 3
Confusion Matrix of Prediction Results Using Our Proposed Method and Obtained by Applying a Threshold of 0.5 on the Classifier-Generated Risk/Probability Scores
Prediction-> Negative/Benign Cases Positive Cases Negative/Benign Cases 570 141 Positive Cases 144 139
Get Radiology Tree app to read full this article<
Get Radiology Tree app to read full this article<
Get Radiology Tree app to read full this article<
Discussion
Get Radiology Tree app to read full this article<
Get Radiology Tree app to read full this article<
Get Radiology Tree app to read full this article<
Get Radiology Tree app to read full this article<
Get Radiology Tree app to read full this article<
Get Radiology Tree app to read full this article<
Get Radiology Tree app to read full this article<
Acknowledgments
Get Radiology Tree app to read full this article<
References
1. Siegel R., Naishadham D., Jemal A.: Cancer statistics, 2013. CA Cancer J Clin 2013; 63: pp. 11-30.
2. Madigan M.P., Ziegler R.G., Benichou J., et. al.: Proportion of breast cancer cases in the United States explained by well-established risk factors. J Natl Cancer Inst 1995; 87: pp. 1681-1685.
3. Amir E., Freedman O.C., Seruga B., et. al.: Assessing women at high risk of breast cancer: a review of risk assessment models. J Natl Cancer Inst 2010; 102: pp. 680-691.
4. Tabar L., Vitak B., Chen H.H., et. al.: Beyond randomized controlled trials: organized mammographic screening substantially reduces breast carcinoma mortality. Cancer 2001; 91: pp. 1724-1731.
5. Smith R.A., Cokkinides V., Brooks D., et. al.: Cancer screening in the United States, 2011: A review of current American Cancer Society guidelines and issues in cancer screening. CA Cancer J Clin 2011; 61: pp. 8-30.
6. Sickles E.A., Wolverton D.E., Dee K.E.: Performance parameters for screening and diagnostic mammography: specialist and general radiologists. Radiology 2002; 224: pp. 861-869.
7. Kopans D.B.: The positive predictive value of mammography. AJR Am J Rotentgenol 1991; 158: pp. 521-526.
8. Fenton J.J., Wheeler J., Carney P.A., et. al.: Reality check: perceived versus actual performance of community mammographers. AJR Am J Rotentgenol 2006; 187: pp. 42-46.
9. Hubbard R.A., Kerlikowske K., Flowers C.I., et. al.: Cumulative probability of false-positive recall or biopsy recommendation after 10 years of screening mammography: a cohort study. Ann Intern Med 2011; 155: pp. 481-492.
10. Brodersen J., Siersma V.D.: Long-term psychosocial consequences of false-positive screening mammography. Ann Fam Med 2013; 11: pp. 106-115.
11. Yaffe M.J., Mainprize J.G.: Risk of radiation-induced breast cancer from mammographic screening. Radiology 2011; 258: pp. 98-105.
12. Buist D.S., Anderson M.L., Haneuse S.J., et. al.: Influence of annual interpretive volume on screening mammography performance in the United States. Radiology 2011; 259: pp. 72-84.
13. Nelson H.D., Tyne K., Naik A., et. al.: Screening for breast cancer: an update for the U.S. Preventive Services Task Force. Ann Intern Med 2009; 151: pp. 727-737.
14. Berlin L., Hall F.M.: More mammography muddle: emotions, politics, science, costs, and polarization. Radiology 2010; 255: pp. 311-316.
15. Brawley O.W.: Risk-based mammography screening: an effort to maximize the benefits and minimize the harms. Ann Intern Med 2012; 156: pp. 662-663.
16. Tice J.A., Cummings S.R., Smith-Bindman R., et. al.: Using clinical factors and mammographic breast density to estimate breast cancer risk: development and validation of a new predictive model. Ann Intern Med 2008; 148: pp. 337-347.
17. Schousboe J.T., Kerlikowske K., Loh A., et. al.: Personalizing mammography by breast density and other risk factors for breast cancer: analysis of health benefits and cost-effectiveness. Ann Intern Med 2011; 155: pp. 10-20.
18. van Ravesteyn N.T., Miglioretti D.L., Stout N.K., et. al.: Tipping the balance of benefits and harms to favor screening mammography starting at age 40 years: a comparative modeling study of risk. Ann Intern Med 2012; 156: pp. 609-617.
19. Nelson H.D., Zakher B., Cantor A., et. al.: Risk factors for breast cancer for women aged 40 to 49 years: a systematic review and meta-analysis. Ann Intern Med 2012; 156: pp. 635-648.
20. Saftlas A.F., Hoover R.N., Brinton L.A., et. al.: Mammographic densities and risk of breast cancer. Cancer 1991; 67: pp. 2833-2838.
21. Boyd N.F., Martin I.J., Stone J., et. al.: Mammographic densities as a marker of human breast cancer risk and their use in chemoprevention. Curr Oncol Rep 2001; 3: pp. 314-321.
22. American College of Radiology: Bi-RADS Breast Imaging Reporting and Data System breast imaging atlas.2003.American College of RadiologyReston, VA
23. Berg W.A., Campassi C., Langenberg P., et. al.: Breast Imaging Reporting and Data System: inter- and intraobserver variability in feature analysis and final assessment. AJR Am J Roentgenol 2000; 174: pp. 1769-1777.
24. Taboces P.G., Correa J., Souto M., et. al.: Computer-assisted diagnosis: the classification of mammographic breast parenchymal patterns. Phys Med Biol 1995; 40: pp. 103-117.
25. Byng J.W., Yaffe M.J., Lockwood G.A., et. al.: Automated analysis of mammographic densities and breast carcinoma risk. Cancer 1997; 80: pp. 66-74.
26. Heine J.J., Velthuizen R.P.: Spectral analysis of full field digital mammography data. Med Phys 2002; 29: pp. 647-661.
27. Zhou C., Chan H.P., Petrick N., et. al.: Computerized image analysis: estimation of breast density on mammograms. Med Phys 2001; 28: pp. 1056-1069.
28. Chang Y.-H., Wang X.-H., Hardesty L.A., et. al.: Computerized assessment of tissue composition on digitized mammograms. Acad Radiol 2002; 9: pp. 899-905.
29. Pawluczyk O., Augustine B.J., Yaffe M.J., et. al.: A volumetric method for estimation of breast density on digitized screen-film mammograms. Med Phys 2003; 30: pp. 352-364.
30. Wang X.H., Good W.F., Chapman B.E., et. al.: Automated assessment of the composition of breast tissue revealed on tissue-thickness-corrected mammography. AJR Am J Roentgenol 2003; 180: pp. 257-262.
31. Wei J., Chan H.-P., Helvie M.A., et. al.: Correlation between mammographic density and volumetric fibroglandular tissue estimated on breast MR images. Med Phys 2004; 31: pp. 933-942.
32. Li H., Giger M.L., Olopade O.I., et. al.: Computerized texture analysis of mammographic parenchymal patterns of digitized mammograms. Acad Radiol 2005; 12: pp. 863-873.
33. Glide-Hurst C.K., Duric N., Littrup P.: A new method for quantitative analysis of mammographic density. Med Phys 2007; 34: pp. 4491-4498.
34. Wei J., Chan H.P., Wu Y.T., et. al.: Association of computerized mammographic parenchymal pattern measure with breast cancer risk: a pilot case-control study. Radiology 2011; 260: pp. 42-49.
35. Gail M.H., Mai P.L.: Comparing breast cancer risk assessment models. J Natl Cancer Inst 2010; 102: pp. 665-668.
36. Harvey J.A., Bovbjerg V.E.: Quantitative assessment of mammographic breast density: relationship with breast cancer risk. Radiology 2004; 230: pp. 29-41.
37. Kopans D.B.: Basic physics and doubts about relationship between mammographically determined tissue density and breast cancer risk. Radiology 2008; 246: pp. 348-353.
38. van Gils C.H., Otten J.D., Verbeek A.L., et. al.: Mammographic breast density and risk of breast cancer: masking bias or causality?. Eur J Epidemiol 1998; 14: pp. 315-320.
39. Colin C., Prince V., Alette P.J.: Can mammographic assessment lead to consider density as a risk factor for breast cancer?. Eur J Radiol 2013; 82: pp. 404-411.
40. Passaperuma K., Warner E., Hill K.A., et. al.: Is mammographic breast density a breast cancer risk factor in women with BRCA mutations?. J Clin Oncol 2010; 28: pp. 3779-3783.
41. Wang X., Lederman D., Tan J., et. al.: Computerized detection of breast tissue asymmetry depicted on bilateral mammograms: a preliminary study of breast risk stratification. Acad Radiol 2010; 17: pp. 1234-1241.
42. Wang X., Lederman D., Tan J., et. al.: Computerized prediction of risk for developing breast cancer based on bilateral mammographic breast tissue asymmetry. Med Eng Phys 2011; 33: pp. 934-942.
43. Zheng B., Sumkin J.H., Zuley M.L., et. al.: Bilateral mammographic density asymmetry and breast cancer risk: a preliminary assessment. Eur J Radiol 2012; 81: pp. 3222-3228.
44. Zheng B., Leader J.K., Abrams G.S., et. al.: Multiview-based computer-aided detection scheme for breast masses. Med Phys 2006; 33: pp. 3135-3143.
45. Tang X.: Texture information in run-length matrices. IEEE Trans Image Process 1998; 7: pp. 1602-1609.
46. Tzikopoulos S., Mavroforakis M.E., Georgiou H.V., et. al.: A fully automated scheme for mammographic segmentation and classification based on breast density and asymmetry. Comput Methods Programs Biomed 2011; 102: pp. 47-63.
47. Powell W.B.: Approximate dynamic programming: solving the curses of dimensionality.1st edition2007.Wiley-InterscienceNew Jersey
48. Xu L., Yan P., Chang T.: Best first strategy for feature selection. 9th International Conference on Pattern Recognition.1988.IEEE Computer Society PressRome, Italy:pp. 706-708. Rockville, MD.
49. Caruana R., Freitag D.: Greedy attribute selection. 11th International Conference on Machine Learning.Cohen W.W.Hirsh H.1994.Morgan KaufmannNew Brunswick, NJ:pp. 28-36. San Mateo, CA.
50. Pudil P., Novovicova J., Kittler J.: Floating search methods in feature selection. Pattern Recogn Lett 1994; 15: pp. 1119-1125.
51. Theodoridis S., Koutroumbas K.: Pattern recognition.4th edition2008.Academic PressSan Diego, CA, USA
52. Theodoridis S., Koutroumbas K.: Introduction to pattern recognition: a MATLAB approach.2010.Academic PressBurlington, MA, USA
53. Chang C.-C., Lin C.-J.: LIBSVM: a library for support vector machines. ACM Trans Intell Syst Technol 2011; 2: pp. 27.
54. Hsu C.-W., Chang C.-C., Lin C.-J.: A practical guide to support vector classification. Technical report.2009.National Taiwan UniversityTaipei, Taiwan
55. Steyerberg E.W., Vickers A.J., Cook N.R., et. al.: Assessing the performance of prediction models: a framework for traditional and novel measures. Epidemiology 2010; 21: pp. 128-138.
56. The California report. California’s breast density notification law goes into effect. Available at: http://blogs.kqed.org/stateofhealth/2013/03/29/californias-breast-density-notification-law-goes-into-effect/ . Accessed: July 23, 2013. 2013.
57. Scutt D., Manning J.T., Whitehouse G.H., et. al.: The relationship between breast asymmetry, breast size and the occurrence of breast cancer. Br J Radiol 1997; 70: pp. 1017-1021.