
Rationale and Objectives
The preoperative assessment of tumor grade has important clinical implications for the treatment and prognosis of patients with colorectal adenocarcinomas. The purpose of this study is to investigate the predictive significance of colorectal adenocarcinoma grade using 256-slice whole-tumor computed tomography (CT) perfusion.
Materials and Methods
Fifty-three patients with proven colorectal adenocarcinomas were enrolled. All of them underwent 256-slice whole-tumor CT perfusion. They were divided into two different subgroups according to postoperative pathological results: low grade and high grade. The Kruskal–Wallis test or one-way analysis of variance was used for comparison of CT perfusion parameters between different tumor grades. Multivariant correlation between pathologic tumor stage, histologic tumor differentiation, and whole-tumor CT perfusion parameters was evaluated by Spearman rank correlation coefficient. According to receiver operating characteristic (ROC) curves, perfusion parameters including blood flow (BF), peak enhancement index (PEI), blood volume (BV), and time to peak (TTP) of 53 patients were analyzed, and the sensitivity, specificity, and accuracy of these parameters in predicting tumor grade were calculated.
Results
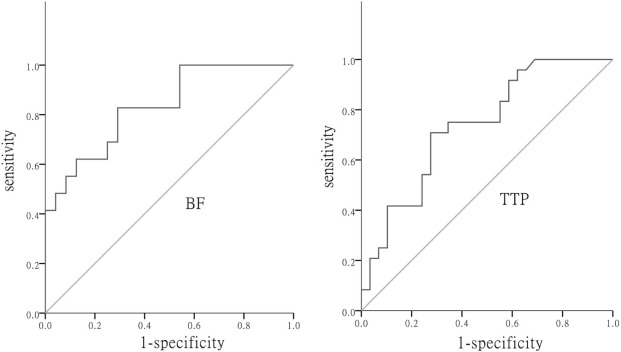
There were significant differences in BF and TTP between low-grade and high-grade tumors. According to the ROC curve, BF and TTP were of diagnostic significance, with the area under the curve values of 0.828 and 0.736, respectively. The diagnostic threshold of BF was 32.12 mL/min/100 g and that of TTP was 18.10 seconds.
Conclusions
The CT perfusion parameters (BF, TTP) of first-pass 256-slice whole-tumor CT perfusion imaging can reflect tumor grade in colorectal adenocarcinoma.
Introduction
olorectal adenocarcinoma is one of malignant tumors with the highest morbidity and mortality all over the world . The 5-year survival rate of patients with colorectal adenocarcinoma is closely related to tumor stage and grade, and higher stage and higher grade tumors result in poorer prognosis . Clinical studies have confirmed that neoadjuvant chemoradiotherapy is superior to other adjuvant means in decreasing local relapse rate and lowering tumor stages in patients with high-stage and high-grade tumors. Sauer et al. compared the efficacy of preoperative chemoradiotherapy to that of postoperative chemoradiotherapy in a 5-year randomized controlled trial and concluded that preoperative chemoradiotherapy, as compared to postoperative chemoradiotherapy, significantly decreased the 5-year cumulative incidence of local relapse (6% vs. 13%, P = 0.006), lowered tumor grades and stages, and significantly increased the rate of sphincter preservation (39% vs. 19%, P = 0.004). Therefore, early diagnosis and preoperative tumor grade evaluation are clinically important for patients with colorectal adenocarcinoma . Endoscopic colorectal biopsy can be used for pathological diagnosis of colorectal adenocarcinoma by harvesting a sufficient amount of tissue preoperatively, but it is limited because of partial sample harvesting and nonuniformity of tumor growth, which result in difficulties in obtaining a precise determination of the degree of tumor grade. Therefore, a preoperative precise determination of the degree of tumor grade by functional imaging is clinically important.
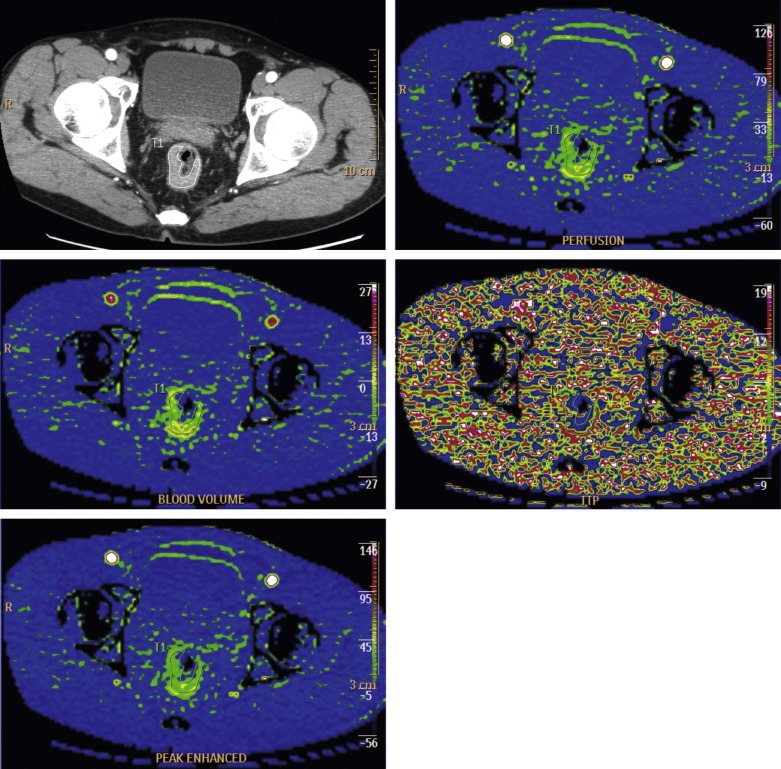
Computed tomography (CT) perfusion imaging is a newly emerging imaging modality that can quantitatively measure the degree of vascular enhancement, provide real-time tracking, calculate different CT perfusion parameters using different mathematical models, and thereby reflect the information of tumor microenvironment. There is evidence that CT perfusion parameters are correlated with tumor angiogenesis, reflecting the features of tumor angiogenesis to some extent . Several studies have demonstrated that tumor grade and prognosis are correlated with CT perfusion parameters . Few studies have reported on preoperative CT perfusion imaging for precise evaluation of the grade of colorectal adenocarcinoma . Owing to the limitations of the scanning equipment, most CT perfusion studies are confined to one or several levels of tumors, with poor repeatability; moreover, one level of perfusion information cannot represent the whole-volume perfusion information because of the nonuniformity of tumor angiogenesis. This study performed 256-slice whole-tumor CT perfusion imaging in colorectal adenocarcinoma and compared perfusion imaging findings to postoperative pathological outcomes to analyze the diagnostic value of whole-tumor CT perfusion parameters for tumor grades.
Materials and Methods
Clinical Data
Get Radiology Tree app to read full this article<
Pre-examination Preparation
Get Radiology Tree app to read full this article<
CT Perfusion Examination
Get Radiology Tree app to read full this article<
Image Analysis
Get Radiology Tree app to read full this article<
Get Radiology Tree app to read full this article<
Get Radiology Tree app to read full this article<
Pathological Diagnosis
Get Radiology Tree app to read full this article<
Statistical Analysis
Get Radiology Tree app to read full this article<
Results
Get Radiology Tree app to read full this article<
TABLE 1
Summary of Patients’ Clinical Characteristics ( n = 53)
Factors Numbers/Values Gender Male 33 (33/53; 62.26%) Female 20 (20/53; 37.74%) Patient age (year) 58.9 ± 14.8 Tumor location Cecum 5 (5/53; 9.43%) Ascending colon 3 (3/53; 5.66%) Transverse colon 1 (1/53; 1.89%) Descending colon 3 (3/53; 5.66%) Sigmoid colon 7 (7/53; 13.21%) Rectum 34 (34/53; 64.15%) Tumor length (cm) 8.7 ± 1.1 Tumor grade Low grade 29 (29/53; 54.72%) High grade 24 (24/53; 45.28%) T staging T1 4 (4/53; 7.55%) T2 5 (5/53; 9.43%) T3 40 (40/53; 75.47%) T4 4 (4/53; 7.56%) Nodal staging N0 30 (30/53; 56.60%) N1 11 (11/53; 20.75%) N2 12 (12/53; 22.64%) Distant metastases Yes 8 (8/53; 15.09%) No 45 (45/53; 84.91%) Stage I 7 (7/53; 13.21%) II 21 (21/53; 39.62%) III 17 (17/53; 32.08%) IV 8 (8/53; 15.09%)
TABLE 2
Whole-Tumor CT Perfusion Parameters Corresponding to Different Pathological Tumor Stages
CT Perfusion Parameters P-stage F_P_ I ( n = 7) II ( n = 21) III ( n = 17) IV ( n = 8) BF (mL/min/100 g) 63.13 ± 14.47 41.52 ± 12.31 28.86 ± 9.48 24.31 ± 8.07 20.055 <0.001 PEI (HU) 38.95 ± 13.39 42.68 ± 16.58 38.25 ± 17.42 33.21 ± 7.68 0.766 0.579 BV (mL/100 g) 20.87 ± 6.23 18.94 ± 6.90 17.53 ± 6.90 15.93 ± 5.73 0.826 0.486 TTP (s) 10.95 ± 3.24 17.76 ± 6.91 22.93 ± 9.12 25.61 ± 7.29 6.431 0.001
HU, Hounsfield units.
P-stage indicates the pathological tumor stage.
TABLE 3
Whole-Tumor CT Perfusion Parameters Corresponding to Different Pathological Tumor Grades
CT Perfusion Parameter Low Grade ( n = 29) High Grade ( n = 24)P__ΔΔ Well-differentiated ( n = 8) Moderately Differentiated ( n = 21)P__Δ Poorly Differentiated and Nondifferentiated ( n = 24) BF * (mL/min/100 g) 63.72 ± 12.07 39.37 ± 11.46 <0.001 27.60 ± 9.79 0.001 PEI ** (HU) 45.05 ± 22.19 39.78 ± 15.68 0.417 37.04 ± 12.59 0.330 BV ** (mL/100 g) 21.83 ± 4.58 16.39 ± 4.19 0.049 18.77 ± 8.36 0.637 TTP ** (s) 12.90 ± 8.70 17.99 ± 5.61 0.122 23.48 ± 8.99 0.030
BF, Blood flow; BV, blood volume; HU, Hounsfield units; PEI, peak enhancement index; TTP, time to peak.
Indicates the presence of heterogeneity of variance across groups and the Kruskal–Wallis test was used. Indicates the presence of homogeneity of variance across groups; data are normally distributed and independent sample t test was used. According to postoperative pathological diagnosis, well-differentiated and moderately differentiated colorectal adenocarcinomas belong to the low-grade tumor group, and poorly differentiated and nondifferentiated colorectal adenocarcinomas belong to the high-grade tumor group. The compared results between well-differentiated and moderately differentiated subgroups in low-grade tumors; The compared results between low-grade and high-grade tumors.
Get Radiology Tree app to read full this article<
Correlations Between Whole-Tumor CT Perfusion Parameters and Tumor Stages and Grades
Get Radiology Tree app to read full this article<
TABLE 4
Multivariant Correlation Between Pathological Tumor Stage, Histologic Tumor Differentiation, and Whole-Tumor CT Perfusion Parameters
CT Perfusion Parameter Tumor P-stage Tumor Differentiation BF (mL/min/100 g)r = −0.681P < 0.001r = 0.667P < 0.001 PEI (HU)r = −0.181P = 0.195r = 0.093P = 0.507 BV (mL/100 g)r = −0.260P = 0.060r = 0.091P = 0.518 TTP (s)r = 0.585P < 0.001r = −0.488P < 0.001
HU, Hounsfield units.
P-stage indicates the pathological tumor stage.
Get Radiology Tree app to read full this article<
Diagnostic Significance of Whole-Tumor CT Perfusion Parameters in Tumor Grades
Get Radiology Tree app to read full this article<
Get Radiology Tree app to read full this article<
Get Radiology Tree app to read full this article<
Discussion
Get Radiology Tree app to read full this article<
Get Radiology Tree app to read full this article<
Get Radiology Tree app to read full this article<
Get Radiology Tree app to read full this article<
Get Radiology Tree app to read full this article<
Acknowledgments
Get Radiology Tree app to read full this article<
Get Radiology Tree app to read full this article<
Get Radiology Tree app to read full this article<
References
1. Weitz J., Koch M., Debus J., et. al.: Colorectal cancer. Lancet 2005; 365: pp. 153-165.
2. Parkin D.M., Bray F., Ferlay J., et. al.: Global cancer statistics, 2002. CA Cancer J Clin 2005; 55: pp. 74-108.
3. Freedman L.S., Macaskill P., Smith A.N.: Multivariate analysis of prognostic factors for operable rectal cancer. Lancet 1984; 29: pp. 733-736.
4. Sauer R., Becker H., Hohenberger W., et. al.: Preoperative versus postoperative chemoradiotheraphy for rectal cancer. N Engl J Med 2004; 351: pp. 1731-1740.
5. Roh M.S., Colangelo L., Wieand S., et. al.: Response to preoperative multimodality therapy predicts survival in patients with carcinoma of the rectum. J Clin Oncol 2004; 22: pp. 3505.
6. Hayano K., Shuto K., Koda K., et. al.: Quantitative measurement of blood flow using perfusion CT for assessing clinicopathologic features and prognosis in patients with rectal cancer. Dis Colon Rectum 2009; 52: pp. 1624-1629.
7. García-Figueiras R., Goh V.J., Padhani A.R., et. al.: CT perfusion in oncologic imaging: a useful tool?. AJR Am J Roentgenol 2013; 200: pp. 8-19.
8. Goh V., Halligan S., Wellsted D.M., et. al.: Can perfusion CT assessment of primary colorectal adenocarcinoma blood flow at staging predict for subsequent metastatic disease? A pilot study. Eur Radiol 2009; 19: pp. 79-89.
9. Goh V., Halligan S., Daley F., et. al.: Colorectal tumor vascularity: quantitative assessment with multidetector CT—do tumor perfusion measurements reflect angiogenesis?. Radiology 2008; 249: pp. 510-517.
10. Goh V., Halligan S., Taylor S.A., et. al.: Differentiation between diverticulitis and colorectal cancer: quantitative CT perfusion measurements versus morphologic criteria—initial experience. Radiology 2007; 242: pp. 456-462.
11. Jain R., Ellika S.K., Scarpace L., et. al.: Quantitative estimation of permeability surface-area product in astroglial brain tumors using perfusion CT and correlation with histopathological grade. AJNR Am J Neuroradiol 2008; 29: pp. 694-700.
12. Narang J., Jain R., Scarpace L., et. al.: Tumor vascular leakiness and blood volume estimates in oligodendrogliomas using perfusion CT: an analysis of perfusion parameters helping further characterize genetic subtypes as well as differentiate from astroglial tumors. J Neurooncol 2011; 102: pp. 287-293.
13. Sun H., Xu Y., Yang Q., et. al.: Assessment of tumor grade and angiogenesis in colorectal cancer: whole-volume perfusion CT. Acad Radiol 2014; 21: pp. 750-757.
14. D’Onofrio M., Gallotti A., Mantovani W., et. al.: Perfusion CT can predict tumoral grading of pancreatic adenocarcinoma. Eur J Radiol 2013; 82: pp. 227-233.
15. Vermeulen P., Gasparini G., Fox S., et. al.: Second international consensus on the methodology and criteria of evaluation of angiogenesis quantification in solid human tumours. Eur J Cancer 2002; 38: pp. 1564-1579.
16. Park Y.J., Park K.J., Park J.G., et. al.: Prognostic factors in 2230 Korean colorectal cancer patients: analysis of consecutively operated cases. World J Surg 1999; 23: pp. 721-726.
17. Bellomi M.J., Petralia G., Sonzogni A., et. al.: CT perfusion for the monitoring of neoadjuvant chemotherapy and radiation therapy in rectal carcinoma: initial experience. Radiology 2007; 244: pp. 486-493.
18. Ng Q.S., Goh V., Fichte H., et. al.: Lung cancer perfusion at multi-detector row CT: reproducibility of whole tumor quantitative measurements. Radiology 2006; 239: pp. 547-553.
19. Kim J.W., Jeong Y.Y., Chang N.K., et. al.: Perfusion CT in colorectal cancer: comparison of perfusion parameters with tumor grade and microvessel density. Korean J Radiol 2012; 13: pp. S89-S97.
20. Sahani D.V., Holalkere N.S., Mueller P.R., et. al.: Advanced hepatocellular carcinoma: CT perfusion of liver and tumor tissue—initial experience. Radiology 2007; 243: pp. 736-743.
21. Kambadakone A.R., Sahani D.V.: Body perfusion CT: technique, clinical applications, and advances. Radiol Clin North Am 2009; 47: pp. 161-178.