
Rationale and Objectives
The aims of this study were to retrospectively evaluate whether computed tomographic (CT) parameters were predictors of in-hospital mortality within 30 days of CT imaging and to compare CT parameters with clinical, echocardiographic, and laboratory findings in patients with acute pulmonary embolism (PE).
Materials and Methods
A total of 122 patients (61 women, 61 men; mean age, 64 ± 15 years) with CT scans positive for acute PE were reviewed. Two independent readers who were blinded to clinical outcomes scored pulmonary artery obstructions, evaluated cardiovascular measurements, and assessed qualitative findings. Reports of echocardiographic, clinical, and laboratory findings and clinical outcome were reviewed. Results were correlated with patient outcomes using Wilcoxon’s rank-sum, χ 2 , and Student’s t tests. Logistic regression analyses were performed to determine predictors of patient outcomes.
Results
Thirteen patients (11%) died related to PE within 30 days in the hospital. There were significant differences in the ratio of arterial partial pressure of oxygen to inspired fraction of oxygen and in heart rate between survivors and nonsurvivors ( P < .05). No CT or echocardiographic predictor was associated with mortality.
Conclusions
The ratio of arterial partial pressure of oxygen to inspired fraction of oxygen and heart rate strongly predicted mortality due to PE. Neither CT pulmonary angiographic variables nor echocardiography could successfully predict in-hospital mortality in patients with acute PE.
Acute pulmonary embolism (PE) is a common and potentially fatal disease, with an overall 30-day mortality rate that exceeds 10% . Although most late deaths are due to underlying disease, such as cancer, chronic lung disease, or congestive heart failure, the main cause of death within 30 days is right ventricular (RV) failure . Rapid risk stratification is paramount for identifying high-risk patients and helps select the appropriate treatment strategy. Thrombolysis , catheter intervention , or surgical embolectomy as adjuncts to anticoagulation may rapidly reverse RV failure and reduce the risk for recurrence and death. In recent years, many attempts have been made to stratify patients according to their risk for death due to acute PE. From the results of large retrospective registries and randomized trials of thrombolytic agents, clinical presentation is considered the most powerful predictor of death due to PE . However, there have been attempts to further risk-stratify patients with imaging. With the development of narrow collimation, multi–detector row computed tomographic (CT) imaging, and modern workstations for image postprocessing and analysis, CT pulmonary angiography is being recommended as the modality of choice for the assessment of patients with pulmonary emboli .
Several retrospective studies have investigated the relationships between pulmonary artery (PA) obstruction score, cardiovascular parameters, and patient outcomes . On the other hand, several reports have suggested that some clinical and laboratory parameters, such as arterial blood gas measurements and troponin T, are prognostic findings in patients with acute PE . However, conflicting conclusions are present between these studies. Furthermore, none of the existing CT studies have attempted to control for clinical presentation variables or echocardiographic and laboratory findings. Thus, the aims of our study were to retrospectively evaluate whether CT quantitative and qualitative parameters were predictors of in-hospital mortality within 30 days of CT imaging and to compare CT parameters with echocardiographic, clinical, and laboratory findings in patients with acute PE.
Materials and methods
Patient Selection
Get Radiology Tree app to read full this article<
CT Acquisition
Get Radiology Tree app to read full this article<
Image Review
Get Radiology Tree app to read full this article<
Get Radiology Tree app to read full this article<
Get Radiology Tree app to read full this article<
Get Radiology Tree app to read full this article<
Echocardiography
Get Radiology Tree app to read full this article<
Clinical Information
Get Radiology Tree app to read full this article<
Get Radiology Tree app to read full this article<
Statistical Analysis
Get Radiology Tree app to read full this article<
Get Radiology Tree app to read full this article<
Results
Interreader Agreement
Get Radiology Tree app to read full this article<
Patient Demographics and Outcomes
Get Radiology Tree app to read full this article<
Table 1
Demographic Findings and Clinical Characteristics
Parameter Survivors ( n = 109) Nonsurvivors ( n = 13) Mean age (y) 63 ± 15 69 ±14 Men (%) 56 (51%) 5 (38%) Predisposing factors Age (>65 y) 70 (64%) 8 (61%) Immobilization 43 (39%) 3 (23%) Malignancy 25 (22%) 5 (38%) Surgery 15 (13%) 1 (8%) Congestive heart failure 11 (10%) 3 (23%) Obesity 12 (11%) 1 (8%) Oral contraceptive use 4 (4%) 0 (0%) Comorbidities Hypertension 35 (32%) 5 (38%) Malignancy 22 (20%) 8 (61%) Ischemic heart disease 20 (18%) 0 (0%) Diabetes 19 (17%) 1 (8%) Congestive heart failure 12 (11%) 3 (23%) Chronic obstructive pulmonary disease 11 (10%) 2 (15%) Cerebrovascular accident 11 (10%) 2 (15%) Chronic renal failure 2 (2%) 2 (15%) Chronic liver disease 1 (1%) 0 (0%) Clinical and laboratory findings HR (beats/min) 92 ± 16 103 ± 15 PaO 2 (mm Hg) 68 ± 15 62 ± 13 PaCO 2 (mm Hg) 30 ± 7 28 ± 9 Saturation (%) 93 ± 4 91 ± 3 PaO 2 /FiO 2 322 ± 84 246 ± 92 Blood pressure (mm Hg) 86 ± 11 75 ± 19 Troponin T (ng/mL) 0.09 ± 0.16 0.15 ± 0.10 Treatment Low–molecular weight heparin 104 (95%) 11 (85%) Thrombolytic agent 5 (5%) 2 (15%)
Data are expressed as mean ± standard deviation or as number (percentage).
FiO2, inspired fraction of oxygen; HR, heart rate; PaCO 2 , arterial partial pressure of carbon dioxide; PaO 2 , arterial partial pressure of oxygen.
Get Radiology Tree app to read full this article<
CT Quantitative Measurements
PA Obstruction score
Get Radiology Tree app to read full this article<
Get Radiology Tree app to read full this article<
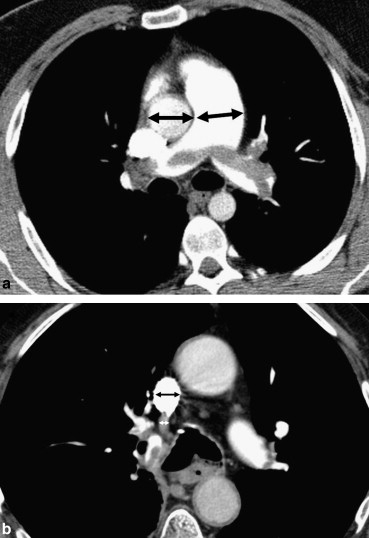
CT Cardiovascular measurements
Get Radiology Tree app to read full this article<
Table 2
Comparisons of CT Quantitative Measurements Between Survivors and Nonsurvivors
CT Parameter Survivors ( n = 109) Nonsurvivors ( n = 13)P ∗ PA obstruction index (%) 36.07 34.00 .78 RV/LV ratio 1.29 1.43 .30 PA/aorta ratio 0.84 0.89 .48 LA diameter (mm) 39.32 38.77 .89 Azygos vein diameter (mm) 8.95 9.17 .74 SVC diameter (mm) 18.85 18.83 .98
Data are expressed as means.
CT, computed tomographic; LA, left atrial; LV, left ventricular; PA, pulmonary artery; RV, right ventricular; SVC, superior vena cava.
Get Radiology Tree app to read full this article<
Table 3
Correlation Between PA Obstruction Score and CT Cardiovascular Measurements
CT Parameter Pearson’s Correlation Coefficient_P_ RV/LV ratio 0.638 <.001 PA/aorta ratio 0.359 <.001 LA diameter −0.377 <.001 Azygos vein diameter 0.424 <.001 SVC diameter 0.255 <.001
Abbreviations as in Table 2 .
Get Radiology Tree app to read full this article<
Get Radiology Tree app to read full this article<
Get Radiology Tree app to read full this article<
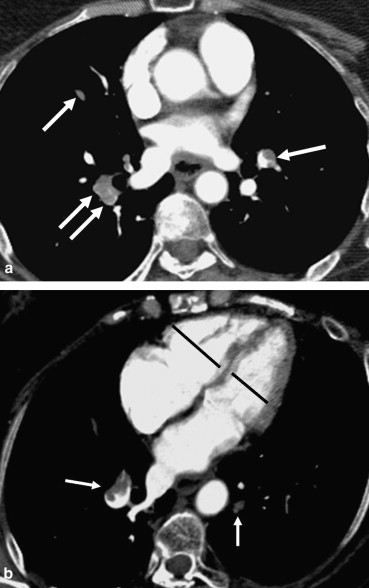
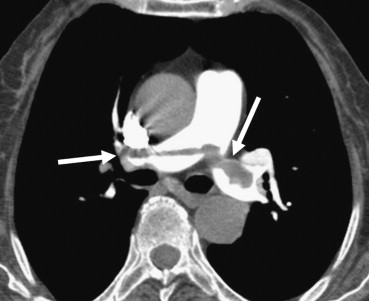
CT Qualitative findings
Get Radiology Tree app to read full this article<
Table 4
Comparison of CT Qualitative Findings Between Survivors and Nonsurvivors
CT Finding Survivors ( n = 109) Nonsurvivors ( n = 13)P ∗ Ventricular septal bowing 42 (38%) 8 ( 61%) .14 Pleural effusion 36 (33%) 7 (54%) .21 Reflux into inferior vena cava 45 (41%) 7 (54%) .55 Pulmonary infarct 28 (26%) 2 ( 15%) .51 Mosaic perfusion defect 44 (40%) 7 (54%) .38
Abbreviation as in Table 2 .
Get Radiology Tree app to read full this article<
Get Radiology Tree app to read full this article<
Echocardiographic Findings
Get Radiology Tree app to read full this article<
Clinical and Laboratory Results
Get Radiology Tree app to read full this article<
Table 5
Comparisons of Clinical and Laboratory Quantitative Measurements between Survivors and Nonsurvivors
Parameter Survivors ( n = 109) Nonsurvivors ( n = 13)P ∗ Troponin T (ng/mL) 0.09 0.15 .37 PaO 2 /FiO 2 ratio 322 246 .003 PaO 2 (mm Hg) 68 62 .19 PaCO 2 (mm Hg) 30 28 .35 HR (beats/min) 92 103 .02 Blood pressure (mm Hg) 86.3 75.5 .07
Data are expressed as means value.
Abbreviations as in Table 1 .
Get Radiology Tree app to read full this article<
Get Radiology Tree app to read full this article<
Discussion
Get Radiology Tree app to read full this article<
CT Parameters
Get Radiology Tree app to read full this article<
Get Radiology Tree app to read full this article<
Get Radiology Tree app to read full this article<
Echocardiographic Findings
Get Radiology Tree app to read full this article<
Clinical and Laboratory Findings
Get Radiology Tree app to read full this article<
Limitations
Get Radiology Tree app to read full this article<
Conclusions
Get Radiology Tree app to read full this article<
References
1. Goldhaber S.Z., Visani L., De Rosa M.: Acute pulmonary embolism: clinical outcomes in the International Cooperative Pulmonary Embolism Registry (ICOPER). Lancet 1999; 353: pp. 1386-1389.
2. Schoepf U.J., Kucher N., Kipfmueller F., et. al.: Right ventricular enlargement on chest computed tomography: a predictor of early death in acute pulmonary embolism. Circulation 2004; 110: pp. 3276-3280.
3. Kucher N., Luder C.M., Dornhofer T., et. al.: Novel management strategy for patients with suspected pulmonary embolism. Eur Heart J 2003; 24: pp. 366-376.
4. Uflacker R.: Interventional therapy for pulmonary embolism. J Vasc Interv Radiol 2001; 12: pp. 147-164.
5. Aklog L., Williams C.S., Byrne J.G., et. al.: Acute pulmonary embolectomy: a contemporary approach. Circulation 2002; 105: pp. 1416-1419.
6. Jerjes-Sanchez C., Ramirez-Rivera A., de Lourdes Garcia M., et. al.: Streptokinase and heparin versus heparin alone in massive pulmonary embolism: a randomized controlled trial. J Thromb Thrombolysis 1995; 2: pp. 227-229.
7. Schoepf U.J., Costello P.: CT angiography for diagnosis of pulmonary embolism: state of the art. Radiology 2004; 230: pp. 329-337.
8. Ghaye B., Ghuysen A., Willems V., et. al.: Severe pulmonary embolism: pulmonary artery clot load scores and cardiovascular parameters as predictors of mortality. Radiology 2006; 239: pp. 884-891.
9. Collomb D., Paramelle P.J., Calaque O., et. al.: Severity assessment of acute pulmonary embolism: evaluation using helical CT. Eur Radiol 2003; 13: pp. 1508-1514.
10. Ghuysen A., Ghaye B., Willems V., et. al.: Computed tomographic pulmonary angiography and prognostic significance in patients with acute pulmonary embolism. Thorax 2005; 60: pp. 956-961.
11. Mastora I., Remy-Jardin M., Masson P., et. al.: Severity of acute pulmonary embolism: evaluation of a new spiral CT angiographic score in correlation with echocardiographic data. Eur Radiol 2003; 13: pp. 29-35.
12. Bankier A.A., Janata K., Fleischmann D., et. al.: Severity assessment of acute pulmonary embolism with spiral CT: evaluation of two modified angiographic scores and comparison with clinical data. J Thorac Imaging 1997; 12: pp. 150-158.
13. Wu A.S., Pezzullo J.A., Cronan J.J., et. al.: CT pulmonary angiography: quantification of pulmonary embolus as a predictor of patient outcome—initial experience. Radiology 2004; 230: pp. 831-835.
14. Araoz P.A., Gotway M.B., Trowbridge R.L., et. al.: Helical CT pulmonary angiography predictors of in-hospital morbidity and mortality in patients with acute pulmonary embolism. J Thorac Imaging 2003; 18: pp. 207-216.
15. Van der Meer R.W., Pattynama P.M., van Strijen M.J., et. al.: Right ventricular dysfunction and pulmonary obstruction index at helical CT: prediction of clinical outcome during 3-month follow-up in patients with acute pulmonary embolism. Radiology 2005; 235: pp. 798-803.
16. Nural M.S., Elmali M., Findik S., et. al.: Computed tomographic pulmonary angiography in the assessment of severity of acute pulmonary Embolism and right ventricular dysfunction. Acta Radiol 2009; 50: pp. 629-637.
17. Araoz P.A., Gotway M.B., Harrington J.R., et. al.: Pulmonary embolism: prognostic CT findings. Radiology 2007; 242: pp. 889-897.
18. Metafratzi Z.M., Vassiliou M.P., Maglaras G.C., et. al.: Acute pulmonary embolism: correlation of CT pulmonary artery obstruction index with blood gas values. AJR Am J Roentgenol 2006; 186: pp. 213-219.
19. Matsuoka S., Kurihara Y., Yagihashi K., et. al.: Quantification of thin-section CT lung attenuation in acute pulmonary embolism: correlations with arterial blood gas levels and CT angiography. AJR Am J Roentgenol 2006; 186: pp. 1272-1279.
20. Konstantinides S., Geibel A., Olschewski M., et. al.: Importance of cardiac Troponins I and T in risk stratification of patients with acute pulmonary embolism. Circulation 2002; 106: pp. 1263-1268.
21. Qanadli S.D., El Hajjam M., Vieillard-Baron A., et. al.: New CT index to quantify arterial obstruction in pulmonary embolism: comparison with angiographic index and echocardiography. AJR Am J Roentgenol 2001; 176: pp. 1415-1420.
22. Engelke C., Rummeny E.J., Marten K.: Acute pulmonary embolism on MDCT of the chest: prediction of cor pulmonale and short-term patient survival from morphologic embolus burden. AJR Am J Roentgenol 2006; 186: pp. 1265-1271.
23. Pech M., Wieners G., Dul P., et. al.: Computed tomography pulmonary embolism index for the assessment of survival in patients with pulmonary embolism. Eur Radiol 2007; 17: pp. 1954-1959.
24. Contractor S., Maldjian P.D., Sharma V.K., et. al.: Role of helical CT in detecting right ventricular dysfunction secondary to acute pulmonary embolism. J Comput Assist Tomogr 2002; 26: pp. 587-591.
25. Mansencal N., Joseph T., Vieillard-Baron A., et. al.: Diagnosis of right ventricular dysfunction in acute pulmonary embolism using helical computed tomography. Am J Cardiol 2005; 95: pp. 1260-1263.
26. Lu M.T., Cai T., Ersoy H., et. al.: Interval increase in right-left ventricular diameter ratios at CT as a predictor of 30-day mortality after acute pulmonary embolism: initial experience. Radiology 2008; 246: pp. 281-287.
27. Goldhaber S.Z.: Echocardiography in the management of pulmonary embolism. Ann Intern Med 2002; 136: pp. 691-700.
28. Kasper W., Konstantinides S., Geibel A., et. al.: Prognostic significance of right ventricular afterload stress detected by echocardiography in patients with clinically suspected pulmonary embolism. Heart 1997; 77: pp. 346-349.
29. Quiroz R., Kucher N., Schoepf U.J., et. al.: Right ventricular enlargement on chest computed tomography: prognostic role in acute pulmonary embolism. Circulation 2004; 109: pp. 2401-2404.
30. Hsu J.T., Chu C.M., Chang S.T., et. al.: Prognostic value of arterial/alveolar oxygen tension ratio (a/APO 2 ) in acute pulmonary embolism. Circ J 2007; 71: pp. 1560-1566.
31. Macrea M.: Cardiac troponin T monitoring and acute pulmonary embolism. Chest 2004; 126: pp. 655-656.