
Rationale and Objectives
The aim of this study was to determine whether key radiology report “consumers” in our institution prefer structured measurement reporting in a dedicated report section over the current practice of embedding measurements throughout the “Findings” section, given the availability of new tools for quantitative imaging interpretation that enable automated structured reporting of measurement data.
Materials and Methods
Oncologic clinicians and radiologists at our institution were surveyed regarding their preferences for a standard report versus three reports each having uniquely formatted dedicated “Measurements” sections and regarding their impressions of various characteristics of report quality demonstrated by these reports. The online survey was completed by 25 radiologists, 16 oncologists, and 17 oncology nurses and research assistants (registrars).
Results
Aggregation of respondents’ preferences by group into single orderings using the Kemeny–Young method revealed that both oncology groups preferred all proposed reports to the standard report but that radiologists only preferred two of the proposed reports to the standard report. All preferences for proposed reports in the two oncology groups were statistically significant based on Wilcoxon tests, but the preference for only one of the proposed reports was significant for radiologists. Additional results suggest that these preferences are driven by respondent favor for the readability of and confidence conveyed by the proposed reports compared to the standard report.
Conclusions
Oncologic clinicians responding to our survey preferred communication of lesion measurements in a separate report section to the current practice of embedding measurements throughout the “Findings” section, based on their assessments of reports containing simulated measurement sections assembled from a single sample report using standardized formatting.
Imaging-derived tumor measurements serve as critical quantitative biomarkers that are used to apply disease response criteria in routine oncologic care and in pharmaceutical trials and are as—if not more—crucial in guiding patient care in these settings as the qualitative interpretative information that radiologists generally focus on providing when creating reports. Given these clinical expectations, historical reluctance by radiologists to measure tumors and other imaging findings in addition to qualitatively describing and interpreting these findings has given way to the now routine practice of providing quantitative data during imaging interpretation, at least in major US cancer centers . Not coincidentally, many oncologists in the same centers have come to expect that tumor measurements be made routinely for all patients with cancer regardless of whether a given patient is enrolled in a pharmaceutical trial .
Mirroring these reported trends, radiologists at our institution routinely report measured lesions—regardless of a patient’s trial status—in the narrative “Findings” section of the report in prose that combines a qualitative assessment of the lesion with a quantitative assessment, the latter of which consists of the lesion’s size in all relevant dimensions on the current examination, its image and series coordinates, and its size in all relevant dimensions on the prior examination, for example, “left submandibular lymph node has enlarged, measuring 14 × 9 mm on series 7, image 33 (7 × 4 mm on prior study dated January 1, 2001).” In this sentence, it is the qualitative assessment (“has enlarged”) that represents the primary value contributed by the radiologist to the report; all other information is merely translated by the radiologist from the picture archiving and communication system (PACS) display into the report through dictation–transcription and/or typing. Unfortunately, this translated and noninterpreted information constitutes a substantial source of both errors and inefficiency in the reporting process, as these steps are executed by human agents . The demand for quantitative imaging data by ordering physicians as previously discussed only compounds the problems of introduced error and reduced interpretation efficiency associated with its generation. Furthermore, such text-based measurement reporting limits automated measurement summation or computation of disease response metrics and requires the ordering physician to tabulate this data and make any necessary calculations manually , further adding to the inefficiency inherent to current quantitative imaging workflow.
Get Radiology Tree app to read full this article<
Get Radiology Tree app to read full this article<
Get Radiology Tree app to read full this article<
Materials and methods
Get Radiology Tree app to read full this article<
Report Preparation
Get Radiology Tree app to read full this article<
Get Radiology Tree app to read full this article<
Get Radiology Tree app to read full this article<
Get Radiology Tree app to read full this article<
Get Radiology Tree app to read full this article<
Survey
Get Radiology Tree app to read full this article<
Part one
Get Radiology Tree app to read full this article<
Part two
Get Radiology Tree app to read full this article<
Part three
Get Radiology Tree app to read full this article<
Get Radiology Tree app to read full this article<
Analysis
Get Radiology Tree app to read full this article<
Get Radiology Tree app to read full this article<
Results
Part one
Get Radiology Tree app to read full this article<
Table 1
Survey Response Rate by Professional Background
Professional Background Number of Responses Response Rate (%)Radiologists (86 total)2529.1 Resident (34) 12 35.3 Fellow (8) 0 0 Attending (44) 13 29.5Oncologists (84 )1619.0 Fellow (21) 3 14.3 Attending (63) 13 20.6Oncology nurses/clinical research associates (73)1723.3 Nurse (34) 7 20.6 Clinical research associate (39) 10 25.6All respondents (of 243 surveyed)5823.9
Table 2
Survey Part One Results: Responses to the Statement “When I Read a Radiology Report, I Read Measurements…”
Respondent Group Always (5) Most of the Time (4) Frequently (3) Sometimes (2) Never (1) Mean Score (±Standard Deviation) All 41 (73.21%) 11 (19.64%) 2 (3.57%) 2 (3.57%) 0 4.62 (±0.73) Oncologists 12 (75.00%) 3 (18.75%) 1 (6.25%) 0 0 4.68 (±0.60) Oncology registrars 10 (66.67%) 4 (26.67%) 0 (0.00%) 1 (6.67%) 0 4.53 (±0.83) Radiologists 19 (76.00%) 4 (16.00%) 1 (4.00%) 1 (4%) 0 4.64 (±0.76)
Get Radiology Tree app to read full this article<
Part two
Get Radiology Tree app to read full this article<
Table 3
Survey Part Two Results: Report Preference Ranking Responses by Respondent Group and Report Type
Report Type Rank 1 (Most Preferred) Rank 2 Rank 3 Rank 4 (Least Preferred) Mean Rank (±Standard Deviation) Significantly Preferred to Standard Report? ( P Value) ∗ Standard8 (13.79%)8 (13.79%)7 (12.07%)35 (60.34%)3.19 (±1.13) Oncologists 1 (6.25%) 0 2 (12.50%) 13 (81.25%) 3.69 (±0.79) Oncology registrars 0 4 (23.53%) 2 (11.76%) 11 (64.71%) 3.41 (±0.87) Radiologists 7 (28.00%) 4 (16.00%) 3 (12.00%) 11 (44.00%) 2.72 (±1.31)Verbose1 (1.72%)26 (44.83%)30 (51.72%)1 (1.72%)2.53 (±0.57)Strongly (<.0001) Oncologists 0 7 (43.75%) 9 (56.25%) 0 2.56 (±0.51) Strongly (<.0001) Oncology registrars 0 8 (47.06%) 8 (47.06%) 1 (5.88%) 2.59 (±0.62) Strongly (<.0001) Radiologists 1 (4.00%) 11 (44.00%) 13 (52.00%) 0 2.48 (±0.59) No (.1716)Succinct2 (3.45%)21 (36.21%)19 (32.76%)16 (27.59%)2.84 (±0.87)Yes (.0091) Oncologists 0 8 (50.00%) 5 (31.25%) 3 (18.75%) 2.69 (±0.79) Strongly (<.0001) Oncology registrars 1 (5.88%) 5 (29.41%) 7 (41.18%) 4 (23.53%) 2.82 (±0.88) Yes (.0257) Radiologists 1 (4.00%) 8 (32.00%) 7 (28.00%) 9 (36.00%) 2.96 (±0.93) No (.7050)Table47 (81.03%)3 (5.17%)2 (3.45%)6 (10.34%)1.43 (±0.97)Strongly (<.0001) Oncologists 15 (93.75%) 1 (6.25%) 0 0 1.06 (±0.25) Strongly (<.0001) Oncology registrars 16 (94.12%) 0 0 1 (5.88%) 1.18 (±0.73) Strongly (<.0001) Radiologists 16 (64.00%) 2 (8.00%) 2 (8.00%) 5 (20.00%) 1.84 (±1.25) Yes (.0081)
Mean ranks and P values for differences between mean variant rank and mean standard rank are shown in the right-most columns.
Get Radiology Tree app to read full this article<
Get Radiology Tree app to read full this article<
Get Radiology Tree app to read full this article<
Part three
Get Radiology Tree app to read full this article<
Table 4
Survey Part Three Results: Responses to Prompt “In Terms of [Characteristic], I Favor the [Proposed Report] to the Standard Report” by Report Type and Characteristic Assessed
Report Type Characteristic Strongly Agree (1) Agree (2) No Preference (3) Disagree (4) Strongly Disagree (5) Mean Score (±Standard Deviation) ∗ Verbose Structure 16 (29.63%) 28 (51.85%) 6 (11.11%) 4 (7.41%) 1 (1.85%) 2.04 (±0.96) Readability 17 (31.48%) 25 (46.3%) 8 (14.81%) 4 (7.41%) 1 (1.85%) 2.02 (±0.93) Confidence 12 (22.22%) 22 (40.74%) 18 (33.33%) 2 (3.7%) 1 (1.85%) 2.24 (±0.90) Overall 15 (28.3%) 30 (56.6%) 3 (5.66%) 5 (9.43%) 2 (3.77%) 2.07 (±1.02) ‡ Succinct Structure 14 (26.42%) 21 (39.62%) 12 (22.64%) 6 (11.32%) 1 (1.89%) 2.44 (±1.02) Readability 9 (16.98%) 23 (43.4%) 12 (22.64%) 9 (16.98%) 1 (1.89%) 2.24 (±1.03) Confidence 8 (15.38%) 18 (34.62%) 22 (42.31%) 4 (7.69%) 1 (1.92%) 2.47 (±0.91) Overall 8 (15.38%) 18 (34.62%) 22 (42.31%) 4 (7.69%) 1 (1.92%) 2.50 (±1.16) † , ‡ Table Structure 35 (64.81%) 12 (22.22%) 2 (3.7%) 5 (9.26%) 0 1.57 (±0.90) Readability 34 (62.96%) 13 (24.07%) 3 (5.56%) 4 (7.41%) 0 1.57 (±0.94) Confidence 25 (47.17%) 13 (24.53%) 12 (22.64%) 3 (5.66%) 1 (1.89%) 1.92 (±1.04) Overall 36 (69.23%) 11 (21.15%) 2 (3.85%) 3 (5.77%) 2 (3.85%) 1.59 (±1.05) ‡
Get Radiology Tree app to read full this article<
Get Radiology Tree app to read full this article<
Get Radiology Tree app to read full this article<
Get Radiology Tree app to read full this article<
Get Radiology Tree app to read full this article<
Discussion
Get Radiology Tree app to read full this article<
Get Radiology Tree app to read full this article<
Get Radiology Tree app to read full this article<
Get Radiology Tree app to read full this article<
Get Radiology Tree app to read full this article<
Get Radiology Tree app to read full this article<
Get Radiology Tree app to read full this article<
Get Radiology Tree app to read full this article<
Get Radiology Tree app to read full this article<
Acknowledgments
Get Radiology Tree app to read full this article<
Appendix
Invitation E-Mail
Get Radiology Tree app to read full this article<
Get Radiology Tree app to read full this article<
Get Radiology Tree app to read full this article<
Get Radiology Tree app to read full this article<
Get Radiology Tree app to read full this article<
Survey part one
Get Radiology Tree app to read full this article<
Get Radiology Tree app to read full this article<
Get Radiology Tree app to read full this article<
Get Radiology Tree app to read full this article<
Get Radiology Tree app to read full this article<
Get Radiology Tree app to read full this article<
Get Radiology Tree app to read full this article<
Get Radiology Tree app to read full this article<
Get Radiology Tree app to read full this article<
Survey part two
Get Radiology Tree app to read full this article<
Get Radiology Tree app to read full this article<
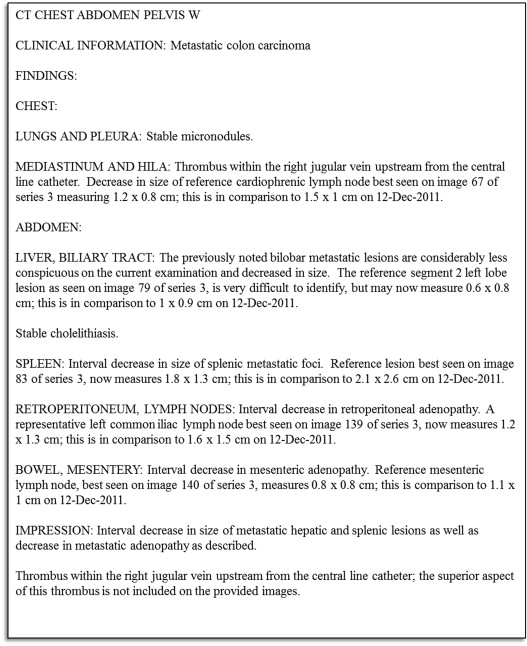
[Picture of standard report with caption “Standard report”]
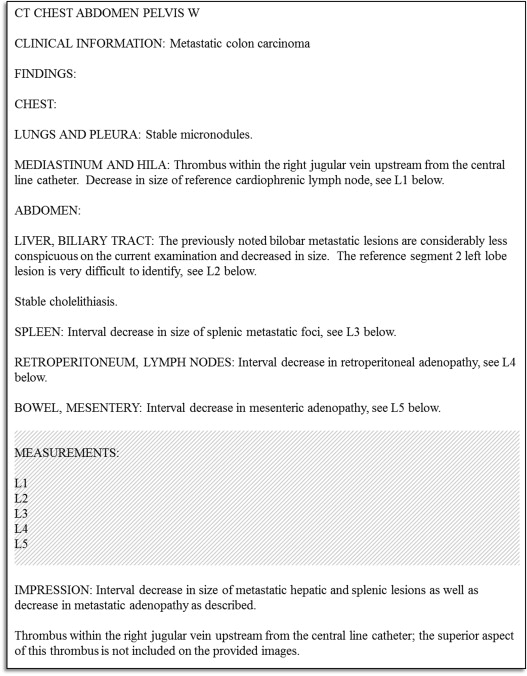
[Picture of verbose report with caption “Variant 1”]
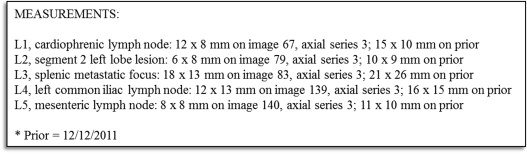
[Picture of succinct report with caption “Variant 2”]
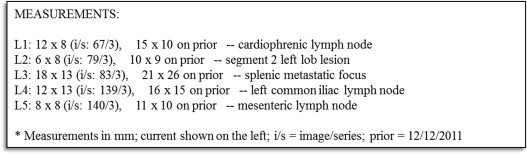
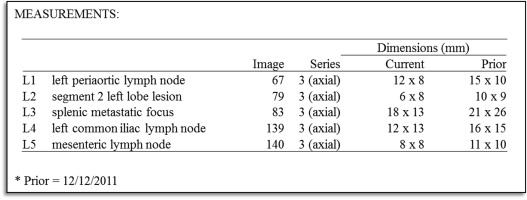
[Picture of table report with caption “Variant 3”]
Get Radiology Tree app to read full this article<
Get Radiology Tree app to read full this article<
Get Radiology Tree app to read full this article<
Get Radiology Tree app to read full this article<
Get Radiology Tree app to read full this article<
Get Radiology Tree app to read full this article<
Get Radiology Tree app to read full this article<
Get Radiology Tree app to read full this article<
Get Radiology Tree app to read full this article<
Survey part three
Get Radiology Tree app to read full this article<
[Picture of verbose report with caption “Variant 1 (copied)”]
Get Radiology Tree app to read full this article<
Get Radiology Tree app to read full this article<
Get Radiology Tree app to read full this article<
Get Radiology Tree app to read full this article<
Get Radiology Tree app to read full this article<
Get Radiology Tree app to read full this article<
Get Radiology Tree app to read full this article<
Get Radiology Tree app to read full this article<
Get Radiology Tree app to read full this article<
Get Radiology Tree app to read full this article<
Get Radiology Tree app to read full this article<
Get Radiology Tree app to read full this article<
[Picture of succinct report with caption “Variant 2 (copied)”]
Get Radiology Tree app to read full this article<
Get Radiology Tree app to read full this article<
Get Radiology Tree app to read full this article<
Get Radiology Tree app to read full this article<
Get Radiology Tree app to read full this article<
Get Radiology Tree app to read full this article<
Get Radiology Tree app to read full this article<
Get Radiology Tree app to read full this article<
Get Radiology Tree app to read full this article<
Get Radiology Tree app to read full this article<
Get Radiology Tree app to read full this article<
[Picture of table report with caption “Variant 3 (copied)”]
Get Radiology Tree app to read full this article<
Get Radiology Tree app to read full this article<
Get Radiology Tree app to read full this article<
Get Radiology Tree app to read full this article<
Get Radiology Tree app to read full this article<
Get Radiology Tree app to read full this article<
Get Radiology Tree app to read full this article<
Get Radiology Tree app to read full this article<
Get Radiology Tree app to read full this article<
Get Radiology Tree app to read full this article<
Get Radiology Tree app to read full this article<
Get Radiology Tree app to read full this article<
References
1. Therasse P., Arbuck S.G., Eisenhauer E.A., et. al.: New guidelines to evaluate the response to treatment in solid tumors. J Natl Cancer Inst 2000; 92: pp. 205-216.
2. Therasse P., Eisenhauer E.A., Verweij J.: RECIST revisited: a review of validation studies on tumour assessment. Eur J Cancer 2006; 42: pp. 1031-1039.
3. van Persijn van Meerten E.L., Gelderblom H., Bloem J.L.: RECIST revised: implications for the radiologist—a review article on the modified RECIST guideline. Eur Radiol 2010; 20: pp. 1456-1467.
4. Pien H.H., Fischman A.J., Thrall J.H., et. al.: Using imaging biomarkers to accelerate drug development and clinical trials. Drug Discov Today 2005; 10: pp. 259-266.
5. Boone J.M.: Radiological interpretation 2020: toward quantitative imaging assessment. Med Phys 2007; 34: pp. 4173-4179.
6. Sullivan D.C.: Imaging as a quantitative science. Radiology 2008; 248: pp. 328-332.
7. Jaffe T.A., Wickersham N.W., Sullivan D.C.: Quantitative imaging in oncology patients: part 1, radiology practice patterns at major U.S. cancer centers. AJR Am J Roentgenol 2010; 195: pp. 101-106.
8. Jaffe T.A., Wickersham N.W., Sullivan D.C.: Quantitative imaging in oncology patients: part 2, oncologists’ opinions and expectations at major U.S. cancer centers. AJR Am J Roentgenol 2010; 195: pp. W19-W30.
9. Zimmerman S.L., Kim W., Boonn W.W.: Informatics in radiology: automated structured reporting of imaging findings using the AIM standard and XML. Radiographics 2011; 31: pp. 881-887.
10. Chang PJ, Sevenster M, Bozeman J, et al. Radiologic measurement dictation and transcription error rates in RECIST (Response Evaluation Criteria In Solid Tumors) clinical trials: a limitation of the radiology narrative report to accurately communicate quantitative data. Radiological Society of North America (RSNA) 99 th Scientific Assembly and Annual Meeting, December 1-6, 2013; scientific formal (paper) presentation, SSQ11-09.
11. Abajian A.C., Levy M., Rubin D.L.: Improving clinical work flow through an AIM database: a sample web-based lesion tracking application. RadioGraphics 2012; 32: pp. 1543-1552.
12. Channin D.S., Mongkolwat P., Kleper V., et. al.: The Annotation and Image Markup project. Radiology 2009; 253: pp. 590-592.
13. Chang PJ, Sevenster M, Travis AR, et al. Improved efficiency and error-reduction of oncology lesion measurement and follow-up via optimized PACS workflow orchestration and integration of an AIM (Annotation and Image Markup)-based lesion tracking tool. RSNA 98th Scientific Assembly and Annual Meeting, November 25-30, 2012; scientific formal (paper) presentation, SSJ13-03.
14. Schwartz L.H., Panicek D.M., Berk A.R., et. al.: Improving communication of diagnostic radiology findings through structured reporting. Radiology 2011; 260: pp. 174-181.
15. Naik S.S., Hanbidge A., Wilson S.R.: Radiology reports: examining radiologist and clinician preferences regarding style and content. AJR Am J Roentgenol 2001; 176: pp. 591-598.
16. Plumb A.A.O., Grieve F.M., Khan S.H.: Survey of hospital clinicians’ preferences regarding the format of radiology reports. Clin Radiol 2009; 64: pp. 386-394.
17. Bosmans J.M.L., Weyler J.J., De Schepper A.M., et. al.: The radiology report as seen by radiologists and referring clinicians: results of the COVER and ROVER surveys. Radiology 2011; 259: pp. 184-195.
18. SurveyMonkey. Available at http://www.surveymonkey.com . Accessed August-September 2012.
19. Kemeny J.: Mathematics without numbers. Daedalus 1959; 88: pp. 557-591.
20. Young H.P., Levenglick A.: A consistent extension of Condorcet’s election principle. SIAM J Applied Math 1978; 35: pp. 285-300.
21. Krupinski E.A., Hall E.T., Jaw S., et. al.: Influence of radiology report format on reading time and comprehension. J Digit Imaging 2012; 25: pp. 63-69.