
Rationale and Objectives
To investigate the conventional magnetic resonance (MR) findings of cervical spinal cord, to explore the possible changes on diffusion tensor imaging (DTI) in patients with amyotrophic lateral sclerosis (ALS), and to assess the correlations between the changes on DTI and clinical parameters in patients with ALS.
Materials and Methods
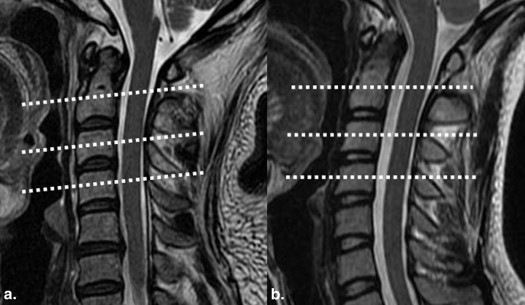
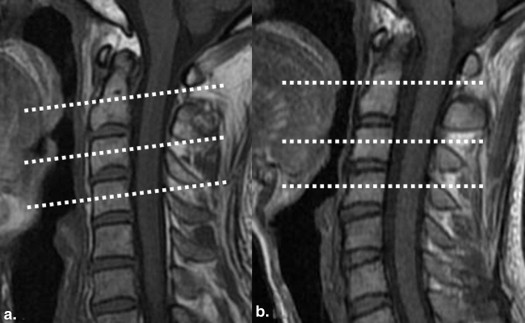
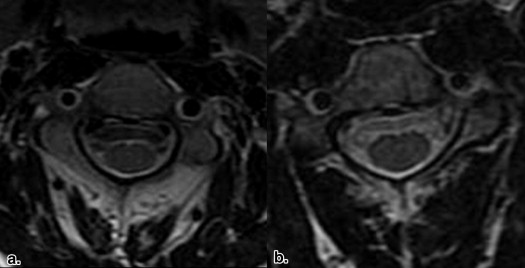
Conventional MR imaging (MRI) and DTI in 24 patients with ALS and 16 age-matched control subjects were obtained. On axial planes, regions of interest (ROIs) were marked in bilateral spinothalamic tracts (STs), posterior funiculus, and bilateral lateral corticospinal tracts (LCTs), respectively, at the levels of cervical 2–4 vertebral bodies. Fractional anisotropy (FA) and apparent diffusion coefficient (ADC) values of these ROIs were estimated. Independent sample t test and Pearson correlation analysis were used.
Results
In patients with ALS, no abnormal findings were noted in the cervical spinal cord on conventional MRI. FA values of bilateral LCTs decreased significantly compared to those of the control group ( P < .05), and ADC values of bilateral LCTs were significantly greater than those of the control group ( P < .05). FA and ADC values of bilateral LCTs showed no significant difference between patients with definite and probable ALS ( P > .05). No significant correlation existed between abnormal DTI parameters (FA and ADC values of bilateral LCTs) and clinical parameters ( P > .05).
Conclusions
Subtle abnormalities in bilateral LCTs in the “normal-appearing” cervical spinal cord can be detected using quantitative DTI technique in patients with ALS.
Amyotrophic lateral sclerosis (ALS) is a fatal neurodegenerative disorder characterized by spinal and cortical motor neuron degeneration. It targets both upper and lower motor neurons . The main histologic changes of ALS include loss of motor neurons and associated astrocytosis . Electromyography, muscle biopsy, and motor unit number estimation are useful for the evaluation of lower motor neuron damage, but there is at present no objective and quantitative radiologic technique in detecting upper motor neuron damage , especially in spinal cord. Although the prognosis of this disease is relatively poor, early application of drug therapy could slow down the disease progression in some patients with ALS, so early detection of subtle injuries and assessment of the disease process are of great importance.
Magnetic resonance imaging (MRI) has been used to investigate the involvement of the corticospinal tracts (CSTs) in brain parenchyma in patients with ALS, and abnormal high signal intensities along CST have been observed on T2-weighted image (T2WI) because of degeneration and demyelination . Theoretically, bilateral lateral corticospinal tracts (LCTs) of the spinal cord, as the extension of CSTs, should also be involved in ALS. Do the LCTs also show abnormal signals on conventional MRI in patients with ALS? If not, can we detect the possible pathologic changes in LCTs using other MR related techniques?
Get Radiology Tree app to read full this article<
Get Radiology Tree app to read full this article<
Materials and Methods
Subjects
Get Radiology Tree app to read full this article<
Magnetic Resonance Imaging
Get Radiology Tree app to read full this article<
Get Radiology Tree app to read full this article<
Get Radiology Tree app to read full this article<
Data Analysis
Get Radiology Tree app to read full this article<

Get Radiology Tree app to read full this article<
Get Radiology Tree app to read full this article<
Statistical Analysis
Get Radiology Tree app to read full this article<
Results
Get Radiology Tree app to read full this article<
Get Radiology Tree app to read full this article<
Get Radiology Tree app to read full this article<
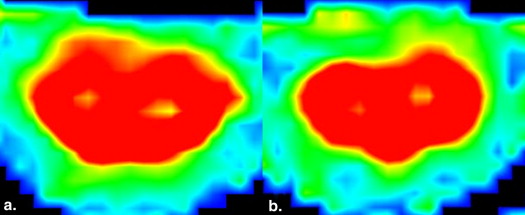
Table 1
Fractional Anisotropy Values of Different Locations at C2–C4 Levels in Control and Patients with ALS
Left ST Right ST P Left LCT Right LCT C2 Control 0.87 ± 0.09 0.87 ± 0.08 0.92 ± 0.10 0.89 ± 0.07 0.88 ± 0.09 ALS 0.91 ± 0.08 0.88 ± 0.11 0.92 ± 0.08 0.71 ± 0.07 0.72 ± 0.07P value .638 .363 .994 .000 .000 C3 Control 0.87 ± 0.06 0.88 ± 0.03 0.91 ± 0.08 0.86 ± 0.10 0.84 ± 0.12 ALS 0.83 ± 0.08 0.84 ± 0.07 0.86 ± 0.09 0.76 ± 0.12 0.75 ± 0.08P value .077 .096 .129 .005 .004 C4 Control 0.83 ± 0.09 0.85 ± 0.09 0.87 ± 0.11 0.82 ± 0.09 0.82 ± 0.10 ALS 0.84 ± 0.07 0.84 ± 0.08 0.86 ± 0.07 0.71 ± 0.09 0.73 ± 0.07P value .575 .605 .576 .003 .007
ALS, amyotrophic lateral sclerosis; LCT, lateral corticospinal tracts; P, posterior funiculus; ST, spinothalamic tracts.
Table 2
Apparent Diffusion Coefficient Values of Different Locations at C2–C4 Levels in Control and Patients with ALS (×10 −3 mm 2 /s)
Left ST Right ST P Left LCT Right LCT C2 Control 0.46 ± 0.18 0.47 ± 0.27 0.53 ± 0.17 0.50 ± 0.17 0.51 ± 0.20 ALS 0.55 ± 0.31 0.54 ± 0.23 0.73 ± 0.44 1.17 ± 0.54 0.96 ± 0.36P value .207 .304 .134 .000 .000 C3 Control 0.47 ± 0.21 0.63 ± 0.17 0.64 ± 0.22 0.64 ± 0.15 0.64 ± 0.17 ALS 0.70 ± 0.20 0.71 ± 0.24 0.73 ± 0.22 0.81 ± 0.20 0.80 ± 0.17P value .201 .114 .479 .013 .045 C4 Control 0.73 ± 0.23 0.53 ± 0.18 0.68 ± 0.26 0.77 ± 0.24 0.74 ± 0.22 ALS 0.69 ± 0.27 0.73 ± 0.41 0.85 ± 0.29 1.08 ± 0.37 0.98 ± 0.28P value .766 .280 .103 .013 .019
ALS, amyotrophic lateral sclerosis; LCT, lateral corticospinal tracts; P, posterior funiculus; ST, spinothalamic tracts.
Get Radiology Tree app to read full this article<
Get Radiology Tree app to read full this article<
Table 3
Fractional Anisotropy Values of Bilateral LCTs at C2–C4 Levels between ALS Groups
C2 C3 C4 Left LCT Probable 0.68 ± 0.09 0.76 ± 0.13 0.73 ± 0.08 Definite 0.74 ± 0.05 0.77 ± 0.06 0.72 ± 0.11P value .167 .720 .524 Right LCT Probable 0.69 ± 0.06 0.76 ± 0.07 0.75 ± 0.06 Definite 0.75 ± 0.08 0.74 ± 0.10 0.73 ± 0.09P value .822 .517 .428
LCT, lateral corticospinal tracts.
Table 4
Apparent Diffusion Coefficient Values (×10 −3 mm 2 /s) of Bilateral LCTs at C2–C4 Levels between ALS Groups
C2 C3 C4 Left LCT Probable 1.44 ± 0.57 0.84 ± 0.21 1.09 ± 0.36 Definite 0.78 ± 0.17 0.73 ± 0.17 0.86 ± 0.25P value .056 .232 .155 Right LCT Probable 1.03 ± 0.32 0.78 ± 0.18 1.05 ± 0.28 Definite 0.75 ± 0.30 0.83 ± 0.18 0.76 ± 0.15P value .596 .539 .151
LCT, lateral corticospinal tracts.
Get Radiology Tree app to read full this article<
Get Radiology Tree app to read full this article<
Get Radiology Tree app to read full this article<
Get Radiology Tree app to read full this article<
Get Radiology Tree app to read full this article<
Get Radiology Tree app to read full this article<
Table 5
Areas of Cervical Spinal Cord on Axial Scan at the Levels of C2–C4 Vertebral Bodies in Control and in Patients with ALS (mm 2 )
C2 C3 C4 Control 65.91 ± 5.84 68.09 ± 5.09 63.00 ± 6.09 ALS 65.60 ± 10.79 64.80 ± 10.05 59.60 ± 11.16P value .920 .331 .449
ALS, amyotrophic lateral sclerosis.
Get Radiology Tree app to read full this article<
Discussion
Get Radiology Tree app to read full this article<
Get Radiology Tree app to read full this article<
Get Radiology Tree app to read full this article<
Get Radiology Tree app to read full this article<
Get Radiology Tree app to read full this article<
Get Radiology Tree app to read full this article<
Conclusions
Get Radiology Tree app to read full this article<
Get Radiology Tree app to read full this article<
References
1. Weydt P., Moller T.: Neuroinflammation in the pathogenesis of amyotrophic lateral sclerosis. Neuroreport 2005; 16: pp. 527-531.
2. Holmes G.: The pathology of amyotrophic lateral sclerosis. Revista de Neurologia 1909; 7: pp. 693-725.
3. Swash M.: Clinical features and diagnosis of amyotrophic lateral sclerosis.Brown R.H.Meininger V.Swash M.Amyotrophic lateral sclerosis.2000.Martin DunitzLondon:pp. 3-30.
4. Lowe J., Lennox G., Leigh P.N.: Disorders of movement and system degenerations.1997.ArnoldLondon:pp. 281-366.
5. Cudkowicz M., Qureshi M., Shefner J.: Measures and markers in amyotrophic lateral sclerosis. NeuroRx 2004; 1: pp. 273-283.
6. Goodin D.S., Rowley H.A., Olney R.K.: Magnetic resonance imaging in amyotrophic lateral sclerosis. Ann Neurol 1988; 23: pp. 418-420.
7. Werring D.J., Clark C.A., Barker G.J., et. al.: Diffusion tensor imaging of lesions and normal-appearing white matter in multiple sclerosis. Neurology 1999; 52: pp. 1626-1632.
8. Droogan A.G., Clark C.A., Werring D.J., et. al.: Comparison of multiple sclerosis clinical subgroups using navigated spin echo diffusion-weighted imaging. Magn Reson Imaging 1999; 17: pp. 653-661.
9. Toosy A.T., Werring D.J., Orrell R.W., et. al.: Diffusion tensor imaging detects corticospinal tract involvement at multiple levels in amyotrophic lateral sclerosis. J Neurol Neurosurg Psychiatry 2003; 74: pp. 1250-1257.
10. Ellis C.M., Simmons A., Jones D.K., et. al.: Diffusion tensor MRI assesses corticospinal tract damage in ALS. Neurology 1999; 53: pp. 1051-1058.
11. Mori S., Kaufmann W.E., Davatzikos C., et. al.: Imaging cortical association tracts in the human brain using diffusion-tensor-based axonal tracking. Magn Reson Med 2002; 47: pp. 215-223.
12. Stieltjes B., Kaufmann W.E., van Zijl P.C., et. al.: Diffusion tensor imaging and axonal tracking in the human brainstem. Neuroimage 2001; 14: pp. 723-735.
13. Davis R.L., Robertson D.M.: Textbook of neuropathology. 3rd ed. Media.1997.Williams & WilkinsPennsylvaniapp. 1149.
14. Wheeler-Kingshott C.A., Hickman S.J., Parker G.J., et. al.: Investigating cervical spinal cord structure using axial diffusion tensor imaging. Neuroimage 2002; 16: pp. 93-102.
15. Brooks B.R., Miller R.G., Swash M., et. al., World Federation of Neurology Research Group on Motor Neuron Diseases: El Escorial revisited: revised criteria for the diagnosis of amyotrophic lateral sclerosis. Amyotroph Lateral Scler Other Motor Neuron Disord 2000; 1: pp. 293-299.
16. Graves M.C., Fiala M., Dinglasan L.A., et. al.: Inflammation in amyotrophic lateral sclerosis spinal cord and brain is mediated by activated macrophages, mast cells and T cells. Amyotroph Lateral Scler Other Motor Neuron Disord 2004; 5: pp. 213-219.
17. Boillee S., Yamanaka K., Lobsiger C.S., et. al.: Onset and progression in inherited ALS determined by motor neurons and microglia. Science 2006; 312: pp. 1389-1392.
18. Song S.K., Sun S.W., Ju W.K., et. al.: Diffusion tensor imaging detects and differentiates axon and myelin degeneration in mouse optic nerve after retinal ischemia. Neuroimage 2003; 20: pp. 1714-1722.
19. Brettschneider J., Kurent J., Ludolph A., et. al.: Drug therapy for pain in amyotrophic lateral sclerosis or motor neuron disease. Cochrane Database Syst Rev 2008; pp. CD005226.
20. Vedantam A., Jirjis M.B., Schmit B.D., et. al.: Diffusion tensor imaging of the spinal cord: insights from animal and human studies. Neurosurgery 2014 Jan; 74: pp. 1-8.
21. Vedantam A., Eckardt G., Wang M.C., et. al.: Clinical correlates of high cervical fractional anisotropy in acute cervical spinal cord injury. World Neurosurg 2013 Sep 18; [Epub ahead of print]
22. Brander A., Koskinen E., Luoto T.M., et. al.: Diffusion tensor imaging of the cervical spinal cord in healthy adult population: normative values and measurement reproducibility at 3T MRI. Acta Radiol 2013 Aug 22; [Epub ahead of print]
23. Valsasina P., Agosta F., Benedetti B., et. al.: Diffusion anisotropy of the cervical cord is strictly associated with disability in amyotrophic lateral sclerosis. J Neurol Neurosurg Psychiatry 2007; 78: pp. 480-484.
24. Agosta F., Rocca M.A., Valsasina P., et. al.: A longitudinal diffusion tensor MRI study of the cervical cord and brain in amyotrophic lateral sclerosis patients. J Neurol Neurosurg Psychiatry 2009; 80: pp. 53-55.
25. Nair G., Carew J.D., Usher S., et. al.: Diffusion tensor imaging reveals regional differences in the cervical spinal cord in amyotrophic lateral sclerosis. Neuroimage 2010; 53: pp. 576-583.