
Rationale and Objectives
The treatment of nonmelanoma skin cancer (NMSC) is usually by surgical excision or Mohs micrographic surgery and alternatively may include photodynamic therapy (PDT). To guide surgery and to optimize PDT, information about the tumor structure, optical parameters, and vasculature is desired.
Materials and Methods
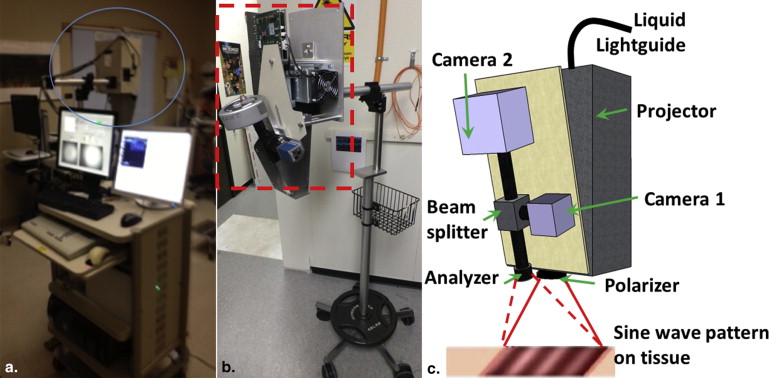
Spatial frequency domain imaging (SFDI) can map optical absorption, scattering, and fluorescence parameters that can enhance tumor contrast and quantify light and photosensitizer dose. High frequency ultrasound (HFUS) imaging can provide high-resolution tumor structure and depth, which is useful for both surgery and PDT planning.
Results
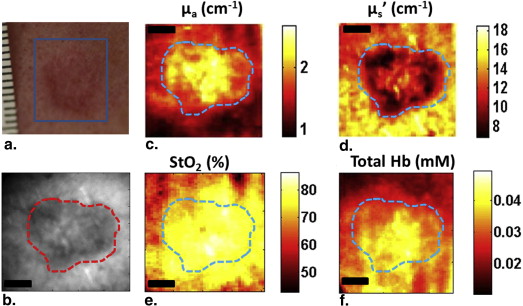
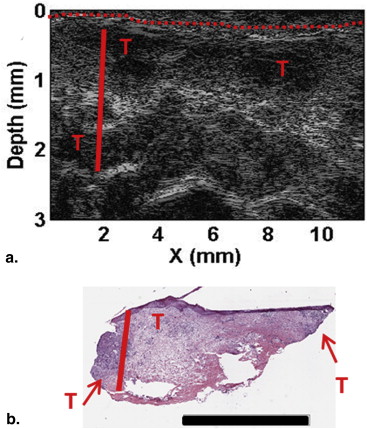
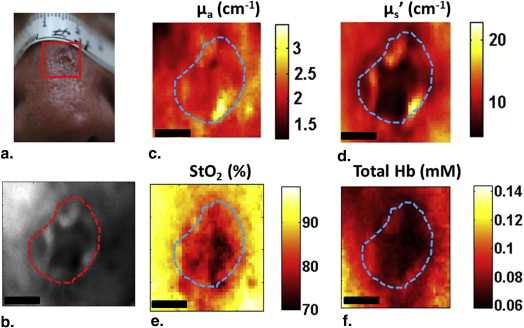
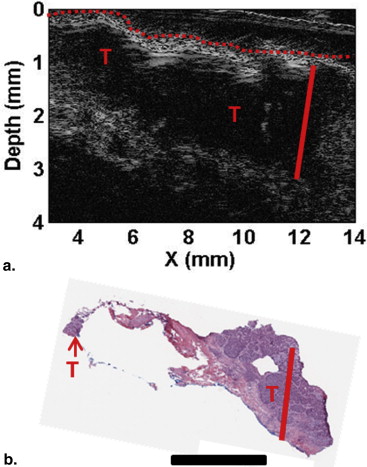
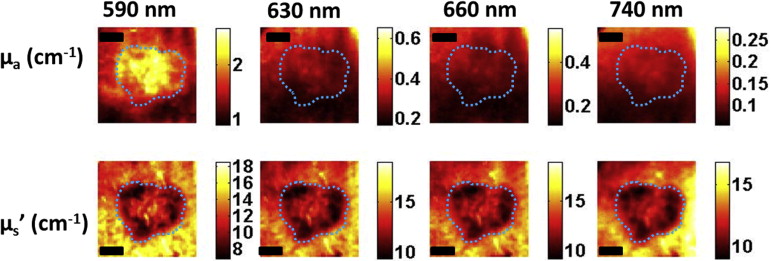
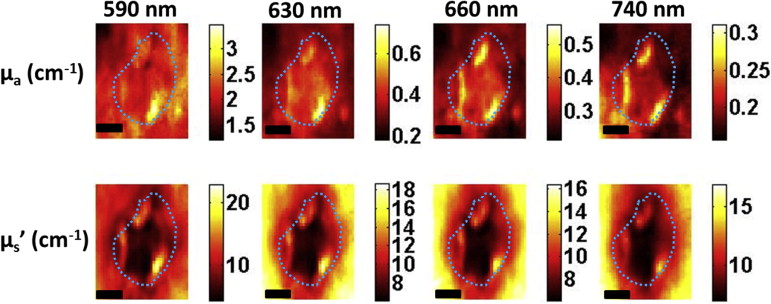
Here, we present preliminary results from our recently developed clinical instrument for patients with NMSC. We quantified optical absorption and scattering, blood oxygen saturation (StO 2 ), and total hemoglobin concentration (THC) with SFDI and lesion thickness with ultrasound. These results were compared to histological thickness of excised tumor sections.
Conclusions
SFDI quantified optical parameters with high precision, and multiwavelength analysis enabled 2D mappings of tissue StO 2 and THC. HFUS quantified tumor thickness that correlated well with histology. The results demonstrate the feasibility of the instrument for noninvasive mapping of optical, physiological, and ultrasound contrasts in human skin tumors for surgery guidance and therapy planning.
Nonmelanoma skin cancers (NMSCs), which include basal cell carcinoma (BCC) and squamous cell carcinoma (SCC), are the most common human cancer with more than one million cases every year, and the incidence rate has increased dramatically. Although they rarely metastasize, they can present significant morbidity especially for cases in cosmetically sensitive areas, such as the face. The standard of care for NMSCs is usually surgical excision or Mohs micrographic surgery. Tumors may show multifocal, widespread disease, and suspicious lesions at deeper locations may be present. Typically, biopsies are performed to guide surgeons but can be time-consuming and costly, and the analyzed sections may not be representative of the whole tumor. After surgical removal of the tumor, there may still be residual tumor at the margins, which can result in high-recurrence rates. Thus, the surgeon needs to decide on how much to excise and how deep to go during surgery. Surgery can benefit from prior knowledge of size and depth for more accurate lesion removal. An imaging tool that can provide guidance and thereby reduce recurrence rates, operation times, cost, and the need for multiple biopsies would be highly desired.
Depth and size information can also provide useful information for selecting the appropriate therapy. Topical 5-aminolaevulinic acid (ALA)–based photodynamic therapy (ALA-PDT) has become an attractive treatment option especially for cases with multiple sites and large areas . ALA-PDT uses topical application of the prodrug ALA that is converted into the photosensitizer (PS) protoporphyrin IX (PpIX), which is activated by light in the presence of oxygen for local tissue destruction. For superficial NMSCs, ALA-PDT has efficacy close to surgery with sometimes better cosmetic and functional outcomes. However, the efficacy is limited for thicker and deeper tumors . Thus, tumor size information can allow for a better PDT planning.
Get Radiology Tree app to read full this article<
Get Radiology Tree app to read full this article<
Get Radiology Tree app to read full this article<
Get Radiology Tree app to read full this article<
Materials and methods
Clinical Spatial Frequency Domain and Ultrasound Imaging Systems
Get Radiology Tree app to read full this article<
Get Radiology Tree app to read full this article<
Get Radiology Tree app to read full this article<
Get Radiology Tree app to read full this article<
Get Radiology Tree app to read full this article<
Quantification of Optical and Vascular Parameters
Get Radiology Tree app to read full this article<
Histopathologic Examination
Get Radiology Tree app to read full this article<
Results and discussion
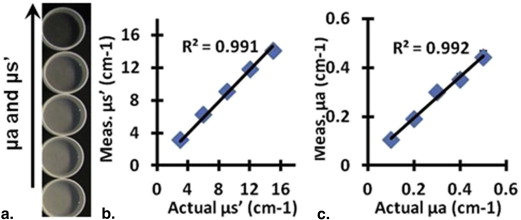
Phantom Imaging
Get Radiology Tree app to read full this article<
Get Radiology Tree app to read full this article<
Patient Imaging
Get Radiology Tree app to read full this article<
Get Radiology Tree app to read full this article<
Get Radiology Tree app to read full this article<
Get Radiology Tree app to read full this article<
Get Radiology Tree app to read full this article<
Get Radiology Tree app to read full this article<
Get Radiology Tree app to read full this article<
Get Radiology Tree app to read full this article<
Table 1
Reconstructed SFDI and HFUS Parameters for Two Patients (Mean ± Standard Deviation [SD])
Parameter Patient 1 (BCC) Patient 2 (SCC) Tumor Normal_P_ Value Tumor Normal_P_ Value Mean ± SD Mean ± SD Mean ± SD Mean ± SD Optical absorption at 630 nm (cm −1 ) 0.27 ± 0.03 0.21 ± 0.02 <.0001 0.41 ± 0.06 0.32 ± 0.04 <.0001 Optical scattering at 630 nm (cm −1 ) 11.77 ± 1.20 14.97 ± 0.97 <.0001 10.83 ± 2.47 13.77 ± 2.62 <.0001 Optical penetration depth at 630 nm (mm) 3.19 ± 0.51 3.25 ± 0.34 <.0001 2.69 ± 0.73 2.74 ± 0.63 <.0001 StO 2 (%) 82.30 ± 2.75 76.85 ± 6.23 <.0001 83.74 ± 4.95 89.73 ± 2.60 <.0001 THC (mmol) 0.05 ± 0.01 0.03 ± 0.01 <.0001 0.07 ± 0.01 0.08 ± 0.01 <.0001 Max thickness-HFUS (mm) 1.79 ± 0.05 1.86 ± 0.02 Max thickness-Mohs (mm) 1.76 1.87
BCC, basal cell carcinoma; HFUS, high frequency ultrasound; SFDI, spatial frequency domain imaging; SCC, squamous cell carcinoma.
Get Radiology Tree app to read full this article<
Get Radiology Tree app to read full this article<
Get Radiology Tree app to read full this article<
Get Radiology Tree app to read full this article<
Conclusions
Get Radiology Tree app to read full this article<
Acknowledgments
Get Radiology Tree app to read full this article<
References
1. Ericson M.B., Wennberg A.M., Larko O.: Review of photodynamic therapy in actinic keratosis and basal cell carcinoma. Ther Clin Risk Manag 2008; 4: pp. 1-9.
2. Kalka K., Merk H., Mukhtar H.: Photodynamic therapy in dermatology. J Am Acad Dermatol 2000; 42: pp. 389-413.
3. Maytin E.V., Anand N., Baran C., et. al.: Enhancement and optimization of PpIX-based photodynamic therapy of skin cancer: translational studies from bench to clinic. Proc SPIE 2009; 7164: 71640K-9
4. van den Akker J.T., de Bruijn H.S., Beijersbergen van Henegouwen G.M., et. al.: Protoporphyrin IX fluorescence kinetics and localization after topical application of ALA pentyl ester and ALA on hairless mouse skin with UVB-induced early skin cancer. Photochem Photobiol 2000; 72: pp. 399-406.
5. Rhodes L.E., de Rie M., Enstrom Y., et. al.: Photodynamic therapy using topical methyl aminolevulinate vs surgery for nodular basal cell carcinoma: results of a multicenter randomized prospective trial. Arch Dermatol 2004; 140: pp. 17-23.
6. Rhodes L.E., de Rie M.A., Leifsdottir R., et. al.: Five-year follow-up of a randomized, prospective trial of topical methyl aminolevulinate photodynamic therapy vs surgery for nodular basal cell carcinoma. Arch Dermatol 2007; 143: pp. 1131-1136.
7. Busch T.M., Xing X., Yu G., et. al.: Fluence rate-dependent intratumor heterogeneity in physiologic and cytotoxic responses to Photofrin photodynamic therapy. Photochem Photobiol Sci 2009; 8: pp. 1683-1693.
8. Zhou X., Pogue B.W., Chen B., et. al.: Pretreatment photosensitizer dosimetry reduces variation in tumor response. Int J Radiat Oncol Biol Phys 2006; 64: pp. 1211-1220.
9. Georgakoudi I., Nichols M.G., Foster T.H.: The mechanism of Photofrin photobleaching and its consequences for photodynamic dosimetry. Photochem Photobiol 1997; 65: pp. 135-144.
10. Wilson B.C., Patterson M.S.: The physics, biophysics and technology of photodynamic therapy. Phys Med Biol 2008; 53: pp. R61-109.
11. Henderson B.W., Gollnick S.O., Snyder J.W., et. al.: Choice of oxygen-conserving treatment regimen determines the inflammatory response and outcome of photodynamic therapy of tumors. Cancer Res 2004; 64: pp. 2120-2126.
12. Cuccia D.J., Bevilacqua F., Durkin A.J., et. al.: Quantitation and mapping of tissue optical properties using modulated imaging. J Biomed Opt 2009; 14: pp. 024012.
13. Saager R.B., Cuccia D.J., Saggese S., et. al.: A light emitting diode (LED) based spatial frequency domain imaging system for optimization of photodynamic therapy of nonmelanoma skin cancer: quantitative reflectance imaging. Lasers Surg Med 2013; 45: pp. 207-215.
14. Azhari H.: Ultrasound: medical imaging and beyond (an invited review). Curr Pharm Biotechnol 2012; 13: pp. 2104-2116.
15. Marmur E.S., Berkowitz E.Z., Fuchs B.S., et. al.: Use of high-frequency, high-resolution ultrasound before Mohs surgery. official publication for American Society for Dermatologic Surgery Dermatol Surg 2010; 36: pp. 841-847.
16. Schmid-Wendtner M.H., Burgdorf W.: Ultrasound scanning in dermatology. Arch Dermatol 2005; 141: pp. 217-224.
17. Gruber J.D., Paliwal A., Krishnaswamy V., et. al.: System development for high frequency ultrasound-guided fluorescence quantification of skin layers. J Biomed Opt 2010; 15: pp. 026028.
18. Moore J.V., Allan E.: Pulsed ultrasound measurements of depth and regression of basal cell carcinomas after photodynamic therapy: relationship to probability of 1-year local control. Br J Dermatol 2003; 149: pp. 1035-1040.
19. Jacques SL, ed. Optics of light dosimetry for PDT in superficial lesions versus bulky tumors. Proc SPIE, 2002; 4612:59-68.
20. Chin C.W., Foss A.J., Stevens A., et. al.: Differences in the vascular patterns of basal and squamous cell skin carcinomas explain their differences in clinical behaviour. J Pathol 2003; 200: pp. 308-313.
21. Gioux S., Mazhar A., Cuccia D.J., et. al.: Three-dimensional surface profile intensity correction for spatially modulated imaging. J Biomed Opt 2009; 14: pp. 034045.
22. Sunar U., Rohrbach D., Morgan J., et. al.: Quantification of PpIX concentration in basal cell carcinoma and squamous cell carcinoma models using spatial frequency domain imaging. Biomed Opt Express 2013; 4: pp. 531-537.
23. Saager R.B., Cuccia D.J., Saggese S., et. al.: Quantitative fluorescence imaging of protoporphyrin IX through determination of tissue optical properties in the spatial frequency domain. J Biomed Opt 2011; 16: pp. 126013.