
Rationale and Objectives
Pulmonary edema and pulmonary hypertension are postsurgical complications of pneumonectomy that may represent the remaining pulmonary vasculature’s inability to accommodate the entirety of the cardiac output. Quantification of the aggregate pulmonary vascular cross-sectional area (CSA) has been used to study the development of pulmonary vascular disease in smokers. In this study, we applied this technique to demonstrate the potential utility of pulmonary vascular quantification in surgical risk assessment. Our hypothesis was that those subjects with the lowest aggregate vascular CSA in the nonoperative lung would be most likely to have elevated pulmonary vascular pressures in the postoperative period.
Materials and Methods
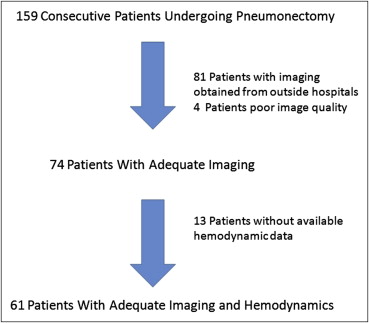
A total of 61 subjects with postoperative hemodynamics and adequate imaging were identified from 159 patients undergoing pneumonectomies for mesothelioma. The total CSA of blood vessels perpendicular to the plane of computed tomographic (CT) scan slices was computed for blood vessels <5 mm 2 (CSA 5 mm). This measurement expressed as a percentage of lung parenchyma area (CSA 5%) was compared to postoperative hemodynamic measurements obtained by right heart catheterization.
Results
In patients where a contrasted CT scan was used ( n = 26), CSA 5% was correlated with postoperative day 0 minimum cardiac index ( R = 0.37, P = .03) but not with the maximum pulmonary arterial pressures. In patients with noncontrast CT scans ( n = 35), CSA 5% was inversely correlated with postoperative day 0 maximum pulmonary arterial pressures ( R = 0.43, P = .03) but not with the minimum cardiac index. The preoperative perfusion fraction of the nonsurgical lung did not correlate with postoperative hemodynamics.
Conclusions
CSA of pulmonary vasculature with an area ≤5 mm 2 has potential in estimating the ability of pulmonary vascular bed to accommodate postsurgical changes in pneumonectomy.
A detailed preprocedure assessment of patients undergoing lung resection has become a key component for the estimation of perioperative risk . In the case of patients undergoing pneumonectomy, the goals of this evaluation is to predict postoperative lung function, the potential for ventilatory compromise, pulmonary edema, and Acute Respiratory Distress Syndrome (ARDS) . Such patients are also at an increased risk for the development of both transient elevations of pulmonary arterial pressures (PAPs) and sustained postoperative pulmonary hypertension . Previous studies suggest that preoperative pulmonary vascular resistance and intraoperative PAPs are predictive of postoperative respiratory failure and mortality . In another example, the risk of developing postoperative pulmonary edema and ARDS was related to the preoperative distribution of lung perfusion . In aggregate, the risk for developing postpneumonectomy complications appears to be related to the ability of the nonoperative lung to accommodate an increase in blood flow to the full cardiac output. Noninvasive identification of compromised pulmonary vasculature in the nonoperative lung may reduce morbidity and mortality associated with this procedure.
Our group has previously described a semiautomated quantification method to calculate the total cross-sectional area (CSA) of the pulmonary vasculature on computed tomographic (CT) scans of the chest. The objective of these efforts is to develop and refine techniques to characterize vascular architecture from imaging. Using these tools, we hypothesized that those subjects with the smallest vascular CSA in the nonoperative lung as assessed by preoperative CT scans would be at greatest risk for hemodynamic compromise in the immediate postoperative period. To investigate this hypothesis, we performed a secondary analysis of clinically acquired CT scans and hemodynamic data on subjects undergoing extrapleural pneumonectomy at our institution.
Methods
Get Radiology Tree app to read full this article<
Get Radiology Tree app to read full this article<
Get Radiology Tree app to read full this article<
Results
Get Radiology Tree app to read full this article<
Get Radiology Tree app to read full this article<
Get Radiology Tree app to read full this article<
Table 1
Demographic Data for 61 Subjects Undergoing Extrapleural Pneumonectomy
Demographics and Characteristics Without Contrast (I−) n = 35 With Contrast (I+) n = 26P Value Right pneumonectomy 21 (60%) 9 (35%) Left pneumonectomy 14 (40%) 17 (65%) .07 Age (years) 62.6 59.7 .51 Female 7 (20%) 7 (27%) .55 Positive smoking history 18 (51%) 9 (34%) .30 PY smoking history 11.5 9.8 .51 Maximum systolic PAPs POD 0 (SD) 41 mm Hg (7.5) 39 mm Hg (7.0) .12 Maximum systolic PAPs POD 1 (SD) 44 mm Hg (9.0) 44 mm Hg (8.0) .86 Minimum CI POD 0 (SD) 2.9 (0.9) 2.7 (0.8) .49 Minimum CI POD 1 (SD) 2.6 (0.7) 2.4 (0.4) .29 Median ICU stay (days) 6 7 .29 Median hospital stay (days) 13 14 .91
CI, cardiac index; ICU, intensive care unit; PAP, pulmonary arterial pressure; POD, postoperative day; SD, standard deviation; PY, pack years.
Get Radiology Tree app to read full this article<
Get Radiology Tree app to read full this article<
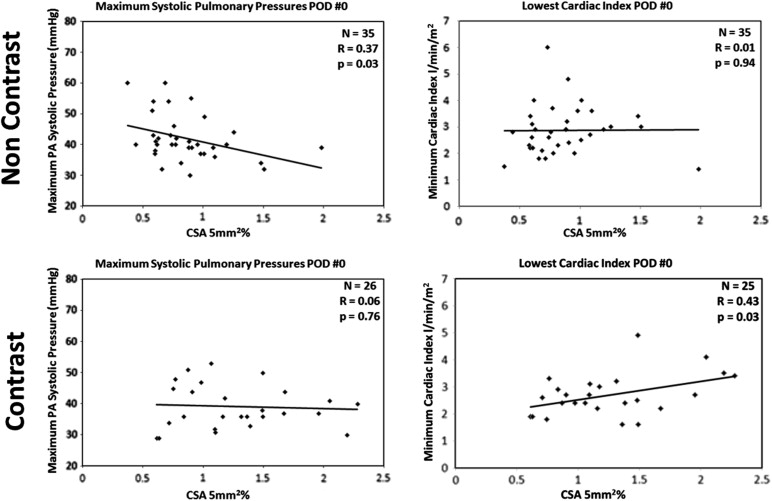
Table 2
Comparison of the Percentage of Perfusion in the Nonoperative Lung as Assessed by a Nuclear Perfusion Scan and Hemodynamic Parameters, Compared to the Correlation with CSA 5% and CSA 10%
Measurement Without Contrast With Contrast Correlation with Nonoperative Perfusion Fraction Correlation with CSA 5% Correlation with CSA 10% Correlation with Nonoperative Perfusion Fraction Correlation with CSA 5% Correlation with CSA 10% Maximum PAP POD 0R = 0.06, P > .5R = 0.37, P = .03R = 0.37, P = .03R = 0.07, P > .5R = 0.06, P > .5R = 0.13, P > .5 Minimum Cardiac Index POD 0R = 0.05, P > .5R = 0.01, P > .5R = 0.12, P = .94R = 0.09, P > .5R = 0.43, P = .03R = 0.45, P = .03 Nonoperative Perfusion Fraction_R_ = 0.27, P = .11R = 0.34, P = .04R = 0.33, P = .12R = 0.32, P = .12
CSA, cross-sectional area; POD, postoperative day; PAP, Pulmonary Arterial Pressure.
Get Radiology Tree app to read full this article<
Get Radiology Tree app to read full this article<
Get Radiology Tree app to read full this article<
Table 3
Correlation Between Regional Measures of CSA 5% and Postoperative Hemodynamics
Correlation Measured Apical Slice Carina Slice Caudal Slice Without contrast ( n = 35) POD 0 max PAP versus CSA 5%R = 0.30, P = .08R = 0.34, P = .05R = 0.38, P = .03 With contrast ( n = 26) POD 0 min CI versus CSA 5%R = 0.40, P = .05R = 0.31, P = .13R = 0.46, P = .02
CI, cardiac index; CSA, cross-sectional area; PAP, pulmonary arterial pressure; POD, postoperative day.
Table 4
Cross-sectional Area (CSA) of Circular Objects Representing Vasculature Running Perpendicular to the Plane of the Computed Tomographic Slices with Area of 5 mm 2 Divided by Area of Lung in the Slice (CSA 5%). CSA 10% Represents Detected Vessels with Area <10 mm 2 . Overall There is a Statistically Significant Difference in CSA 5% Between the Subjects with Contrast and Those without ( P = .001)
Measurement CSA 5% CSA 10% Without contrast ( n = 35) 0.87 ± 0.33 1.22 ± 0.37 Right lung removed ( n = 21) 0.76 ± 0.19 1.1 ± 0.23 Left lung removed ( n = 14) 1.03 ± 0.41 1.39 ± 0.47 Top slice ( n = 35) 1.04 ± 0.33 1.68 ± 0.40 Carina slice ( n = 35) 0.84 ± 0.37 1.12 ± 0.43 Caudal slice ( n = 35) 0.79 ± 0.34 1.05 ± 0.42 With contrast ( n = 26) 1.27 ± 0.48 1.68 ± 0.57 Right lung removed ( n = 9) 1.22 ± 0.50 1.61 ± 0.56 Left lung removed ( n = 17) 1.30 ± 0.48 1.72 ± 0.59 Top slice ( n = 26) 1.35 ± 0.48 1.96 ± 0.64 Carina slice ( n = 26) 1.39 ± 0.49 1.69 ± 0.59 Caudal slice ( n = 26) 1.20 ± 0.58 1.54 ± 0.70
Get Radiology Tree app to read full this article<
Discussion
Get Radiology Tree app to read full this article<
Get Radiology Tree app to read full this article<
Get Radiology Tree app to read full this article<
Get Radiology Tree app to read full this article<
Get Radiology Tree app to read full this article<
Get Radiology Tree app to read full this article<
Conclusions
Get Radiology Tree app to read full this article<
Get Radiology Tree app to read full this article<
Appendix 1
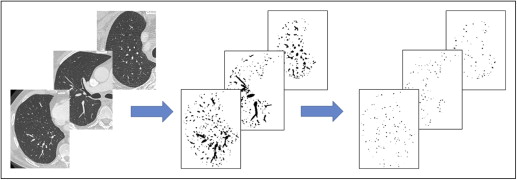
Method of computing CSA 5%
Get Radiology Tree app to read full this article<
References
1. Kearney D.J., Lee T.H., Reilly J.J., et. al.: Assessment of operative risk in patients undergoing lung resection. Importance of predicted pulmonary function. Chest 1994; 105: pp. 753-759.
2. Ribas J., Jimenez M.J., Barbera J.A., et. al.: Gas exchange and pulmonary hemodynamics during lung resection in patients at increased risk: relationship with preoperative exercise testing. Chest 2001; 120: pp. 852-859.
3. Stephan F., Boucheseiche S., Hollande J., et. al.: Pulmonary complications following lung resection: a comprehensive analysis of incidence and possible risk factors. Chest 2000; 118: pp. 1263-1270.
4. Zeldin R.A., Normandin D., Landtwing D., et. al.: Postpneumonectomy pulmonary edema. J Thorac Cardiovasc Surg 1984; 87: pp. 359-365.
5. Verheijen-Breemhaar L., Bogaard J.M., van den Berg B., et. al.: Postpneumonectomy pulmonary oedema. Thorax 1988; 43: pp. 323-326.
6. Kim J.B., Lee S.W., Park S.I., et. al.: Risk factor analysis for postoperative acute respiratory distress syndrome and early mortality after pneumonectomy: the predictive value of preoperative lung perfusion distribution. J Thorac Cardiovasc Surg 2010; 140: pp. 26-31.
7. Foroulis C.N., Kotoulas C.S., Kakouros S., et. al.: Study on the late effect of pneumonectomy on right heart pressures using Doppler echocardiography. Eur J Cardiothorac Surg 2004; 26: pp. 508-514.
8. Venuta F., Sciomer S., Andreetti C., et. al.: Long-term Doppler echocardiographic evaluation of the right heart after major lung resections. Eur J Cardiothorac Surg 2007; 32: pp. 787-790.
9. Deslauriers J., Ugalde P., Miro S., et. al.: Adjustments in cardiorespiratory function after pneumonectomy: results of the pneumonectomy project. J Thorac Cardiovasc Surg 2011; 141: pp. 7-15.
10. Rams J.J., Harrison R.W., Fry W.A., et. al.: Operative pulmonary artery pressure measurements as a guide to postoperative management and prognosis following pneumonectomy. Dis Chest 1962; 41: pp. 85-90.
11. Fee H.J., Holmes E.C., Gewirtz H.S., et. al.: Role of pulmonary vascular resistance measurements in preoperative evaluation of candidates for pulmonary resection. J Thorac Cardiovasc Surg 1978; 75: pp. 519-524.
12. Parquin F., Marchal M., Mehiri S., et. al.: Post-pneumonectomy pulmonary edema: analysis and risk factors. Eur J Cardiothorac Surg 1996; 10: pp. 929-932. discussion 933
13. Zellos L., Jaklitsch M.T., Al-Mourgi M.A., et. al.: Complications of extrapleural pneumonectomy. Semin Thorac Cardiovasc Surg 2007; 19: pp. 355-359.
14. Matsuoka S., Washko G.R., Dransfield M.T., et. al.: Quantitative CT measurement of cross-sectional area of small pulmonary vessel in COPD: correlations with emphysema and airflow limitation. Acad Radiol 2010; 17: pp. 93-99.
15. Matsuoka S., Washko G.R., Yamashiro T., et. al.: Pulmonary hypertension and computed tomography measurement of small pulmonary vessels in severe emphysema. Am J Respir Crit Care Med 2010; 181: pp. 218-225.
16. Software:, Developed By National Institutes of Health, Bethesda, Maryland, USA. Information and free download of Image J can be found at http://rsbweb.nih.gov/ij/ .
17. Fung Y.C., Sobin S.S.: Elasticity of the pulmonary alveolar sheet. Circ Res 1972; 30: pp. 451-469.
18. Hanson W.L., Emhardt J.D., Bartek J.P., et. al.: Site of recruitment in the pulmonary microcirculation. J Appl Physiol (1985) 1989; 66: pp. 2079-2083.
19. Presson R.G., Baumgartner W.A., Peterson A.J., et. al.: Pulmonary capillaries are recruited during pulsatile flow. J Appl Physiol (1985) 2002; 92: pp. 1183-1190.
20. Estepar R.S., Kinney G.L., Black-Shinn J.L., et. al.: Computed tomographic measures of pulmonary vascular morphology in smokers and their clinical implications. Am J Respir Crit Care Med 2013; 188: pp. 231-239.