
Rationale and Objectives
To assess whether r__2 \* values can be used to determine the nuclear grade of clear cell renal cell carcinomas (CRCC).
Materials and Methods
A total of 26 patients with pathologically proven CRCCs underwent blood oxygen level-dependent magnetic resonance imaging. r__2 \* values were determined for the solid components of CRCC lesions. Histological nuclear grade was determined for each lesion. All patients were divided into low- and high-grade groups. r__2 \* values were compared between different grades and between low- and high- grade groups. Receiver operating characteristic curve was drawn to establish the cutoff point for r__2 \* values. The correlation between r__2 \* values and pathological groups was assessed.
Results
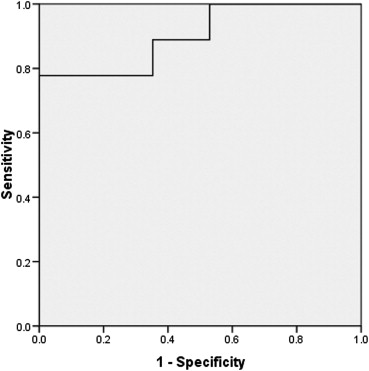
Low-grade group (grades I + II) contained 17 cases and high-grade group (grades III + IV) contained nine cases. The intraclass correlation coefficient for r__2 \* values was 0.89. Significant difference was seen between different grades ( P < .005). r__2 \* values of the high-grade group were higher than the low-grade group ( P < .005). A sensitivity of 78% and a specificity of 100% were achieved with a cutoff of 31.87 seconds −1 . r__2 \* values directly correlated with pathological groups ( P < .005).
Conclusion
r__2 \* values of CRCCs could be employed as a noninvasive biomarker to help classify the nuclear grade of CRCC.
Introduction
Renal cell carcinoma (RCC) is the most common type of primary renal malignancy in adults, responsible for approximately 85%–90% of cases . Clear cell renal cell carcinoma (CRCC) is the most common histological subtype of RCCs, accounting for 75%–88% of RCCs . Patients with CRCC tend to have a worse prognosis than patients with other subtypes of RCC .
Tumor stage and nuclear grade are two different approaches used to predict prognosis of CRCC. Tumor stage correlates with 5-year recurrence-free survival rate, but it cannot predict prognosis of patients within the same stage . Because more early-stage RCCs are being discovered incidentally with modern imaging techniques, differentiating tumors with aggressive behavior at an early stage is very crucial. Fuhrman nuclear grade is the most widely used to determine histological grade of RCC and correlates closely with growth rate and prognosis of CRCCs . Five-year survival rates of RCCs decrease stepwise in ascending order of Fuhrman nuclear grade . In addition, in cases of extensive nonresectable tumors, nuclear grades are necessary for deciding targeted therapy .
Get Radiology Tree app to read full this article<
Materials and methods
Ethics Statement
Get Radiology Tree app to read full this article<
Subjects
Get Radiology Tree app to read full this article<
Get Radiology Tree app to read full this article<
MRI Examinations
Get Radiology Tree app to read full this article<
Get Radiology Tree app to read full this article<
Get Radiology Tree app to read full this article<
Get Radiology Tree app to read full this article<
Imaging Analysis
Get Radiology Tree app to read full this article<
Get Radiology Tree app to read full this article<
r2⋆=1/T2⋆ r
2
⋆
=
1
/
T
2
⋆
Get Radiology Tree app to read full this article<
Histological Analysis
Get Radiology Tree app to read full this article<
Statistical Analyses
Get Radiology Tree app to read full this article<
Results
Histological Results
Get Radiology Tree app to read full this article<
Size
Get Radiology Tree app to read full this article<
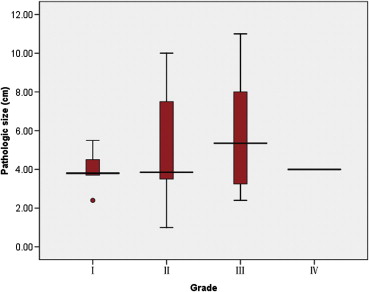
Table 1
Tumor Sizes Distributed according to Fuhrman Grade
Tumor Sizes Fuhrman Grade I II III IV ≤4 cm 3 7 3 1 >4 cm but ≤7 cm 2 2 2 0 >7 cm but ≤10 cm 0 3 2 0 >10 cm 0 0 1 0
Get Radiology Tree app to read full this article<
r 2 \* Results
Get Radiology Tree app to read full this article<
Table 2
r__2 \* Values of Different Tumor Grades (seconds −1 )
Pathological Grade Number of Cases_r__2_ \* Value; Mean ± SD (95% CI) Observer 1 Observer 2 I 5 17.50 ± 5.18 (11.06–23.93) 14.27 ± 4.85 (8.29–20.30) II 12 22.77 ± 7.20 (18.20–27.35) 22.92 ± 7.58 (13.51–32.34) III 8 36.98 ± 8.68 (29.73–44.25) 30.78 ± 9.73 (18.70–42.86) IV 1 63.93 68.49 Low grade 17 21.22 ± 6.96 (17.64–24.80) 17.73 ± 7.44 (12.01–23.46) High grade 9 39.98 ± 12.11 (30.67–49.29) 37.65 ± 14.09 (26.82–48.49)
Get Radiology Tree app to read full this article<
Get Radiology Tree app to read full this article<
Get Radiology Tree app to read full this article<
Get Radiology Tree app to read full this article<
Get Radiology Tree app to read full this article<
Get Radiology Tree app to read full this article<
Discussion
Get Radiology Tree app to read full this article<
Get Radiology Tree app to read full this article<
Get Radiology Tree app to read full this article<
Get Radiology Tree app to read full this article<
Get Radiology Tree app to read full this article<
Get Radiology Tree app to read full this article<
Get Radiology Tree app to read full this article<
Get Radiology Tree app to read full this article<
References
1. Lam J.S., Klatte T., Breda A.: Staging of renal cell carcinoma: current concepts. Ind J Urol 2009; 25: pp. 446-454.
2. Patard J.J., Leray E., Rioux-Leclercq N., et. al.: Prognostic value of histologic subtypes in renal cell carcinoma: a multicenter experience. J Clin Oncol 2005; 23: pp. 2763-2771.
3. Schachter L.R., Cookson M.S., Chang S.S., et. al.: Second prize: frequency of benign renal cortical tumors and histologic subtypes based on size in a contemporary series: what to tell our patients. J Endourol 2007; 21: pp. 819-823.
4. Cheng L., Zhang S.B., MacLennan G.T., et. al.: Molecular and cytogenetic insights into the pathogenesis, classification, differential diagnosis, and prognosis of renal epithelial neoplasms. Hum Pathol 2009; 40: pp. 10-29.
5. Suzuki K., Mizuno R., Mikami S., et. al.: Prognostic significance of high nuclear grade in patients with pathologic T1a renal cell carcinoma. Jap J Clin Oncol 2012; 42: pp. 831-835.
6. Gudbjartsson T., Hardarson S., Petursdottir V., et. al.: Histological subtyping and nuclear grading of renal cell carcinoma and their implications for survival: a retrospective nation-wide study of 629 patients. Eur Urol 2005; 48: pp. 593-600.
7. Li X.S., Yao L., Gong K., et. al.: Growth pattern of renal cell carcinoma (RCC) in patients with delayed surgical intervention. J Cancer Res Clin Oncol 2012; 138: pp. 269-274.
8. Ficarra V., Martignoni G., Maffei N., et. al.: Original and reviewed nuclear grading according to the Fuhrman system—a multivariate analysis of 388 patients with conventional renal cell carcinoma. Cancer 2005; 103: pp. 68-75.
9. Park S.H., Moon W.K., Cho N., et. al.: Diffusion-weighted MR imaging: pretreatment prediction of response to neoadjuvant chemotherapy in patients with breast cancer. Radiology 2010; 257: pp. 56-63.
10. Chen S.Y., Li X.L.: Functional magnetic resonance imaging for imaging neural activity in the human brain: the annual progress. Comput Math Methods Med 2012; 2012: pp. 613465.
11. Christen T., Lemasson B., Pannetier N., et. al.: Is T2* enough to assess oxygenation? Quantitative blood oxygen level-dependent analysis in brain tumor. Radiology 2012; 262: pp. 495-502.
12. Rakow-Penner R., Daniel B., Glover G.H.: Detecting blood oxygen level-dependent (BOLD) contrast in the breast. J Magn Reson Imaging 2010; 32: pp. 120-129.
13. Helmberger T.K., Scholz V.H., Holzknecht N.G., et. al.: First experience with BOLD MRI to assess perfusion changes in hepatic tumors as a monitor of effects in chemoembolisation. Radiology 1998; 209P: pp. 174.
14. Hsu Y.Y., Chang C.N., Jung S.M., et. al.: Blood oxygenation level-dependent MRI of cerebral gliomas during breath holding. J Magn Reson Imaging 2004; 19: pp. 160-167.
15. Principi M., Italiani M., Guiducci A., et. al.: Perfusion MRI in the evaluation of the relationship between tumour growth, necrosis and angiogenesis in glioblastomas and grade 1 meningiomas. Neuroradiology 2003; 45: pp. 205-211.
16. Jakobsen I., Kaalhus O., Lyng H., et. al.: Detection of necrosis in human tumour xenografts by proton magnetic resonance imaging. Br J Cancer 1995; 71: pp. 456-461.
17. Chavhan G.B., Babyn P.S., Thomas B., et. al.: Principles, techniques, and applications of T2*-based MR imaging and its special applications. Radiographics 2009; 29: pp. 1433-1449.
18. Fuhrman S.A., Lasky L.C., Limas C.: Prognostic significance of morphologic parameters in renal cell carcinoma. Am J Surg Pathol 1982; 6: pp. 655-663.
19. Shrout P.E., Fleiss J.L.: Intraclass correlations: uses in assessing rater reliability. Psychol Bull 1979; 86: pp. 420-428.
20. Eggener S.: TNM staging for renal cell carcinoma: time for a new method. Eur Urol 2010; 58: pp. 517-521.
21. Breen D.J., Rutherford E.E., Stedman B., et. al.: Management of renal tumors by image-guided radiofrequency ablation: experience in 105 tumors. Cardiovasc Inter Radiol 2007; 30: pp. 936-942.
22. Chen D.Y., Uzzo R.G.: Optimal management of localized renal cell carcinoma: surgery, ablation, or active surveillance. J Natl Comp Cancer Netw 2009; 7: pp. 635-643.
23. Sung H.H., Park B.K., Kim C.K., et. al.: Comparison of percutaneous radiofrequency ablation and open partial nephrectomy for the treatment of size- and location-matched renal masses. Int J Hypertherm 2012; 28: pp. 227-234.
24. Thompson R.H., Kurta J.M., Kaag M., et. al.: Tumor size is associated with malignant potential in renal cell carcinoma cases. J Urol 2009; 181: pp. 2033-2036.
25. Pahernik S., Ziegler S., Roos F., et. al.: Small renal tumors: correlation of clinical and pathological features with tumor size. J Urol 2007; 178: pp. 414-416.
26. Zhang C., Li X., Hao H., et. al.: The correlation between size of renal cell carcinoma and its histopathological characteristics: a single center study of 1867 renal cell carcinoma cases. BJU Int 2012; 30: http://dx.doi.org/10.1111/j.1464-410X.2012.11173.x
27. Turun S., Banghua L., Zheng S., et. al.: Is tumor size a reliable predictor of histopathological characteristics of renal cell carcinoma?. Urol Ann 2012; 4: pp. 24-28.
28. Hsu R.M., Chan D.Y., Siegelman S.S.: Small renal cell carcinomas: correlation of size with tumor stage, nuclear grade, and histologic subtype. AJR Am J Roentgenol 2004; 182: pp. 551-557.
29. Klatte T., Patard J.J., Goel R.H., et. al.: Prognostic impact of tumor size on pT2 renal cell carcinoma: an international multicenter experience. J Urol 2007; 178: pp. 35-40.
30. Kitagawa Y., Nakashima K., Shima T., et. al.: Clinicopathological outcomes of clinical T1a renal cell carcinoma by tumor size. Jap J Clin Oncol 2011; 41: pp. 637-641.
31. Rosenkrantz A.B., Niver B.E., Fitzgerald E.F., et. al.: Utility of the apparent diffusion coefficient for distinguishing clear cell renal cell carcinoma of low and high nuclear grade. AJR Am J Roentgenol 2010; 195: pp. W344-W351.
32. Goyal A., Sharma R., Bhalla A.S., et. al.: Diffusion-weighted MRI in renal cell carcinoma: a surrogate marker for predicting nuclear grade and histological subtype. Acta Radiol 2012; 53: pp. 349-358.
33. Sadowski E.A., Fain S.B., Alford S.K., et. al.: Assessment of acute renal transplant rejection with blood oxygen level-dependent MR imaging: initial experience. Radiology 2005; 236: pp. 911-919.
34. Prasad P., Li L.P., Halter S., et. al.: Evaluation of renal hypoxia in diabetic mice by BOLD MRI. Invest Radiol 2010; 45: pp. 819-822.
35. Edeline J., Mottier S., Vigneau C., et. al.: Description of 2 angiogenic phenotypes in clear cell renal cell carcinoma. Hum Pathol 2012; 22: http://dx.doi.org/10.1016/j.bbr.2011.03.031
36. Dorevic G., Matusan-Ilijas K., Babarovic E., et. al.: Hypoxia inducible factor-1alpha correlates with vascular endothelial growth factor A and C indicating worse prognosis in clear cell renal cell carcinoma. J Exp Clin Cancer Res 2009; 28: pp. 40.
37. Prasad S.R., Humphrey P.A., Catena J.R., et. al.: Common and uncommon histologic subtypes of renal cell carcinoma: imaging spectrum with pathologic correlation. Radiographics 2006; 26: pp. 1795-1810.
38. Tosaka M., Sato N., Hirato J., et. al.: Assessment of hemorrhage in pituitary macroadenoma by T2*-weighted gradient-echo MR imaging. AJNR Am J Neuroradiol 2007; 28: pp. 2023-2029.
39. Oliva M.R., Glickman J.N., Zou K.H., et. al.: Renal cell carcinoma: t1 and t2 signal intensity characteristics of papillary and clear cell types correlated with pathology. AJR Am J Roentgenol 2009; 192: pp. 1524-1530.
40. Bruix J., Sherman M., Llovet J.M., et. al.: Clinical management of hepatocellular carcinoma. Conclusions of the Barcelona 2000 EASL conference. European Association for the Study of the Liver. J Hepatol 2001; 35: pp. 421-430.