
Rationale and Objectives
To assess the pretest practices of US clinicians who treat patients with acute pulmonary embolism (PE).
Materials and Methods
We surveyed 855 practicing physicians selected randomly from three professional organizations. We asked participants to estimate how often and by what method they determine the likelihood of PE before they request confirmatory studies. Participants reported their awareness of four published clinical practice guidelines dealing with acute PE and selected options for further diagnostic testing after reviewing clinical data from three hypothetical patients presenting with low, intermediate, and high probability of acute PE.
Results
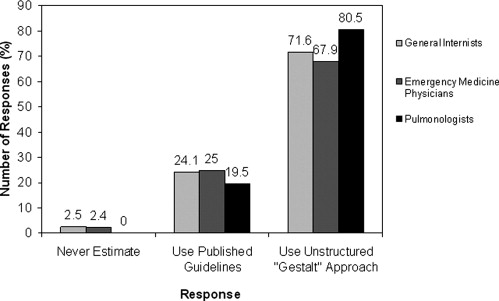
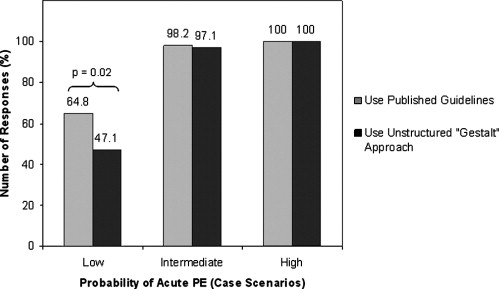
We received completed surveys from 240 physicians practicing in 44 states. Although most (98.3%) report that they assess pretest probability of PE before testing, slightly more than half do so routinely. A total of 72.5% prefer an unstructured approach to pretest assessment, whereas 22.9% use published prediction rules. Most (93.0%) are aware of at least one published guideline for assessing acute PE, but only 44.2% report using one or more in daily practice. Respondents who use published prediction rules, estimate pretest probability routinely, or use at least one practice guideline were more likely to request additional testing when reviewing a low probability clinical scenario. No differences in testing frequency or preferences were observed for intermediate or high probability clinical scenarios.
Conclusions
The majority of clinicians we surveyed use an unstructured approach when estimating the pretest probability of acute PE. With the exception of low probability scenario, clinicians agreed on testing choices in suspected acute PE, regardless of the method or frequency of pre-test assessment.
Acute pulmonary embolism (PE) is a common, potentially lethal, but treatable condition with protean clinical manifestations ( ). Accurate and timely diagnosis of PE is essential because both the over- and undertreatment of acute PE carries significant risk ( ). Because the prevalence of PE in patient populations in whom it is suspected varies widely and may be as low as 18% ( ), the appropriate selection of patients for diagnostic imaging can be challenging. The recent increased use of diagnostic imaging, particularly computed tomography (CT) pulmonary angiography in hospitalized and emergency department patients suggests that clinicians are lowering their threshold for requesting confirmatory radiologic testing in acute PE ( ). A simple and effective means of clinical risk assessment to guide subsequent, expensive diagnostic testing would be useful ( ).
Three models for clinical pretest risk assessment in acute PE have been proposed: the Canadian model of Wells and others ( ), the Geneva model ( ), and the Pisa model ( ). Each of these methods assigns patients to low-, intermediate-, or high-risk categories based on history, clinical findings, and chest radiography. After the PE risk is defined, published practice guidelines can be applied to direct subsequent confirmatory laboratory and radiological testing ( ). Although the utility of such clinical prediction rules in patients with suspected acute PE has been studied and validated ( ), it is not known whether US physicians regularly use them in practice. In the case of PE, physicians may prefer to base pretest assessment on their own unstructured judgment ( ), even though such “gestalt” impressions suffer from inadequate interobserver reliability ( ). In addition, it is not known whether clinicians are aware of and adhere to published guidelines when evaluating patients with suspected acute PE.
Get Radiology Tree app to read full this article<
Materials and methods
Study Population and Sample Size
Get Radiology Tree app to read full this article<
Get Radiology Tree app to read full this article<
Survey Instrument
Get Radiology Tree app to read full this article<
Physician and Practice Characteristics
Get Radiology Tree app to read full this article<
Method and Frequency of Estimating the Pretest Probability of PE
Get Radiology Tree app to read full this article<
Awareness of Specific Practice Guidelines
Get Radiology Tree app to read full this article<
Clinical Scenarios
Get Radiology Tree app to read full this article<
Get Radiology Tree app to read full this article<
Survey Method
Get Radiology Tree app to read full this article<
Data Analysis
Get Radiology Tree app to read full this article<
Get Radiology Tree app to read full this article<
Results
Survey Responses
Get Radiology Tree app to read full this article<
Method and Frequency of Pretest Assessment
Get Radiology Tree app to read full this article<
Table 1
Method of Estimating the Pretest Risk Assessment in Acute PE ⁎
Characteristic (Number) Standardized Prediction Rules (With 3-Group Stratification) † Unstructured “Gestalt” Approach (With 3-Group Stratification) ‡ Unstructured “Gestalt” Approach (With 2-Group Stratification) § Never ¶ Other Method Number (%) Number (%) Number (%) Number (%) Number (%) All respondents ( n = 239) 55 (22.9) 128 (53.3) 46 (19.2) 4 (1.7) 6 (2.5) Emergency medicine physicians ( n = 84) 21 (25.0) 43 (51.2) 14 (16.7) 2 (2.4) 4 (4.8) Pulmonologists ( n = 77) 15 (19.5) 48 (62.3) 14 (18.2) 0 (0) 0 (0) General internists ( n = 78) 19 (24.1) 37 (48.8) 18 (22.8) 2 (2.5) 2 (2.6) Practice: Nonacademic ( n = 204) 44 (21.5) 110 (53.7) 40 (19.5) 4 (2.0) 6 (2.9) Academic ( n = 35) 11 (31.4) 18 (51.4) 6 (17.1) 0 (0) 0 (0) Proportion of time spent in direct patient care activities ≤75% ( n = 53) 16 (29.6) 25 (46.3) 10 (18.5) 0 (0) 2 (3.8) ≥76% ( n = 178) 38 (21.4) 98 (55.1) 35 (19.7) 4 (2.3) 3 (1.7) Proportion of time devoted to caring for hospitalized inpatients: ≤50% ( n = 174) 41 (23.4) 90 (51.4) 33 (18.9) 4 (2.3) 6 (3.4) ≥51% ( n = 64) 14 (21.9) 37 (57.8) 13 (20.3) 0 (0) 0 (0) Patients with possible acute PE encountered in practice: ≤4/month ( n = 127) 28 (21.9) 66 (51.6) 25 (19.5) 3 (2.3) 5 (3.9) ≥5/month ( n = 110) 27 (24.6) 60 (54.6) 21 (19.1) 1 (0.9) 1 (0.9) Residency completed: Before 1990 ( n = 159) 33 (20.6) 87 (54.4) 31 (19.4) 4 (2.5) 4 (2.5) After 1989 ( n = 75) 20 (26.7) 38 (50.7) 15 (20.0) 0 (0) 2 (2.7)
PE: pulmonary embolism.
Get Radiology Tree app to read full this article<
Get Radiology Tree app to read full this article<
Get Radiology Tree app to read full this article<
Get Radiology Tree app to read full this article<
Get Radiology Tree app to read full this article<
Get Radiology Tree app to read full this article<
Get Radiology Tree app to read full this article<
Table 2
Frequency with which Pretest Risk Assessment is Estimated ⁎
Characteristic (Number) Very Frequent † Number (%) Frequent † Number (%) Infrequent † Number (%) All respondents ( n = 228) 125 (54.8) 63 (27.6) 40 (17.5) Emergency medicine physicians ( n = 79) 47 (59.5) 19 (24.1) 13 (16.5) Pulmonologists ( n = 75) 46 (61.3) 20 (26.7) 9 (12.0) General internists ( n = 74) 32 (43.2) 24 (32.4) 18 (24.3) Practice: Nonacademic ( n = 195) 102 (52.3) 54 (27.7) 39 (20.0) Academic ( n = 33) 23 (69.7) 9 (27.3) 1 (3.0) Proportion of time spent in direct patient care activities ≤75% ( n = 50) 32 (64.0) 14 (28.0) 4 (8.0) ≥76% ( n = 171) 91 (53.2) 46 (26.9) 34 (19.9) Proportion of time devoted to caring for hospitalized inpatients: ≤50% ( n = 164) 83 (50.6) 48 (29.3) 33 (20.1) ≥51% ( n = 63) 42 (66.7) 14 (22.2) 7 (11.1) Patients with possible acute PE encountered in practice: ≤4/month ( n = 120) 62 (51.7) 35 (29.2) 23 (19.2) ≥5/month ( n = 106) 62 (58.5) 27 (25.5) 17 (16.0) Residency completed: Before 1990 ( n = 153) 90 (58.8) 43 (28.1) 20 (13.1) After 1989 ( n = 72) 32 (44.4) 20 (27.8) 20 (27.8)
Get Radiology Tree app to read full this article<
Get Radiology Tree app to read full this article<
Get Radiology Tree app to read full this article<
Get Radiology Tree app to read full this article<
Awareness of Published Practice Guidelines
Get Radiology Tree app to read full this article<
Table 3
Awareness of Published Guidelines ⁎
Total Responses n = 240 Pulmonologists n = 77 General Internists n = 79 Emergency Medicine Physicians n = 84 Guidelines Response Option Number (%) Number (%) Number (%) Number (%) American Thoracic Society (Guidelines) † Use it in my practice 42 (17.5) 28 (36.4) 10 (12.7) 4 (4.8) Have read it 69 (28.8) 35 (45.5) 19 (24.1) 15 (17.9) Aware of it 66 (27.5) 8 (10.4) 27 (34.2) 31 (36.9) Not aware of it 63 (26.3) 6 (7.8) 23 (29.1) 34 (40.5) Fedullo and Tapson: The Evaluation of Suspected Pulmonary Embolism (review article) ‡ Use it in my practice 48 (20.0) 15 (19.5) 19 (24.1) 14 (16.7) Have read it 73 (30.4) 37 (48.1) 19 (24.1) 17 (20.2) Aware of it 59 (24.6) 18 (23.4) 20 (25.3 21 (25.0) Not aware of it 60 (25.0) 7 (9.1) 21 (26.6) 32 (31.1) The American College of Emergency Physicians (guidelines) § Use it in my practice 43 (17.9) 0 (0) 3 (3.8) 40 (47.6) Have read it 33 (13.8) 4 (5.2) 1 (1.3) 28 (33.3) Aware of it 41 (17.1) 18 (23.4) 12 (15.2) 11 (13.1) Not aware of it 122 (50.8) 54 (70.1) 63 (79.8) 5 (6.0) British Thoracic Society (guidelines) ¶ Use it in my practice 10 (4.2) 3 (3.9) 4 (5.1) 3 (3.6) Have read it 10 (4.2) 6 (7.8) 1 (1.3) 3 (3.6) Aware of it 39 (16.3) 14 (18.2) 14 (17.7) 11 (13.1) Not aware of it 180 (75.0) 53 (68.8) 60 (76.0) 67 (79.8) Any of the above Use it in my practice 106 (44.2) 35 (45.5) 27 (34.2) 44 (52.4) Have read it 87 (36.3) 36 (46.8) 25 (31.7) 26 (31.0) Aware of it 30 (12.5) 5 (6.5) 15 (19.0) 10 (11.9) Not aware of it 17 (7.1) 1 (1.3) 12 (15.2) 4 (4.8)
PE: pulmonary embolism.
Get Radiology Tree app to read full this article<
Get Radiology Tree app to read full this article<
Get Radiology Tree app to read full this article<
Get Radiology Tree app to read full this article<
Get Radiology Tree app to read full this article<
Get Radiology Tree app to read full this article<
Get Radiology Tree app to read full this article<
Get Radiology Tree app to read full this article<
Performance on Hypothetical Clinical Scenarios
Get Radiology Tree app to read full this article<
Table 4a
Scenario Performance versus Method of Pretest Assessment
Scenario Type Response Option Total Responses (Weekdays) Total Responses (Nights/Weekends) Total Responses (with additional findings) Standardized Prediction Rules (with 3 group stratification) † Unstructured “Gestalt” Method (with 3 group stratification) ‡ Unstructured “Gestalt” Method (with 2 group stratification) § Number (%) Number (%) Number (%) Number (%) Number (%) Number (%) Findings = left lower lobe infiltrate Low probability_n_ = 238n = 238n = 238n = 54n = 128n = 46 No testing 118 (49.6) 104 (43.7) 170 (71.43) 19 (35.2) 68 (53.1) 24 (52.2) D-dimer 68 (28.6) 70 (29.4) 31 (13.0) 19 (35.2) 37 (28.9) 10 (21.7) CTPA 34 (14.3) 42 (17.7) 28 (11.8) 10 (18.5) 17 (13.3) 6 (13.0) VIP 13 (5.5) 12 (5.0) 6 (2.5) 5 (9.3) 5 (3.9) 3 (6.5) Other ⁎ 5 (2.1) 10 (4.2) 3 (1.3) 1 (1.9) 1 (0.8) 3 (6.5) Findings = pleural effusions and pulmonary vascular congestion Intermediate probability_n_ = 239n = 239n = 233n = 55n = 128n = 45 No testing 8 (3.4) 10 (4.2) 37 (15.9) 1 (1.8) 2 (1.6) 3 (6.7) D-dimer 29 (12.1) 34 (14.2) 28 (12.0) 7 (12.7) 15 (11.7) 6 (13.3) CTPA 154 (64.4) 167 (69.9) 119 (51.1) 35 (63.6) 87 (68.0) 26 (57.8) VIP 27 (11.3) 19 (8.0) 10 (4.3) 7 (12.7) 14 (10.9) 6 (13.3) Other ⁎ 21 (8.8) 9 (3.8) 39 (16.7) 5 (9.1) 10 (7.8) 4 (8.9) Findings = pleural effusion High probability_n_ = 239n = 239n = 239n = 55n = 128n = 45 No testing 0 (0) 2 (0.8) 3 (1.3) 0 (0) 0 (0) 0 (0) D-dimer 13 (5.4) 18 (7.5) 9 (3.8) 3 (5.4) 7 (5.5) 2 (4.4) CTPA 176 (73.6) 187 (78.2) 201 (84.1) 40 (72.7) 96 (75.0) 33 (73.3) VIP 38 (15.9) 24 (10.0) 13 (5.4) 7 (12.7) 21 (16.4) 9 (20.0) Other ⁎ 12 (5.0) 8 (3.4) 13 (5.4) 5 (9.1) 4 (3.1) 1 (2.2)
CTPA: computed tomography pulmonary angiography; VIP: ventilation perfusion scanning.
Get Radiology Tree app to read full this article<
Get Radiology Tree app to read full this article<
Get Radiology Tree app to read full this article<
Get Radiology Tree app to read full this article<
Table 4b
Scenario Performance versus Frequency of Pretest Assessment and Awareness of Guidelines
Scenario Type Response Option Very Frequent † Frequent † Infrequent † Uses any Guideline Does not use any Guideline Number (%) Number (%) Number (%) Low probability_n_ = 124n = 63n = 39n = 106n = 133 No testing 53 (42.7) 36 (57.1) 22 (56.4) 42 (40.0) 76 (57.1) D-dimer 48 (38.7) 11 (17.5) 7 (18.0) 37 (35.2) 31 (23.3) CTPA 13 (10.5) 11 (17.5) 7 (18.0) 17 (16.2) 17 (12.8) VIP 7 (5.7) 4 (6.3) 2 (5.1) 7 (6.7) 6 (4.5) Other ⁎ 3 (2.4) 1 (1.6) 1 (2.6) 2 (1.9) 3 (2.3) Intermediate probability_n_ = 124n = 63n = 40n = 106n = 133 No testing 1 (0.8) 3 (4.8) 3 (7.5) 5 (4.7) 3 (2.3) D-dimer 14 (11.2) 5 (7.9) 10 (25.0) 11 (10.4) 18 (13.5) CTPA 87 (70.2) 40 (63.5) 19 (47.5) 76 (71.7) 78 (58.7) VIP 14 (11.3) 8 (12.7) 4 (10.0) 8 (7.6) 19 (14.3) Other ⁎ 8 (6.5) 7 (11.1) 4 (10.0) 6 (5.7) 15 (11.3) High probability_n_ = 124n = 63n = 40n = 106n = 133 No testing 0 (0) 0 (0) 0 (0) 0 (0) 0 (0) D-dimer 6 (4.8) 2 (3.2) 4 (10.0) 5 (4.7) 8 (6.0) CTPA 92 (74.2) 48 (76.2) 27 (67.5) 82 (77.4) 94 (70.7) VIP 18 (14.5) 12 (19.1) 7 (17.5) 13 (12.3) 25 (18.8) Other ⁎ 8 (6.5) 1 (1.6) 2 (5.0) 6 (5.7) 6 (4.5)
CTPA: computed tomography pulmonary angiography; VIP: ventilation perfusion scanning.
Get Radiology Tree app to read full this article<
Get Radiology Tree app to read full this article<
Get Radiology Tree app to read full this article<
Get Radiology Tree app to read full this article<
Get Radiology Tree app to read full this article<
Get Radiology Tree app to read full this article<
Discussion
Get Radiology Tree app to read full this article<
Get Radiology Tree app to read full this article<
Get Radiology Tree app to read full this article<
Get Radiology Tree app to read full this article<
Get Radiology Tree app to read full this article<
Get Radiology Tree app to read full this article<
Get Radiology Tree app to read full this article<
Get Radiology Tree app to read full this article<
Get Radiology Tree app to read full this article<
Acknowledgments
Get Radiology Tree app to read full this article<
Appendix 1
Hypothetical clinical scenarios
Get Radiology Tree app to read full this article<
Get Radiology Tree app to read full this article<
Get Radiology Tree app to read full this article<
References
1. Moser K.M.: Venous thromboembolism. Am Rev Respir Dis 1990; 141: pp. 235-249.
2. Perrier A., Bounameaux H.: Cost-effective diagnosis of deep vein thrombosis and pulmonary embolism. Thromb Haemost 2001; 86: pp. 475-487.
3. Fedullo P.F., Tapson V.F.: Clinical practice. N Engl J Med 2003; 349: pp. 1247-1256.
4. Hagen P.J., van Strijen M.J., Kieft G.J., et. al.: The application of a Dutch consensus diagnostic strategy for pulmonary embolism in clinical practice. Neth J Med 2001; 59: pp. 161-169.
5. Value of the ventilation/perfusion scan in acute pulmonary embolism. Results of the prospective investigation of pulmonary embolism diagnosis (PIOPED). The PIOPED Investigators. JAMA 1990; 263: pp. 2753-2759.
6. Miniati M., Bottai M., Monti S.: Comparison of 3 clinical models for predicting the probability of pulmonary embolism. Medicine 2005; 84: pp. 107-114. (Balt)
7. Wicki J., Perneger T.V., Junod A.F., et. al.: Assessing clinical probability of pulmonary embolism in the emergency ward: a simple score. Arch Intern Med 2001; 161: pp. 92-97.
8. Wells P.S., Anderson D.R., Rodger M., et. al.: Derivation of a simple clinical model to categorize patients probability of pulmonary embolism: increasing the models utility with the SimpliRED D-dimer. Thromb Haemost 2000; 83: pp. 416-420.
9. Prologo J.D., Gilkeson R.C., Diaz M., et. al.: CT pulmonary angiography: a comparative analysis of the utilization patterns in emergency department and hospitalized patients between 1998 and 2003. AJR Am J Roentgenol 2004; 183: pp. 1093-1096.
10. Ost D., Khanna D., Shah R., et. al.: Impact of spiral computed tomography on the diagnosis of pulmonary embolism in a community hospital setting. Respiration 2004; 71: pp. 450-457.
11. Wells P.S., Ginsberg J.S., Anderson D.R., et. al.: Use of a clinical model for safe management of patients with suspected pulmonary embolism. Ann Intern Med 1998; 129: pp. 997-1005.
12. Miniati M., Prediletto R., Formichi B., et. al.: Accuracy of clinical assessment in the diagnosis of pulmonary embolism. Am J Resp Crit Care Med 1999; 159: pp. 864-871.
13. Miniati M., Monti S., Bottai M.: A structured clinical model for predicting the probability of pulmonary embolism. Am J Med 2003; 114: pp. 173-179.
14. Wolf S.J., McCubbin T.R., Feldhaus K.M., et. al.: Prospective validation of Wells Criteria in the evaluation of patients with suspected pulmonary embolism. Ann Emerg Med 2004; 44: pp. 503-510.
15. Tamariz L.J., Eng J., Segal J.B., et. al.: Usefulness of clinical prediction rules for the diagnosis of venous thromboembolism: a systematic review. Am J Med 2004; 117: pp. 676-684.
16. Righini M., Bounameaux H.: External validation and comparison of recently described prediction rules for suspected pulmonary embolism. Curr Opin Pulm Med 2004; 10: pp. 345-349.
17. van Belle A., Buller H.R., Huisman M.V., et. al.: Effectiveness of managing suspected pulmonary embolism using an algorithm combining clinical probability, D-dimer testing, and computed tomography. JAMA 2006; 295: pp. 172-179.
18. Eisner M.D.: Before diagnostic testing for pulmonary embolism: estimating the prior probability of disease. Am J Med 2003; 114: pp. 232-234.
19. Quiroz R., Kucher N., Zou K.H., et. al.: Clinical validity of a negative computed tomography scan in patients with suspected pulmonary embolism: a systematic review. JAMA 2005; 293: pp. 2012-2017.
20. Perrier A., Roy P.M., Sanchez O., et. al.: Multidetector-row computed tomography in suspected pulmonary embolism. N Engl J Med 2005; 352: pp. 1760-1768.
21. Stein P.D., Fowler S.E., Goodman L.R., et. al.: Multidetector computed tomography for acute pulmonary embolism. N Engl J Med 2006; 354: pp. 2317-2327.
22. Runyon M.S., Webb W.B., Jones A.E., et. al.: Comparison of the unstructured clinician estimate of pretest probability for pulmonary embolism to the Canadian score and the Charlotte rule: a prospective observational study. Acad Emerg Med 2005; 12: pp. 587-593.
23. Rodger M.A., Maser E., Stiell I., et. al.: The interobserver reliability of pretest probability assessment in patients with suspected pulmonary embolism. Thromb Res 2005; 116: pp. 101-107.
24. Scatarige J.C., Diette G.B., Merriman B., et. al.: Physician satisfaction with high-resolution CT services provided by radiologists: results of a nationwide survey of pulmonary subspecialists. AJR Am J Roentgenol 2003; 180: pp. 585-589.
25. Cummings S.M., Savitz L.A., Konrad T.R.: Reported response rates to mailed physician questionnaires. Health Serv Res 2001; 35: pp. 1347-1355.
26. Asch D.A., Jedrziewski M.K., Christakis N.A.: Response rates to mail surveys published in medical journals. J Clin Epidemiol 1997; 50: pp. 1129-1136.
27. Weiss C.R., Scatarige J.C., Diette G.B., et. al.: CT Pulmonary angiography is the first-line imaging test for acute pulmonary embolism: a survey of US clinicians. Acad Radiol 2006; 13: pp. 434-446.
28. Scatarige J.C., Weiss C.R., Diette G.B., et. al.: Scanning systems and protocols used during imaging for acute pulmonary embolism how much do our clinical colleagues know?. Acad Radiol 2006; 13: pp. 678-685.
29. Tapson V.F., Carroll B.A., Davidson B.L., et. al.: The diagnostic approach to acute venous thromboembolism. Clinical practice guideline. American Thoracic Society. Am J Respir Crit Care Med 1999; 160: pp. 1043-1066.
30. Clinical policy: critical issues in the evaluation and management of adult patients presenting with suspected pulmonary embolism. Ann Emerg Med 2003; 41: pp. 257-270.
31. British Thoracic Society guidelines for the management of suspected acute pulmonary embolism. Thorax 2003; 58: pp. 470-483.
32. Hernandez D.V., Schmaling K.B.: Understanding and resolving adherence problems. Clin Rev Allergy Immunol 2004; 27: pp. 65-73.
33. Adams R.J., Fuhlbrigge A., Guilbert T., et. al.: Inadequate use of asthma medication in the United States: results of the asthma in America national population survey. J Allergy Clin Immunol 2002; 110: pp. 58-64.
34. Legorreta A.P., Christian-Herman J., O’Connor R.D., et. al.: Compliance with national asthma management guidelines and specialty care: a health maintenance organization experience. Arch Intern Med 1998; 158: pp. 457-464.
35. Vollmer W.M., O’Hollaren M., Ettinger K.M., et. al.: Specialty differences in the management of asthma. Arch Intern Med 1997; 157: pp. 1201-1208.
36. O’Dowd L.C., Fife D., Tenhave T., et. al.: Attitudes of physicians toward objective measures of airway function in asthma. Am J Med 2003; 114: pp. 391-396.
37. Karras D.J., Kruus L.K., Cienki J.J., et. al.: Evaluation and treatment of patients with severely elevated blood pressure in academic emergency departments: a multicenter study. Ann Emerg Med 2006; 47: pp. 230-236.
38. Milchak J.L., Carter B.L., James P.A., et. al.: Measuring adherence to practice guidelines for the management of hypertension: an evaluation of the literature. Hypertension 2004; 4 4: pp. 602-608.
39. Worrall G., Chaulk P., Freake D.: The effects of clinical practice guidelines on patient outcomes in primary care: a systematic review. CMAJ 1997; 156: pp. 1705-1712.
40. Cabana M.D., Rand C.S., Powe N.R., et. al.: Why don’t physicians follow clinical practice guidelines?. JAMA 1999; 282: pp. 1458-1465.
41. Gupta L., Ward J.E., Hayward R.S.: Clinical practice guidelines in general practice: a national survey of recall, attitudes and impact. Med J Aust 1997; 166: pp. 69-72.
42. Lomas J., Anderson G.M., Domnick-Pierre K., et. al.: Do practice guidelines guide practice?. N Engl J Med 1989; 321: pp. 1306-1311.
43. Mottur-Pilson C., Snow V., Bartlett K.: Physician explanations for failing to comply with “best practices.”. Eff Clin Pract 2001; 4: pp. 207-213.
44. Larkin M.: Noncompliance with “best practices” may be justifiable. Lancet 2001; 358: pp. 1433.
45. Kabrhel C., McAfee A.T., Goldhaber S.Z.: The contribution of the subjective component of the Canadian Pulmonary Embolism Score to the overall score in emergency department patients. Acad Emerg Med 2005; 12: pp. 915-920.
46. Peabody J.W., Luck J., Glassman P., et. al.: Measuring the quality of physician practice by using clinical vignettes: a prospective validation study. Ann Intern Med 2004; 141: pp. 771-780.
47. Peabody J.W., Luck J., Glassman P., et. al.: Comparison of vignettes, standardized patients, and chart abstraction: a prospective validation study of 3 methods for measuring quality. JAMA 2000; 283: pp. 1715-1722.
48. Dresselhaus T.R., Peabody J.W., Luck J., et. al.: An evaluation of vignettes for predicting variation in the quality of preventive care. J Gen Intern Med 2004; 19: pp. 1013-1018.
49. Riddle D.L., Hillner B.E., Wells P.S., et. al.: Improving the diagnostic process for deep vein thrombosis in orthopaedic outpatients. Clin Orthop Relat Res 2005; pp. 258-266.
50. Iles S., Hodges A.M., Darley J.R., et. al.: Clinical experience and pre-test probability scores in the diagnosis of pulmonary embolism. QJM 2003; 96: pp. 211-215.
51. Wigton R.S., Hoellerich V.L., Patil K.D.: How physicians use clinical information in diagnosing pulmonary embolism: an application of conjoint analysis. Med Decis Making 1986; 6: pp. 2-11.
52. Aberegg S.K., Haponik E.F., Terry P.B.: Omission bias and decision making in pulmonary and critical care medicine. Chest 2005; 128: pp. 1497-1505.