
Rationale and Objectives
Despite recent advances in the treatment of high-grade gliomas, overall survival (OS) remains poor, which underlines the importance of searching for and determining prognostic imaging biomarkers. The purpose of our retrospective study was to correlate patient survival with relative cerebral blood volume (rCBV) and permeability surface area-product (PS) measured using perfusion computed tomography (PCT) in patients with high-grade gliomas.
Methods
This study was composed of 54 patients with high-grade gliomas (World Health Organization [WHO] grade III, n = 14; WHO grade IV, n = 40) who underwent pretreatment PCT. Kaplan-Meier survival estimates were computed to describe OS for patients with high-versus-low PCT parameters, as well as grade III and IV gliomas.
Results
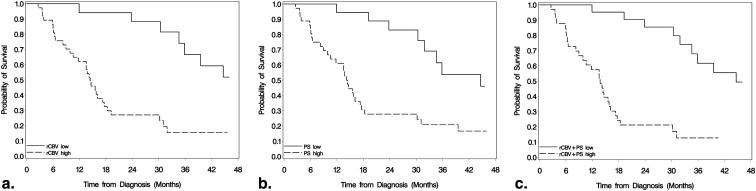
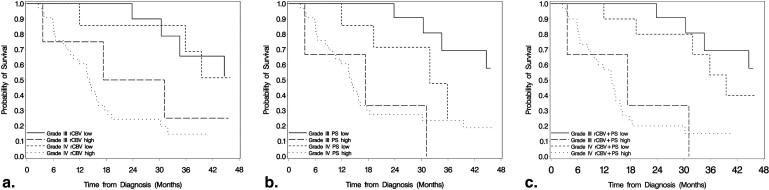
Differences in OS between high and low rCBV, PS, and rCBV + PS were significant ( P < .001) for all high-grade gliomas. After adjustment for WHO grade, rCBV ( P = .041) and rCBV + PS ( P = .013) estimates remained significant, whereas PS estimates were not ( P = .214). PS estimates showed a statistically significant difference for OS in the grade III glioma group ( P = .011), whereas for grade IV gliomas, rCBV estimates were statistically significant ( P = .019). rCBV + PS was statistically significant for OS in both grade III ( P = .001) and grade IV ( P = .004) glioma groups.
Conclusions
Blood volume and permeability estimates measured using PCT can help predict survival in patients with high-grade gliomas. Patients with high PCT parameters showed worse OS compared to the patients with low PCT. Both rCBV and rCBV + PS remained statistically significant even after adjustment for WHO grade, suggesting these may be better predictors of OS than histological grade.
High-grade gliomas are often heterogeneous tumors, which infiltrate the brain parenchyma. As a result, complete cure is nearly impossible and, despite aggressive multimodality treatment approaches, the survival rate for high-grade gliomas remains dismal. Currently, prognostic factors for patients with high-grade gliomas are clinically based, the most important of which include patient age, Karnofsky Performance Status (KPS) score, extent of initial surgical resection, and molecular profile . The search for prognostic biomarkers, especially in vivo imaging biomarkers, continues with significant improvements in the resolution of clinically available imaging tools. Functional imaging modalities/techniques can provide information about the metabolic (magnetic resonance spectroscopic imaging, positron emission tomography) and physiological (diffusion-weighted imaging, perfusion imaging) aspects of tumor biology, which could not only provide important prognostic information about tumor behavior and aggressiveness but also offer a means of assessing early response to specific treatment regimens by measuring quantifiable parameters. One particular group of parameters being explored is related to tumor perfusion. Although most perfusion imaging studies have focused on blood volume estimates and correlation with survival prediction in mixed populations of gliomas, tumor vascular permeability estimates have not been evaluated in much detail, particularly in relation to survival prediction . However, tumor blood volume and permeability appear to represent two different aspects of tumor vasculature and angiogenesis . Thus, each parameter may provide unique information about the tumor microenvironment. In addition, leaky tumor vasculature is known to be associated with higher tumor grade and increased malignant potential . Thus, estimating tumor leakiness, in particular, could provide help in quantifying angiogenesis in high-grade gliomas, perhaps serving as an important prognostic biomarker.
The purpose of this study was to retrospectively assess the prognostic value of both tumor blood volume (relative cerebral blood volume) and permeability surface area-product (PS) estimates obtained using perfusion computed tomography (PCT) in patients with high-grade gliomas.
Materials and methods
Study Population
Get Radiology Tree app to read full this article<
Get Radiology Tree app to read full this article<
PCT Studies
Get Radiology Tree app to read full this article<
Statistical Analysis
Get Radiology Tree app to read full this article<
Get Radiology Tree app to read full this article<
Get Radiology Tree app to read full this article<
Results
Choosing Cut Points for rCBV and PS
Get Radiology Tree app to read full this article<
Survival Analysis for All High-Grade Gliomas
Get Radiology Tree app to read full this article<
Table 1
Patient Data and Prognostic Factors Affecting OS
Prognostic Factor_n_ 12-mo OS 24-mo OS Median Survival (mo)P Value ∗ Age <50 y 19 84.2% 63.2% 35.9 .056 ≥50 y 35 65.8% 37.19% 15.8 Sex Male 33 78.8% 42.0% 17.3 .812 Female 21 61.9% 52.4% 30.2 WHO grade III 14 92.9% 78.6% 44.7 .017 IV 40 65.0% 35.0% 15.1 Extent of surgery Gross-total resection 11 81.8% 53.0% 39.5 .653 Subtotal resection 31 67.7% 41.9% 15.8 Biopsy 12 75.0% 50.0% 23.9 Karnofsky Performance Status score † ≤80 13 61.5% 30.8% 14.4 .009 >80 37 78.4% 53.8% 34.6
OS, overall survival; WHO, World Health Organization.
Get Radiology Tree app to read full this article<
Get Radiology Tree app to read full this article<
Get Radiology Tree app to read full this article<
Get Radiology Tree app to read full this article<
Get Radiology Tree app to read full this article<
Get Radiology Tree app to read full this article<
Table 2
Multivariate Results: Hazard Ratios, Confidence Intervals, and P Values from Cox Regression Models
rCBV Model I (CPE = 0.661) Model II (CPE = 0.681) Variable HR (95% CI)P Value HR (95% CI)P V alue Age (increase of 10 y) 1.02 (0.68–1.51) .939 0.90 (0.59–1.37) .625 KPS (increase of 10) 0.87 (0.65–1.17) .347 0.78 (0.55–1.10) .159 Surgery GTR vs BX 1.17 (0.37–3.67) .792 0.85 (0.25–2.83) .784 STR vs BX 1.22 (0.47–3.11) .685 0.95 (0.36–2.53) .915 High rCBV 3.76 (1.30–10.94) .014 3.06 (1.05–8.92) .041 WHO grade IV 2.15 (0.72–6.44) .172
PS Model III (CPE = 0.666) Model IV (CPE = 0.672) Variable HR (95% CI)P Value HR (95% CI)P Value Age (increase of 10 y) 1.13 (0.77–1.65) .548 1.02 (0.68–1.55) .918 KPS (increase of 10) 0.89 (0.66–1.20) .428 0.79 (0.55–1.15) .220 Surgery GTR vs BX 0.90 (0.29–2.81) .856 0.79 (0.25–2.53) .690 STR vs BX 1.39 (0.55–3.51) .487 1.24 (0.48–3.20) .664 High PS 2.67 (1.03–6.89) .042 1.95 (0.56–6.78) .214 WHO grade IV 1.95 (0.68–5.58) .291
rCBV + PS Model V (CPE = 0.677) Model VI (CPE = 0.689) Variable HR (95% CI)P Value HR (95% CI)P Value Age (increase of 10 y) 1.06 (0.74–1.51) .771 0.97 (0.65–1.44) .868 KPS (increase of 10) 0.91 (0.68–1.23) .554 0.83 (0.58–1.20) .326 Surgery GTR vs BX 1.05 (0.34–3.27) .931 0.90 (0.28–2.91) .856 STR vs BX 1.05 (0.41–2.69) .925 0.95 (0.36–2.48) .915 High rCBV + PS 4.32 (1.68–11.1) .002 3.53 (1.30–9.58) .013 WHO grade IV 1.75 (0.54–5.67) .350
BX, biopsy; CI, confidence interval; CPE, concordance probability estimate; GTR, gross total resection; HR, hazard ratio; KPS, Karnofsky Performance Status; PS, permeability surface area-product; rCBV, relative cerebral blood volume; STR, subtotal resection; WHO, World Health Organization.
Get Radiology Tree app to read full this article<
Survival Analysis for WHO Grade III and Grade IV Glioma Groups Separately
Get Radiology Tree app to read full this article<
Get Radiology Tree app to read full this article<
Get Radiology Tree app to read full this article<
Get Radiology Tree app to read full this article<
Additional Survival Analysis to Account for Differences in Treatment
Get Radiology Tree app to read full this article<
Discussion
Get Radiology Tree app to read full this article<
Get Radiology Tree app to read full this article<
Get Radiology Tree app to read full this article<
Get Radiology Tree app to read full this article<
Limitations of the Study
Get Radiology Tree app to read full this article<
Conclusions
Get Radiology Tree app to read full this article<
Acknowledgments
Get Radiology Tree app to read full this article<
Get Radiology Tree app to read full this article<
References
1. Stupp R., Mason W.P., van den Bent M.J., et. al.: Radiotherapy plus concomitant and adjuvant temozolomide for glioblastoma. N Engl J Med 2005; 352: pp. 987-996.
2. Grossman S.A., Ye X., Piantadosi S., et. al.: Survival of patients with newly diagnosed glioblastoma treated with radiation and temozolomide in research studies in the United States. Clin Cancer Res 2010; 16: pp. 2443-2449.
3. Mills S.J., Patankar T.A., Haroon H.A., et. al.: Do cerebral blood volume and contrast transfer coefficient predict prognosis in human glioma?. AJNR Am J Neuroradiol 2006; 27: pp. 853-858.
4. Cao Y., Nagesh V., Hamstra D., et. al.: The extent and severity of vascular leakage as evidence of tumor aggressiveness in high-grade gliomas. Cancer Res 2006; 66: pp. 8912-8917.
5. Dhermain F., Saliou G., Parker F., et. al.: Microvascular leakage and contrast enhancement as prognostic factors for recurrence in unfavorable low-grade gliomas. J Neurooncol 2010; 97: pp. 81-88.
6. Jain R., Gutierrez J., Narang J., et. al.: In vivo correlation of tumor blood volume and permeability with histologic and molecular angiogenic markers in gliomas. AJNR Am J Neuroradiol 2011; 32: pp. 388-394.
7. Jain R., Ellika S., Scarpace L., et. al.: Quantitative estimation of permeability surface-area product in astroglial brain tumors using perfusion CT and correlation with histopathological grade. AJNR Am J Neuroradiol 2008; 29: pp. 694-700.
8. Jain R., Narang J., Gutierrez J., et. al.: Correlation of immunohistologic and perfusion vascular parameters with MR contrast enhancement using image-guided biopsy specimens in gliomas. Acad Radiol 2011; 18: pp. 955-962.
9. Xyda A., Haberland U., Klotz E., et. al.: Brain volume perfusion CT performed with 128-detector row CT system in patients with cerebral gliomas: a feasibility study. Eur Radiol 2011; 21: pp. 1811-1819.
10. Jain R.: Perfusion CT imaging of brain tumors: an overview. AJNR Am J Neuroradiol 2011; 32: pp. 1570-1577.
11. Gonen M., Heller G.: Concordance probability and discriminating power of proportional hazards regression. Biometrika 2005; 92: pp. 965-970.
12. DeAngelis L.M.: Brain tumors. N Engl J Med 2001; 344: pp. 114-123.
13. Ohgaki H., Kleihues P.: Population-based studies on incidence, survival rates, and genetic alterations in astrocytic and oligodendroglial gliomas. J Neuropathol Exp Neurol 2005; 64: pp. 479-489.
14. Curran W.J., Scott C.B., Horton J., et. al.: Recursive partitioning analysis of prognostic factors in three Radiation Therapy Oncology Group malignant glioma trials. J Natl Cancer Inst 1993; 85: pp. 704-710.
15. Krex D., Klink B., Hartmann C., et. al.: Long-term survival with glioblastoma multiforme. Brain 2007; 130: pp. 2596-2606.
16. Weller M., Felsberg J., Hartmann C., et. al.: Molecular predictors of progression-free and overall survival in patients with newly diagnosed glioblastoma: a prospective translational study of the German Glioma Network. J Clin Oncol 2009; 27: pp. 5743-5750.
17. Liu Y., Shete S., Etzel C.J., et. al.: Polymorphisms of LIG4, BTBD2, HMGA2, and RTEL1 genes involved in the double-strand break repair pathway predict glioblastoma survival. J Clin Oncol 2010; 28: pp. 2467-2474.
18. Felsberg J., Rapp M., Loeser S., et. al.: Prognostic significance of molecular markers and extent of resection in primary glioblastoma patients. Clin Cancer Res 2009; 15: pp. 6683-6693.
19. Weidner N., Semple J.P., Welch W.R., et. al.: Tumor angiogenesis and metastasis—correlation in invasive breast carcinoma. N Engl J Med 1991; 324: pp. 1-8.
20. Weidner N.: Tumoural vascularity as a prognostic factor in cancer patients: the evidence continues to grow. J Pathol 1998; 184: pp. 119-122.
21. Fox S.B.: Tumour angiogenesis and prognosis. Histopathology 1997; 30: pp. 294-301.
22. Aronen H.J., Gazit I.E., Louis D.N., et. al.: Cerebral blood volume maps of gliomas: comparison with tumor grade and histologic findings. Radiology 1994; 191: pp. 41-51.
23. Law M., Oh S., Babb J.S., et. al.: Low-grade gliomas: dynamic susceptibility-weighted contrast-enhanced perfusion MR imaging—prediction of patient clinical response. Radiology 2006; 238: pp. 658-667.
24. Law M., Young R.J., Babb J.S., et. al.: Gliomas: predicting time to progression or survival with cerebral blood volume measurements at dynamic susceptibility-weighted contrast-enhanced perfusion MR imaging. Radiology 2008; 247: pp. 490-498.
25. Bisdas S., Kirkpatrick M., Giglio P., et. al.: Cerebral blood volume measurements by perfusion-weighted MR imaging in gliomas: ready for prime time in predicting short-term outcome and recurrent disease?. AJNR Am J Neuroradiol 2009; 30: pp. 681-688.
26. Lev M.H., Ozsunar Y., Henson J.W., et. al.: Glial tumor grading and outcome prediction using dynamic spin-echo MR susceptibility mapping compared with conventional contrast-enhanced MR: confounding effect of elevated rCBV of oligodendrogliomas [corrected]. AJNR Am J Neuroradiol 2004; 25: pp. 214-221.
27. Hirai T., Murakami R., Nakamura H., et. al.: Prognostic value of perfusion MR imaging of high-grade astrocytomas: long-term follow-up study. AJNR Am J Neuroradiol 2008; 29: pp. 1505-1510.
28. Narang J., Jain R., Scarpace L., et. al.: Tumor vascular leakiness and blood volume estimates in oligodendrogliomas using perfusion CT: an analysis of perfusion parameters helping further characterize genetic subtypes as well as differentiate from astroglial tumors. J Neurooncol 2011; 102: pp. 287-293.