
Rationale and Objectives
Inhaled hyperpolarized 3 He magnetic resonance (MR) imaging has been used to measure alveolar size in patients with emphysema. The aim of this study was to test the hypothesis that 3 He MR images could be used to develop a biomarker of emphysema progression.
Materials and Methods
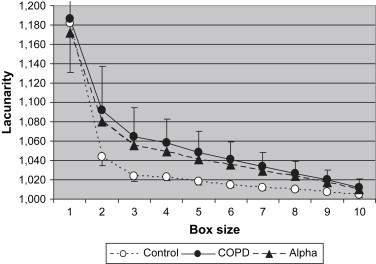
Twelve healthy controls and 18 patients with emphysema (eight current smokers, 10 ex-smokers) were imaged at baseline and 6 and 12 months. An additional nine subjects with α-1 antitrypsin deficiency (four with emphysema, six without symptoms) were also imaged at baseline and at 6 months. Each subject was imaged at two lung volumes: functional residual capacity (FRC) and FRC plus 15% of total lung capacity. Means and standard deviations of apparent diffusion coefficients (ADCs) were calculated from coronal images of the entire lung and correlated with pulmonary function test results. The lacunarity hypothesis was tested and calculated from the data using a range of 2 × 2 × 2 to 6 × 6 × 6 voxels, and the average was calculated.
Results
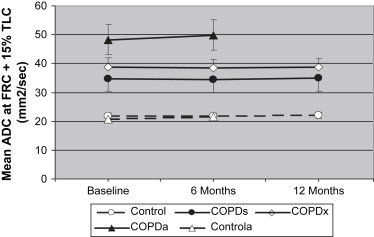
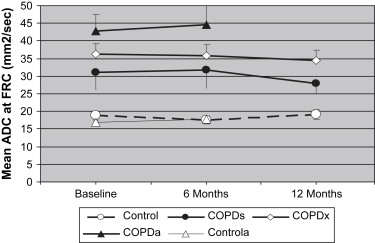
There was no change in the mean ADC at either lung volume in any subject over the 6- or 12-month period. FRC and residual volume increased over the 12 months, suggesting air trapping. The lacunarity of images collected at FRC increased at 6 and 12 months in smokers only ( P = .063 and P = .023, respectively).
Conclusions
The mean ADC calculated from MR images of the lungs with helium was not sufficiently sensitive to detect changes over a 12-month period. However, lacunarity captured more of the spatial information in the images and detected emphysema progress in the smokers.
Chronic obstructive lung disease (COPD) is a combination of airway inflammation (bronchitis) and lung tissue destruction (emphysema) . COPD is detected primarily by a fall in forced expiratory volume in 1 second (FEV 1 ) relative to forced vital capacity, and this measure, along with symptoms, is the basis for the Global Initiative for Chronic Obstructive Lung Disease classification of the severity of COPD . FEV 1 is a low-cost and effective method for assessing airway obstruction, but it does not discriminate bronchitis from emphysema, and it is relatively insensitive to the progression of the disease over 6 to 12 months . A noninvasive measure of lung tissue structure is needed to detect and quantify emphysema in patients with COPD. The method also needs to be sufficiently sensitive to measure the progression of the disease so that the effects of therapies on disease progression can be determined in cost-effective studies. Computed tomographic (CT) imaging provides a measure of lung structure, but it involves ionizing radiation. Mishima et al and Uppaluri et al applied more sophisticated analytic techniques to CT data to improve the sensitivity and specificity of CT imaging for detecting emphysema, but to our knowledge, none of these techniques have been used to demonstrate an ability of CT imaging to detect the progression of emphysema in individual patients with COPD within a 12-month period.
Magnetic resonance (MR) imaging of the lungs after inhaling a gas mixture of nitrogen and hyperpolarized 3 He (HeliSpin; GE Healthcare, Little Chalfont, UK) provides a measure of the apparent diffusion coefficient (ADC) of the helium within the airways . The mean value of the ADC measured in each of the approximately 10 to 20,000 voxels of a lung image provides a measure of airspace dimensions that has been shown to correlate with histologic measures and lung structure as assessed on CT imaging . Fain et al also demonstrated a natural increase in mean ADC with age. The use of hyperpolarized 3 He for MR lung airspace imaging is attractive because it does not require ionizing radiation, and it has been shown to be effective in detecting emphysema in humans . However, it is not known whether MR imaging of the lungs with HeliSpin is sufficiently sensitive to detect the changes in lung structure that occur within 6 to 12 months because of emphysema progression in patients with COPD.
Get Radiology Tree app to read full this article<
Get Radiology Tree app to read full this article<
Materials and methods
Get Radiology Tree app to read full this article<
Subjects
Get Radiology Tree app to read full this article<
Get Radiology Tree app to read full this article<
Get Radiology Tree app to read full this article<
Get Radiology Tree app to read full this article<
Post Hoc Lacunarity Analysis
Get Radiology Tree app to read full this article<
Get Radiology Tree app to read full this article<
Get Radiology Tree app to read full this article<
Statistical Analysis
Get Radiology Tree app to read full this article<
Results
Get Radiology Tree app to read full this article<
Table 1
Demographics and Smoking History
Group_n_ Age (y) Women Body Mass Index (kg/m 2 ) Pack-Years Control 12 52 ± 13 42% 24.6 ± 4.7 0.2 ± 0.5 COPD s 8 54 ± 7 88% 22.3 ± 3.4 39 ± 19 COPD x 10 62 ± 8 50% 22.7 ± 4.0 35 ± 12 COPD a 4 58 ± 5 50% 25.1 ± 6.2 14 ± 8 Control a 5 39 ± 12 80% 27.6 ± 2.9 4 ± 9
Control a , controls with α-1 antitrypsin deficiency; COPD, chronic obstructive pulmonary disease; COPD a , patients with COPD and α-1 antitrypsin deficiency; COPD s , smokers with COPD; COPD x , ex-smokers with COPD.
Data are expressed as mean ± standard deviation.
Table 2
Lung Function and Lung Volume
FEV 1 (% Predicted) DLCO (% Predicted) FRC (% Predicted) RV (% Predicted) Group Baseline 6 Months 12 Months Baseline 6 Months 12 Months Baseline 6 Months 12 Months Baseline 6 Months 12 Months Control 104 ± 13 103 ± 15 102 ± 16 95 ± 10 95 ± 9 93 ± 8 108 ± 21 113 ± 23 112 ± 18 110 ± 21 118 ± 14 116 ± 17 COPD s 56 ± 11 55 ± 11 50 ± 17 57 ± 16 58 ± 17 56 ± 16 133 ± 32 148 ± 33 153 ± 39 173 ± 44 195 ± 45 204 ± 59 COPD x 47 ± 10 46 ± 10 46 ± 10 54 ± 16 56 ± 17 54 ± 16 129 ± 26 126 ± 22 127 ± 29 157 ± 57 153 ± 58 157 ± 61 COPD a 52 ± 7 51 ± 8 49 ± 14 51 ± 11 142 ± 45 141 ± 41 175 ± 70 173 ± 69 Control a 84 ± 8 81 ± 11 75 ± 9 76 ± 9 91 ± 24 99 ± 26 94 ± 13 98 ± 15
Control a , controls with α-1 antitrypsin deficiency; COPD, chronic obstructive pulmonary disease; COPD a , patients with COPD and α-1 antitrypsin deficiency; COPD s , smokers with COPD; COPD x , ex-smokers with COPD; DLCO, diffusing capacity of carbon monoxide; FEV 1 , forced expiratory volume in 1 second; FRC, functional residual capacity; RV, residual volume.
Data are expressed as mean ± standard deviation.
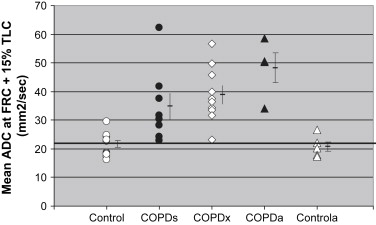
Table 3
Mean ADC and Emphysema Index
ADC (cm 2 /s) FRC Plus 15% TLC FRC EI Group Baseline 6 Months 12 Months Baseline 6 Months 12 Months 6 Months Control 0.217 ± 0.040 0.217 ± 0.037 0.220 ± 0.038 0.188 ± 0.038 0.176 ± 0.037 0.191 ± 0.045 † COPD s 0.348 ± 0.127 0.344 ± 0.131 0.350 ± 0.134 0.312 ± 0.140 0.318 ± 0.150 0.279 ± 0.083 0.165 ± 0.125 COPD x 0.389 ± 0.097 0.384 ± 0.094 0.386 ± 0.100 0.363 ± 0.094 0.359 ± 0.095 0.346 ± 0.086 0.106 ± 0.092 COPD a 0.483 ± 0.103 0.499 ± 0.106 ∗ 0.428 ± 0.094 0.446 ± 0.108 ∗ 0.182 ± 0.139 Control a 0.208 ± 0.038 0.216 ± 0.046 ∗ 0.169 ± 0.031 0.178 ± 0.040 ∗ 0.004 ± 0.006
ADC, apparent diffusion coefficient; Control a , controls with α-1 antitrypsin deficiency; COPD, chronic obstructive pulmonary disease; COPD a , patients with COPD and α-1 antitrypsin deficiency; COPD s , smokers with COPD; COPD x , ex-smokers with COPD; EI, emphysema index; FRC, functional residual capacity; TLC, total lung capacity.
Data are expressed as mean ± standard deviation.
Get Radiology Tree app to read full this article<
Get Radiology Tree app to read full this article<
Get Radiology Tree app to read full this article<
Identifying Emphysema
Get Radiology Tree app to read full this article<
Get Radiology Tree app to read full this article<
Detecting Progression
Get Radiology Tree app to read full this article<
Get Radiology Tree app to read full this article<
Get Radiology Tree app to read full this article<
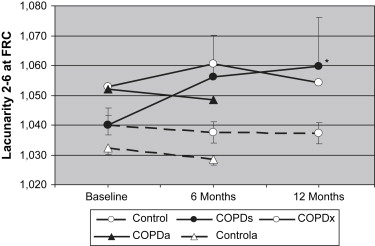
Table 4
Lacunarity
FRC Plus 15% TLC FRC Group Baseline 6 Months 12 Months Baseline 6 Months 12 Months Control 1.027 ± 0.007 1.024 ± 0.004 1.027 ± 0.007 1.040 ± 0.011 1.038 ± 0.012 1.037 ± 0.012 COPD s 1.059 ± 0.053 1.062 ± 0.50 1.057 ± 0.040 1.040 ± 0.017 1.056 ∗ ± 0.040 1.060 † ± 0.046 COPD x 1.056 ± 0.032 1.056 ± 0.030 1.055 ± 0.029 1.053 ± 0.023 1.061 ± 0.032 1.054 ± 0.028 COPD a 1.076 ± 0.058 1.083 ± 0.075 1.103 ± 0.120 1.095 ± 0.093 Control a 1.022 ± 0.001 1.021 ± 0.001 1.032 ± 0.005 1.028 ± 0.004
Control a , controls with α-1 antitrypsin deficiency; COPD, chronic obstructive pulmonary disease; COPD a , patients with COPD and α-1 antitrypsin deficiency; COPD s , smokers with COPD; COPD x , ex-smokers with COPD; FRC, functional residual capacity; TLC, total lung capacity.
Data are expressed as mean ± standard deviation.
Get Radiology Tree app to read full this article<
Get Radiology Tree app to read full this article<
Get Radiology Tree app to read full this article<
Discussion
Get Radiology Tree app to read full this article<
Identifying Emphysema
Get Radiology Tree app to read full this article<
Detecting Progression
Get Radiology Tree app to read full this article<
Get Radiology Tree app to read full this article<
Get Radiology Tree app to read full this article<
Get Radiology Tree app to read full this article<
Get Radiology Tree app to read full this article<
Get Radiology Tree app to read full this article<
Get Radiology Tree app to read full this article<
Get Radiology Tree app to read full this article<
Get Radiology Tree app to read full this article<
Get Radiology Tree app to read full this article<
Get Radiology Tree app to read full this article<
Get Radiology Tree app to read full this article<
References
1. Hnizdo E., Glindmeyer H.W., Petsonk E.L., Enright P., Buist A.S.: Case definitions for chronic obstructive pulmonary disease. COPD 2006; 3: pp. 95-100.
2. Pauwels R.A., Buist A.S., Ma P., Jenkins C.R., Hurd S.S.: Global strategy for the diagnosis, management, and prevention of chronic obstructive pulmonary disease: National Heart, Lung, and Blood Institute and World Health Organization Global Initiative for Chronic Obstructive Lung Disease (GOLD): executive summary. Respir Care 2001; 46: pp. 798-825.
3. Wise R.A.: The value of forced expiratory volume in 1 second decline in the assessment of chronic obstructive pulmonary disease progression. Am J Med 2006; 119: pp. 4-11.
4. Mishima M., Hirai T., Itoh H., et. al.: Complexity of terminal airspace geometry assessed by lung computed tomography in normal subjects and patients with chronic obstructive pulmonary disease. Proc Natl Acad Sci U S A 1999; 96: pp. 8829-8834.
5. Uppaluri R., Mitsa T., Sonka M., Hoffman E.A., McLennan G.: Quantification of pulmonary emphysema from lung computed tomography images. Am J Respir Crit Care Med 1997; 156: pp. 248-254.
6. Chen X.J., Moller H.E., Chawla M.S., et. al.: Spatially resolved measurements of hyperpolarized gas properties in the lung in vivo. Part I: diffusion coefficient. Magn Reson Med 1999; 42: pp. 721-728.
7. Chen X.J., Moller H.E., Chawla M.S., et. al.: Spatially resolved measurements of hyperpolarized gas properties in the lung in vivo. Part II: T ∗ (2). Magn Reson Med 1999; 42: pp. 729-737.
8. van Beek E.J., Wild J.M., Kauczor H.U., Schreiber W., Mugler J.P., de Lange E.E.: Functional MRI of the lung using hyperpolarized 3-helium gas. J Magn Reson Imaging 2004; 20: pp. 540-554.
9. Woods J.C., Choong C.K., Yablonskiy D.A., et. al.: Hyperpolarized 3he diffusion MRI and histology in pulmonary emphysema. Magn Reson Med 2006; 56: pp. 1293-1300.
10. Fain S.B., Panth S.R., Evans M.D., et. al.: Early emphysematous changes in asymptomatic smokers: detection with 3He MR imaging. Radiology 2006; 239: pp. 875-883.
11. Fain S.B., Altes T.A., Panth S.R., et. al.: Detection of age-dependent changes in healthy adult lungs with diffusion-weighted 3He MRI. Acad Radiol 2005; 12: pp. 1385-1393.
12. Salerno M., de Lange E.E., Altes T.A., Truwit J.D., Brookeman J.R., Mugler J.P.: Emphysema: hyperpolarized helium 3 diffusion MR imaging of the lungs compared with spirometric indexes—initial experience. Radiology 2002; 222: pp. 252-260.
13. Cotes J.E., Chinn D.J., Quanjer P.H., Roca J., Yernault J.C.: Standardization of the measurement of transfer factor (diffusing capacity). Report Working Party Standardization of Lung Function Tests, European Community for Steel and Coal. Official statement of the European Respiratory Society. Eur Respir J Suppl 1993; 16: pp. 41-52.
14. Quanjer P.H., Tammeling G.J., Cotes J.E., Pedersen O.F., Peslin R., Yernault J.C.: Lung volumes and forced ventilatory flows. Report Working Party Standardization of Lung Function Tests, European Community for Steel and Coal. Official statement of the European Respiratory Society. Eur Respir J Suppl 1993; 16: pp. 5-40.
15. Happer W.M.E., Schaefer S., Schreiber D., Wijngaarden W., Zeng X.: Polarization of the nuclear spins of noble-gas atoms by spin-exchange with optically pumped alkali-metal atoms. Phys Rev A 1984; 29: pp. 3092-3110.
16. Edelstein W.A., Bottomley P.A., Pfeifer L.M.: A signal-to-noise calibration procedure for NMR imaging systems. Med Phys 1984; 11: pp. 180-185.
17. Henkelman R.M.: Measurement of signal intensities in the presence of noise in MR images. Med Phys 1985; 12: pp. 232-233.
18. Dougherty G., Henebry G.M.: Fractal signature and lacunarity in the measurement of the texture of trabecular bone in clinical ct images. Med Eng Phys 2001; 23: pp. 369-380.
19. Plotnick R.E., Gardner R.H., Hargrove W.W., Prestegaard K., Perlmutter M.: Lacunarity analysis: a general technique for the analysis of spatial patterns. Phys Rev E Stat Phys Plasmas Fluids Relat Interdiscip Topics 1996; 53: pp. 5461-5468.
20. Diaz S., Casselbrant I., Piitulainen E., et. al.: Hyperpolarized (3)He apparent diffusion coefficient MRI of the lung: reproducibility and volume dependency in healthy volunteers and patients with emphysema. J Magn Reson Imaging 2008; 27: pp. 763-770.
21. Suki B., Lutchen K.R., Ingenito E.P.: On the progressive nature of emphysema: Roles of proteases, inflammation, and mechanical forces. Am J Respir Crit Care Med 2003; 168: pp. 516-521.
22. Dirksen A., Dijkman J.H., Madsen F., et. al.: A randomized clinical trial of alpha-1-antitrypsin augmentation therapy. Am J Respir Crit Care Med 1999; 160: pp. 1468-1472.
23. Tanoli T., Woods J.C., Conradi M.S., et. al.: In vivo lung morphometry with hyperpolarized 3 He diffusion MRI in canines with induced emphysema: disease progression and comparison with computed tomography. J Appl Physiol 2007; 102: pp. 477-484.
24. Mata J.F., Altes T.A., Cai J., et. al.: Evaluation of emphysema severity and progression in a rabbit model: comparison of hyperpolarized 3He and 129Xe diffusion MRI with lung morphometry. J Appl Physiol 2007; 102: pp. 1273-1280.