
Rationale and Objectives
Challenges remain in the imaging of the lungs of free-breathing mice. Although computed tomographic (CT) imaging is near optimal from a contrast perspective, the rapid respiration rate, limited temporal resolution, and inflexible x-ray pulse control of most micro-CT scanners limit their utility in pulmonary imaging. Carbon nanotubes (CNTs) have permitted the development of field emission cathodes, with rapid switching and precise pulse control. The goal of this study was to explore the utility of a CNT-based micro-CT system for application in quantitative pulmonary imaging.
Materials and Methods
Twelve CB57/B6 mice were imaged during peak inspiration and end-exhalation using the CNT micro-CT system. The respiratory trace was derived from a sensor placed underneath the abdomen of the animal. Animals were allowed to breathe freely during the imaging under isoflurane anesthesia. Images were reconstructed using isotropic voxels of 77-μm resolution (50 kVp, 400 projections, 30-ms x-ray pulse). Lung volumes were measured with region-growing techniques and thresholds derived from the surrounding air and soft tissues. Basic functional parameters, including tidal volume, functional reserve capacity and minute volume, were also calculated.
Results
The average scan time was 13.4 ± 1.8 minutes for each phase of the respiratory cycle. Mean lung volumes at peak inspiration and end-expiration were 0.23 ± 0.026 and 0.11 ± 0.024 mL, respectively. The average minute volume was 11.93 ± 2.64 mL/min.
Conclusions
The results of this study demonstrate the utility of a CNT-based micro-CT system in acquiring prospectively gated images from free-breathing mice for obtaining physiologic data. This technique provides an alternative to breath-hold techniques requiring intubation and offers greater dose efficiency than retrospective gating techniques.
The lung continues to be a challenging organ for evaluation with high-resolution micro–computed tomographic (CT) imaging. The large difference in attenuation between air and soft tissue results in an optimal contrast environment for techniques based on CT imaging, with great potential to be useful in a number of applications, including toxicology and oncology . However, the rapid respiratory rate of the most important biomedical model, the mouse, limits evaluation with standard micro-CT systems. In contrast, organ systems with limited associated motion at rest, such as the extremities, have had significantly more micro-CT imaging applications demonstrated .
The respiratory rate of mice ranges from 120 to 300 breaths/min, resulting in a maximum breath-to-breath period of approximately 500 ms. To “freeze” the motion, a single projection image needs to be captured with an equivalent exposure of approximately ≤100 ms. One approach is to intubate the animal and provide full control of its respiration. This approach allows complete control of the animal’s respiration cycle, allowing imaging at almost any point within the cycle . Practically, however, intubation is associated with airway trauma, and by removing the underlying physiologic drive to breathe, obtaining true physiologic parameters using this technique would be difficult. Obtaining these physiologic parameters, however, is of great research interest . Thus, from a pulmonary physiology perspective, the preference is to perform imaging without intubation.
Get Radiology Tree app to read full this article<
Get Radiology Tree app to read full this article<
Materials and methods
Get Radiology Tree app to read full this article<
Get Radiology Tree app to read full this article<
Get Radiology Tree app to read full this article<
Image Acquisition
Get Radiology Tree app to read full this article<
Get Radiology Tree app to read full this article<
Image Reconstruction and Analysis
Get Radiology Tree app to read full this article<
Get Radiology Tree app to read full this article<
Results
Get Radiology Tree app to read full this article<
Get Radiology Tree app to read full this article<
Get Radiology Tree app to read full this article<
Lungvolume(mL)=pixelvolume(mL)×(mean lung density[HU]/air density[HU]). Lung
volume
(
mL
)
=
pixel
volume
(
mL
)
×
(
mean lung density
[
HU
]
/
air density
[
HU
]
)
.
Tidalvolume(mL)=lung volumeexpiration−lung volumeinspiration. Tidal
volume
(
mL
)
=
lung volume
expiration
−
lung volume
inspiration
.
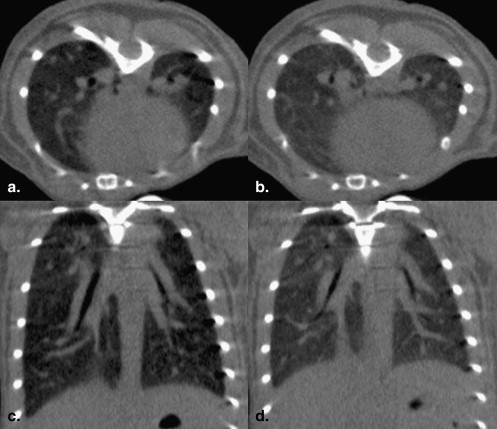
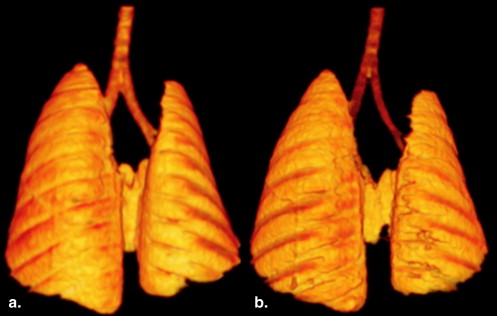
Sample images of a single mouse lung at full expiration and peak inspiration are seen in Figure 3 , with axial and coronal reformatted coronal images. Rendered images of the lungs and trachea at peak inspiration and end-expiration are shown in Figure 4 . Differences in rib spacing are seen that demonstrate the changes in the phase of the respiratory cycle.
Table 1
Comparison of Respiration Rate, Tracheal Diameter, and Organ and Parenchymal Volume at Peak Inspiration and End-expiration for Imaged Mice
Variable Peak Inspiration End-expiration Respiration rate (breaths/min) 92 ± 8.0 101 ± 10.5 Tracheal diameter (mm) 0.94 ± 0.067 0.88 ± 0.071 Organ volume (mL) 0.41 ± 0.071 0.26 ± 0.069 Parenchymal volume (mL) 0.23 ± 0.026 0.11 ± 0.024
Data are expressed as mean ± standard deviation.
Table 2
Comparison of Functional Reserve Capacity, Tidal Volume, and Minute Volume Between the Present Study and a Recent Study by Ford et al
Variable Ford et al Present Study Functional reserve capacity (mL) 0.16 ± 0.03 0.11 ± 0.02 Tidal volume (mL) 0.09 ± 0.03 0.12 ± 0.02 Minute volume (mL/min) 12.47 ± 4.2 (estimated) 11.93 ± 2.64
Data are expressed as mean ± standard deviation.
Get Radiology Tree app to read full this article<
Discussion
Get Radiology Tree app to read full this article<
Get Radiology Tree app to read full this article<
Get Radiology Tree app to read full this article<
Get Radiology Tree app to read full this article<
Get Radiology Tree app to read full this article<
Get Radiology Tree app to read full this article<
Get Radiology Tree app to read full this article<
Get Radiology Tree app to read full this article<
Get Radiology Tree app to read full this article<
Get Radiology Tree app to read full this article<
Conclusions
Get Radiology Tree app to read full this article<
Get Radiology Tree app to read full this article<
References
1. Ford N.L., Martin E.L., Lewis J.F., et. al.: Quantifying lung morphology with respiratory-gated micro-CT in a murine model of emphysema. Phys Med Biol 2009; 54: pp. 2121-2130.
2. Shofer S., Badea C., Qi Y., et. al.: A micro-CT analysis of murine lung recruitment in bleomycin-induced lung injury. J Appl Physiol 2008; 105: pp. 669-677.
3. Cody D.D., Nelson C.L., Bradley W.M., et. al.: Murine lung tumor measurement using respiratory-gated micro-computed tomography. Invest Radiol 2005; 40: pp. 263-269.
4. Schambach S.J., Bag S., Schilling L., et. al.: Application of micro-CT in small animal imaging. Methods 2010; 50: pp. 2-13.
5. Walters E.B., Panda K., Bankson J.A., et. al.: Improved method of in vivo respiratory-gated micro-CT imaging. Phys Med Biol 2004; 49: pp. 4163-4172.
6. O’Neil J.J., Raub J.A.: Pulmonary function testing in small laboratory mammals. Environ Health Perspect 1984; 56: pp. 11-22.
7. Cheng Y., Zhang J., Lee Y.Z., et. al.: Dynamic radiography using a carbon-nanotube-based field-emission x-ray source. Rev Sci Instrum 2004; 75: pp. 3264-3267.
8. Cao G., Lee Y.Z., Peng R., et. al.: A dynamic micro-CT scanner based on a carbon nanotube field emission x-ray source. Phys Med Biol 2009; 54: pp. 2323-2340.
9. Rosset A., Spadola L., Ratib O.: OsiriX: an open-source software for navigating in multidimensional DICOM images. J Digit Imaging 2004; 17: pp. 205-216.
10. Ford N.L., Martin E.L., Lewis J.F., et. al.: In vivo characterization of lung morphology and function in anesthetized free-breathing mice using micro-computed tomography. J Appl Physiol 2007; 102: pp. 2046-2055.
11. Lai-Fook S.J., Houtz P.K., Lai Y.: End-expiratory and tidal volumes measured in conscious mice using single projection x-ray images. J Appl Physiol 2008; 104: pp. 521-533.
12. Jobse B.N., Johnson J.R., Farncombe T.H., et. al.: Evaluation of allergic lung inflammation by computed tomography in a rat model in vivo. Eur Respir J 2009; 33: pp. 1437-1447.
13. Ford N.L., Nikolov H.N., Norley C.J.D., et. al.: Prospective respiratory-gated micro-CT of free breathing rodents. Med Phys 2005; 32: pp. 2888-2898.
14. Ask K., Labiris R., Farkas L., et. al.: Comparison between conventional and “clinical” assessment of experimental lung fibrosis. J Transl Med 2008; 6: pp. 16.
15. Brown R.H., Walters D.M., Greenberg R.S., et. al.: A method of endotracheal intubation and pulmonary functional assessment for repeated studies in mice. J Appl Physiol 1999; 87: pp. 2362-2365.
16. Curley G.F., Kevin L.G., Laffey J.G.: Mechanical ventilation. Anesthesiology 2009; 111: pp. 701-703.
17. Wolthuis E., Vlaar A., Choi G., et. al.: Mechanical ventilation using non-injurious ventilation settings causes lung injury in the absence of pre-existing lung injury in healthy mice. Crit Care 2009; 13: pp. R1.
18. Namati E., Chon D., Thiesse J., et. al.: In vivo micro-CT lung imaging via a computer-controlled intermittent iso-pressure breath hold (IIBH) technique. Phys Med Biol 2006; 51: pp. 6061-6075.
19. Bartling S.H., Stiller W., Grasruck M., et. al.: Retrospective motion gating in small animal CT of mice and rats. Invest Radiol 2007; 42: pp. 704-714.
20. Cavanaugh D., Johnson E., Price R.E., et. al.: In vivo respiratory-gated micro-CT imaging in small-animal oncology models. Mol Imaging 2004; 3: pp. 55-62.
21. Eger E.I.: The pharmacology of isoflurane. Br J Anaesth 1984; 56: pp. 71S-99S.