
Rationale and Objectives
The aim of this study was to assess prostate cancer detection using a broad range of computed b-values up to 5000 s/mm 2 .
Materials and Methods
This retrospective Health Insurance Portability and Accountability Act-compliant study was approved by an institutional review board with consent waiver. Forty-nine patients (63 ± 8 years) underwent 3T prostate magnetic resonance imaging before prostatectomy. Examinations included diffusion-weighted imaging (DWI) with b-values of 50 and 1000 s/mm 2 . Seven computed DWI image sets (b-values: 1000, 1500, 2000, 2500, 3000, 4000, and 5000 s/mm 2 ) were generated by mono-exponential fit. Two blinded radiologists (R1 [attending], R2 [fellow]) independently evaluated diffusion weighted image sets for image quality and dominant lesion location. A separate unblinded radiologist placed regions of interest to measure tumor-to-peripheral zone (PZ) contrast. Pathologic findings from prostatectomy served as reference standard. Measures were compared between b-values using the Jonckheere-Terpstra trend test, Spearman correlation coefficient, and generalized estimating equations based on logistic regression for correlated data.
Results
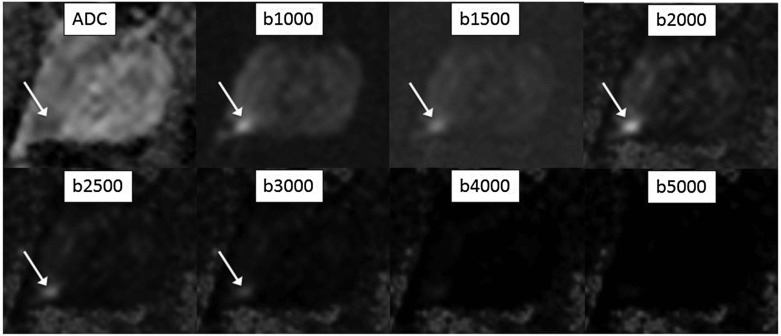
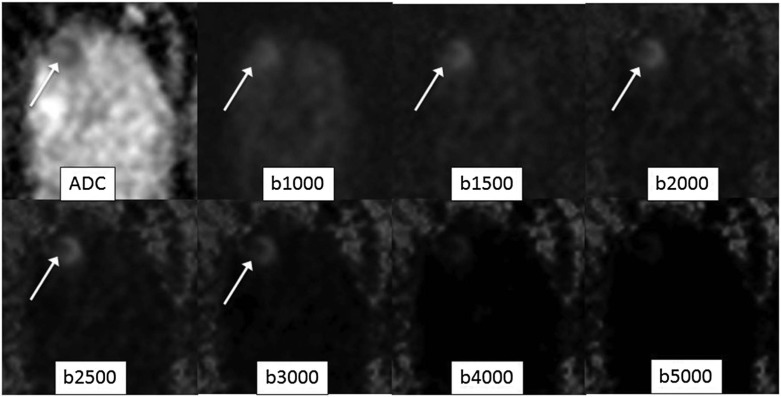
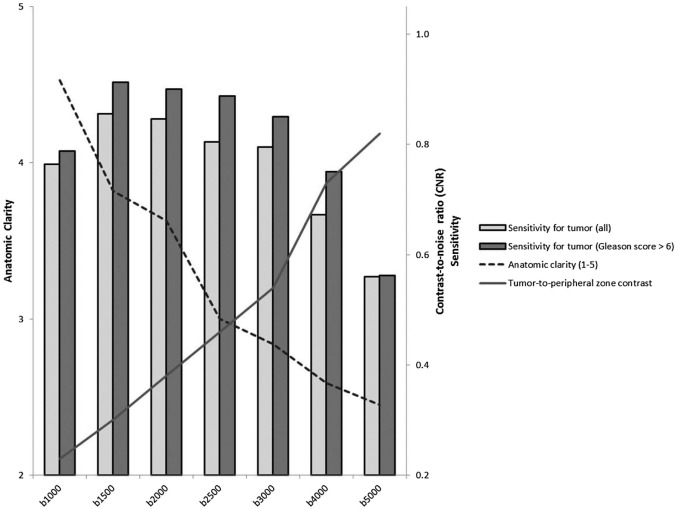
As b-value increased, tumor-to-PZ contrast and benign prostate suppression for both readers increased ( r = +0.65 to +0.71, P ≤ 0.001), whereas anatomic clarity, visualization of the capsule, and visualization of peripheral-transition zone edge decreased ( r = −0.69 to −0.75, P ≤ 0.003). Sensitivity for tumor was highest for R1 at b1500–3000 (84%–88%) and for R2 at b1500–2500 (70%–76%). Sensitivities for both pathologic outcomes were lower for both readers at both b1000 and the highest computed b-values. Sensitivity for Gleason >6 tumor was highest for R1 at b1500–3000 (90%–93%) and for R2 at 1500–2500 (78%–80%). The positive predictive value for tumor for R1 was similar from b1000 to 4000 (93%–98%) and for R2 was similar from b1500 to 4000 (88%–94%).
Conclusions
Computed b-values in the range of 1500–2500 s/mm 2 (but not higher) were optimal for prostate cancer detection; b-values of 1000 or 3000–5000 exhibited overall lower performance.
Introduction
Diffusion-weighted imaging (DWI) plays a central role in prostate magnetic resonance imaging (MRI) interpretation, being designated as the dominant sequence for guiding localization and risk assessment of focal peripheral zone (PZ) lesions in the American College of Radiology Prostate Imaging Reporting and Data System (PI-RADS) version 2 guidelines . When performing DWI using conventional b-values up to 1000 s/mm 2 , the apparent diffusion coefficient (ADC) map serves as the primary image set for interpretation. In comparison, unsuppressed signal within benign prostate tissue obscures potential hyperintensity within tumors on the acquired DWI at such b-values . Although higher b-value DWI yields greater benign tissue suppression and thus potential improved tumor visualization, direct acquisition of such b-values is technically difficult because of issues related to reduced signal-to-noise ratio (SNR) and increased anatomic distortion and artifacts resulting from increased eddy currents at these b-values .
A number of studies report techniques entailing novel pulse sequences and parameter optimization for improving distortion and artifacts of high b-value DWI . However, an alternative approach is to perform “computed” DWI, in which the very high b-value images are mathematically derived from the ADC map without being actually acquired themselves . This scheme is intended to provide the benign prostate signal suppression of acquired very high b-value images while avoiding the challenges of low SNR and increased artifacts that are encountered when directly acquiring such images. Although computed high b-value DWI does not acquire additional diffusion data compared to the standard b-values, this post-processing technique may in practice improve visual conspicuity of tumors, without requiring any increase in scan time. Indeed, a number of studies have demonstrated significantly improved prostate cancer detection using computed b-values up to 2000 . Furthermore, PI-RADS v2 formally acknowledges the role of computed DWI in multiparametric prostate MRI and incorporates findings at the very high b-values into its lesion assessment categories .
Get Radiology Tree app to read full this article<
Methods
Patients
Get Radiology Tree app to read full this article<
MRI Acquisition and Post-processing
Get Radiology Tree app to read full this article<
Get Radiology Tree app to read full this article<
Image Interpretation
Get Radiology Tree app to read full this article<
Get Radiology Tree app to read full this article<
Get Radiology Tree app to read full this article<
Reference Standard
Get Radiology Tree app to read full this article<
Get Radiology Tree app to read full this article<
Statistics
Get Radiology Tree app to read full this article<
Results
Image Quality
Get Radiology Tree app to read full this article<
TABLE 1
Comparison of Measures of Image Quality Between Diffusion-weighted Images Using Various b-values (Provided as Mean ± Standard Deviation)
b-Value Background Suppression Anatomic Clarity Visualization of Capsule Visualization of PZ-TZ Edge Reader 1 Reader 2 Reader 1 Reader 2 Reader 1 Reader 2 Reader 1 Reader 2 1000 2.29 ± 0.71 2.37 ± 0.86 4.53 ± 0.65 4.65 ± 0.75 4.69 ± 0.51 4.69 ± 0.74 4.49 ± 0.77 4.33 ± 0.77 1500 3.08 ± 0.81 3.49 ± 0.82 3.82 ± 0.39 3.90 ± 0.42 4.14 ± 0.68 3.80 ± 0.50 3.67 ± 0.63 3.98 ± 0.80 2000 3.55 ± 0.54 4.20 ± 0.54 3.63 ± 0.49 3.06 ± 0.24 3.80 ± 0.46 3.31 ± 0.47 2.98 ± 0.32 3.04 ± 0.20 2500 3.63 ± 0.57 4.59 ± 0.61 3.00 ± 0.29 2.71 ± 0.46 3.12 ± 0.33 2.98 ± 0.14 3.29 ± 0.76 2.71 ± 0.50 3000 3.67 ± 0.72 4.90 ± 0.31 2.84 ± 0.37 2.37 ± 0.53 3.04 ± 0.41 2.61 ± 0.53 2.80 ± 0.91 2.41 ± 0.67 4000 4.43 ± 0.65 4.94 ± 0.43 2.59 ± 0.57 1.55 ± 0.54 2.90 ± 0.42 1.80 ± 0.46 2.18 ± 0.91 1.39 ± 0.53 5000 4.35 ± 1.01 4.49 ± 1.32 2.45 ± 1.12 2.35 ± 1.88 2.76 ± 0.90 2.16 ± 1.52 1.94 ± 0.90 2.10 ± 1.58
PZ-TZ, peripheral zone-transition zone.
Get Radiology Tree app to read full this article<
Pathologic Findings
Get Radiology Tree app to read full this article<
Tumor Detection
Get Radiology Tree app to read full this article<
TABLE 2
Comparison of Diagnostic Performance for Index Tumor Localization and Tumor-to-peripheral Zone (PZ) Contrast Between Various Diffusion-weighted Image Sets
b-Value Sensitivity (All Tumors) Sensitivity (Gleason score > 6) PPV Tumor-to-PZ Contrast Reader 1 Reader 2 Reader 1 Reader 2 Reader 1 Reader 2 ADC map 81.6% (40/49) 71.4% (35/49) 82.5% (33/40) 75.0% (30/40) 95.2% (40/42) 85.4% (35/41) 0.18 ± 0.08 1000 79.6% (39/49) 63.3% (31/49) 80.0% (32/40) 67.5% (27/40) 95.1% (39/41) 82.1% (32/39) 0.18 ± 0.13 1500 85.7% (42/49) 75.5% (37/49) 92.5% (37/40) 80.0% (32/40) 93.3% (42/45) 92.5% (37/40) 0.25 ± 0.16 2000 87.8% (43/49) 71.4% (35/49) 92.5% (37/40) 77.5% (31/40) 95.6% (43/45) 87.5% (35/40) 0.33 ± 0.18 2500 85.7% (42/49) 69.4% (34/49) 90.0% (36/40) 77.5% (31/40) 97.7% (42/43) 91.9% (34/37) 0.41 ± 0.19 3000 83.7% (41/49) 65.3% (32/49) 90.0% (36/40) 70.0% (28/40) 93.2% (41/44) 94.1% (32/34) 0.49 ± 0.21 4000 75.5% (37/49) 57.1% (28/49) 80.0% (32/40) 60.0% (24/40) 94.9% (37/39) 93.3% (28/30) 0.68 ± 0.23 5000 65.3% (32/49) 36.7% (18/49) 65.0% (26/40) 37.5% (15/40) 86.5% (32/37) 75.0% (18/24) 0.77 ± 0.27
ADC, apparent diffusion coefficient; PPV, positive predictive value.
TABLE 3
P -values From Comparison of Image Sets with Respect to Measures of Reader Performance
Sensitivity (All Tumors) ADC b1000 b1500 b2000 b2500 b3000 b4000 b1000 R1: 0.654
R2: 0.282 — — — — — — b1500 R1: 0.413
R2: 0.526 R1: 0.254
R2: 0.028r — — — — b2000 R1: 0.176
R2: 1.000 R1: 0.098
R2: 0.151 R1: 0.313
R2: 0.412 — — — — b2500 R1: 0.314
R2: 0.739 R1: 0.175
R2: 0.252 R1: 1.000
R2: 0.252 R1: 0.313
R2: 0.313 — — — b3000 R1: 0.705
R2: 0.363 R1: 0.479
R2: 0.763 R1: 0.313
R2: 0.089 R1: 0.151
R2: 0.252 R1: 0.563
R2: 0.412 — — b4000 R1: 0.253
R2: 0.029c R1: 0.478
R2: 0.363R1: 0.021c
R2: 0.001cR1: 0.011c
R2: 0.005cR1: 0.021c
R2: 0.028cR1: 0.039c
R2: 0.095 — b5000R1: 0.009c
R2: <0.001cR1: 0.016c
R2: 0.002cR1: 0.006c
R2: <0.001cR1: 0.002c
R2: <0.001cR1: 0.003c
R2: <0.001cR1: 0.010c
R2: <0.001c R1: 0.089
R2: 0.002c
Sensitivity (Gleason Score > 6) ADC b1000 b1500 b2000 b2500 b3000 b4000 b1000 R1: 0.654
R2: 0.364 — — — — — — b1500R1: 0.042r
R2: 0.478R1: 0.023r
R2: 0.052 — — — — — b2000R1: 0.042r
R2: 0.705R1: 0.023r
R2: 0.094 R1: 1.000
R2: 0.654 — — — — b2500 R1: 0.077
R2: 0.705R1: 0.040r
R2: 0.094 R1: 0.313
R2: 0.654 R1: 0.313
R2: 1.000 — — — b3000 R1: 0.177
R2: 0.526 R1: 0.100
R2: 0.739 R1: 0.313
R2: 0.095 R1: 0.313
R2: 0.173 R1: 1.000
R2: 0.173 — — b4000 R1: 0.654
R2: 0.051 R1: 1.000
R2: 0.313R1: 0.023c
R2: 0.002cR1: 0.001c
R2 <0.001cR1: 0.040c
R2: 0.005cR1: 0.040c
R2: 0.037c — b5000R1: 0.015c
R2: <0.001cR1: 0.028c
R2: 0.001cR1: 0.001c
R2: <0.001cR1: 0.001c
R2: 0.001cR1: 0.001c
R2: <0.001cR1: 0.001c
R2: <0.001cR1: 0.010c
R2: 0.001c
ADC, apparent diffusion coefficient.
Values listed in bold when statistically significant at p<0.05. For statistically significant differences, “r” and “c” are used to denote whether the image set represented by the given row or column, respectively, had higher sensitivity.
Get Radiology Tree app to read full this article<
Get Radiology Tree app to read full this article<
Get Radiology Tree app to read full this article<
Get Radiology Tree app to read full this article<
Discussion
Get Radiology Tree app to read full this article<
Get Radiology Tree app to read full this article<
Get Radiology Tree app to read full this article<
Get Radiology Tree app to read full this article<
Get Radiology Tree app to read full this article<
Acknowledgments
Get Radiology Tree app to read full this article<
Get Radiology Tree app to read full this article<
Get Radiology Tree app to read full this article<
Get Radiology Tree app to read full this article<
References
1. American College of Radiology : Magnetic Resonance Prostate Imaging Reporting and Data System (MR PI-RADS). Available at http://www.acr.org/Quality-Safety/Resources/PIRADS Accessed May 21, 2015
2. Rosenkrantz A.B., Kong X., Niver B.E., et. al.: Prostate cancer: comparison of tumor visibility on trace diffusion-weighted images and the apparent diffusion coefficient map. AJR Am J Roentgenol 2011; 196: pp. 123-129.
3. Rosenkrantz A.B., Chandarana H., Hindman N., et. al.: Computed diffusion-weighted imaging of the prostate at 3 T: impact on image quality and tumour detection. Eur Radiol 2013; 23: pp. 3170-3177.
4. Barth B.K., Cornelius A., Nanz D., et. al.: Diffusion-weighted imaging of the prostate: image quality and geometric distortion of readout-segmented versus selective-excitation accelerated acquisitions. Invest Radiol 2015; 50: pp. 785-791.
5. Korn N., Kurhanewicz J., Banerjee S., et. al.: Reduced-FOV excitation decreases susceptibility artifact in diffusion-weighted MRI with endorectal coil for prostate cancer detection. Magn Reson Imaging 2015; 33: pp. 56-62.
6. Donato F., Costa D.N., Yuan Q., et. al.: Geometric distortion in diffusion-weighted MR imaging of the prostate-contributing factors and strategies for improvement. Acad Radiol 2014; 21: pp. 817-823.
7. Blackledge M.D., Leach M.O., Collins D.J., et. al.: Computed diffusion-weighted MR imaging may improve tumor detection. Radiology 2011; 261: pp. 573-581.
8. Ueno Y., Takahashi S., Ohno Y., et. al.: Computed diffusion-weighted MRI for prostate cancer detection: the influence of the combinations of b-values. Br J Radiol 2015; 88: pp. 20140738.
9. Maas M.C., Futterer J.J., Scheenen T.W.: Quantitative evaluation of computed high B value diffusion-weighted magnetic resonance imaging of the prostate. Invest Radiol 2013; 48: pp. 779-786.
10. Bittencourt L.K., Attenberger U.I., Lima D., et. al.: Feasibility study of computed vs measured high b-value (1400 s/mm(2)) diffusion-weighted MR images of the prostate. World J Radiol 2014; 6: pp. 374-380.
11. Feuerlein S., Davenport M.S., Krishnaraj A., et. al.: Computed high b-value diffusion-weighted imaging improves lesion contrast and conspicuity in prostate cancer. Prostate Cancer Prostatic Dis 2015; 18: pp. 155-160.
12. Rosenkrantz A.B., Hindman N., Lim R.P., et. al.: Diffusion-weighted imaging of the prostate: Comparison of b1000 and b2000 image sets for index lesion detection. J Magn Reson Imaging 2013; 38: pp. 694-700.
13. Cornfeld D.M., Israel G., McCarthy S.M., et. al.: Pelvic imaging using a T1W fat-suppressed three-dimensional dual echo Dixon technique at 3T. J Magn Reson Imaging 2008; 28: pp. 121-127.
14. Rosenkrantz A.B., Neil J., Kong X., et. al.: Prostate cancer: Comparison of 3D T2-weighted with conventional 2D T2-weighted imaging for image quality and tumor detection. AJR Am J Roentgenol 2010; 194: pp. 446-452.
15. Hubbard A.E., Ahern J., Fleischer N.L., et. al.: To GEE or not to GEE: comparing population average and mixed models for estimating the associations between neighborhood risk factors and health. Epidemiology 2010; 21: pp. 467-474.
16. Grant K.B., Agarwal H.K., Shih J.H., et. al.: Comparison of calculated and acquired high b value diffusion-weighted imaging in prostate cancer. Abdom Imaging 2015; 40: pp. 578-586.
17. Vural M., Ertas G., Onay A., et. al.: Conspicuity of peripheral zone prostate cancer on computed diffusion-weighted imaging: comparison of cDWI1500, cDWI2000, and cDWI3000. Biomed Res Int 2014; 2014: 768291
18. Rosenkrantz A.B., Sigmund E.E., Johnson G., et. al.: Prostate cancer: feasibility and preliminary experience of a diffusional kurtosis model for detection and assessment of aggressiveness of peripheral zone cancer. Radiology 2012; 264: pp. 126-135.
19. Rosenkrantz A.B., Padhani A.R., Chenevert T.L., et. al.: Body diffusion kurtosis imaging: Basic principles, applications, and considerations for clinical practice. J Magn Reson Imaging 2015; 42: pp. 1190-1202.
20. Shinmoto H., Tamura C., Soga S., et. al.: An intravoxel incoherent motion diffusion-weighted imaging study of prostate cancer. AJR Am J Roentgenol 2012; 199: pp. W496-W500.