
Rationale and Objectives
Hyperpolarized 3 He magnetic resonance imaging (MRI) previously revealed the temporal and spatial heterogeneity of ventilation defects in asthmatics, but these findings have not been used in treatment studies or to guide personalized therapy. Our objective was to exploit the temporal and spatial information inherent to 3 He MRI and develop image processing methods to generate pulmonary ventilation temporal–spatial maps that could be used to measure, optimize, and guide asthma therapy.
Materials and Methods
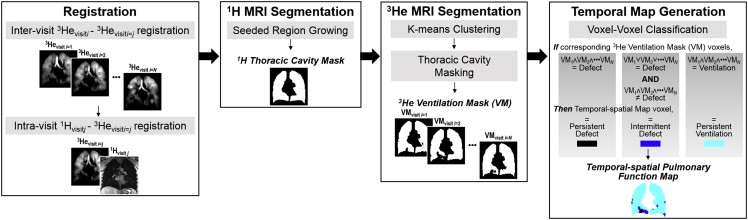
In this proof-of-concept study, seven asthmatics provided written informed consent to an approved protocol and underwent spirometry and 3 He MRI on three occasions, each 5 ± 2 days apart. A registration and segmentation pipeline was developed to generate three-dimensional, temporal–spatial, pulmonary function maps. Briefly, 3 He ventilation images were segmented to generate ventilation masks that were coregistered and voxels classified according to their temporal behavior. This enabled the regional mapping of temporally persistent and intermittent ventilation defects that were normalized to the 1 H MRI thoracic cavity volume to generate persistent ventilation defect percent (VDP P ) and intermittent ventilation defect percent (VDP I ).
Results
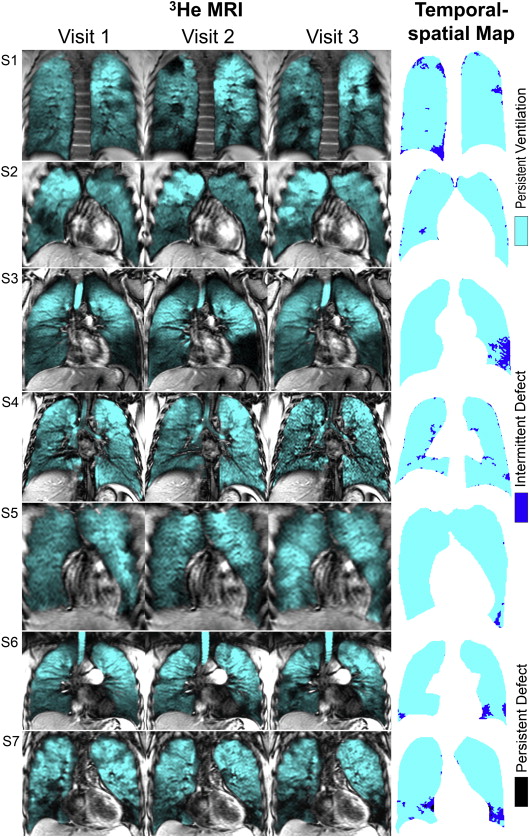
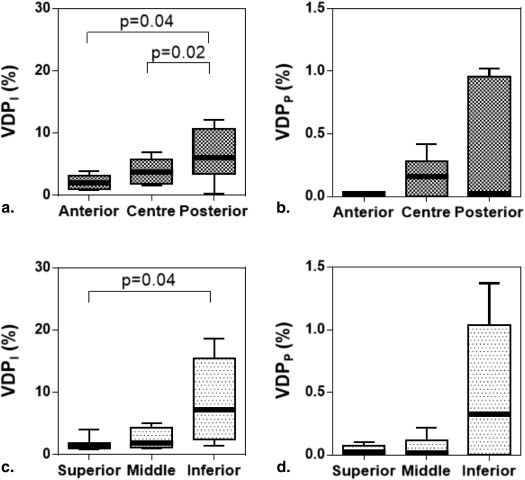
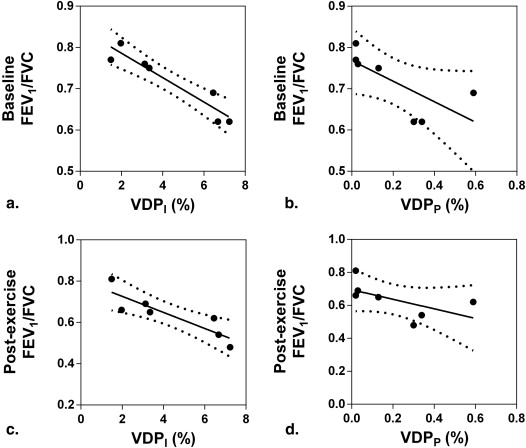
3 He temporal–spatial pulmonary function maps identified temporally persistent and intermittent ventilation defects. VDP I was significantly greater in the posterior ( P = .04) and inferior ( P = .04) lung as compared to the anterior and superior lung. Persistent and intermittent ventilation defect percent were strongly correlated with forced expiratory volume in one second/forced vital capacity (VDP P : r = −0.87, P = .01; VDP I : r = −0.96, P = .0008).
Conclusions
Temporal–spatial pulmonary maps generated from 3 He MRI can be used to quantify temporally persistent and intermittent ventilation defects as asthma intermediate end points and targets for therapy.
Asthma is a chronic pulmonary disease characterized by acute and predominantly reversible episodes of airflow limitation and airway hyper-responsiveness that leads to airway remodeling . Currently used asthma measurements are largely dependent on spirometry measurements of airflow limitation made at the mouth. Such measurements tend to overestimate large airway constriction and underestimate small airways disease , and these measurements cannot regionally identify the airways responsible for airflow limitation, asthma symptoms, or control.
Currently, pulmonary imaging techniques play a minor role in the clinical diagnosis and management of asthma, although quantitative measurements of regional, structural, and functional pulmonary abnormalities can be derived using a number of imaging methods. For example, x-ray computed tomography (CT) has been used to show airway remodeling and evidence of gas trapping in asthmatics . Single-photon emission computed tomography and positron-emission tomography have revealed the spatial distribution and extent of airway remodeling in asthmatics at rest and during exacerbations. Hyperpolarized noble gas magnetic resonance imaging (MRI), using either 3 He or 129 Xe, also provides a way to visualize and quantify lung regions that participate in ventilation and those that do not . Longitudinal and interventional 3 He MRI studies have revealed the regional and temporal nature of ventilation defects in asthma before and after provocation (exercise and methacholine) and therapy . Previous work also showed that in asthma, ventilation defects are related to disease severity , CT measurements of gas trapping , and airway morphological abnormalities . Taken together, these studies suggest that in asthma, ventilation defects are related to airways disease, are regionally heterogeneous, temporally variable, and responsive to therapy and provocation . Asthma ventilation defects may be considered as therapy targets or intermediate end points as they are present in older asthmatics with more advanced or severe disease, increased indices of inflammation, and more severely remodeled airways .
Get Radiology Tree app to read full this article<
Materials and methods
Study Design
Get Radiology Tree app to read full this article<
Magnetic Resonance Imaging
Get Radiology Tree app to read full this article<
Get Radiology Tree app to read full this article<
Image Analysis
Overview of Pipeline
Get Radiology Tree app to read full this article<
Get Radiology Tree app to read full this article<
Step 1: Registration
Get Radiology Tree app to read full this article<
Step 2: 1 H MRI Segmentation
Get Radiology Tree app to read full this article<
Step 3: 3 He MRI Segmentation
Get Radiology Tree app to read full this article<
Step 4: Temporal Map Generation
Get Radiology Tree app to read full this article<
Registration Performance Evaluation
Get Radiology Tree app to read full this article<
Statistical Analysis
Get Radiology Tree app to read full this article<
Results
Get Radiology Tree app to read full this article<
Table 1
Subject Demographic Characteristics
Parameter Asthma (±SD) [Range]; ( n = 7) Age, years 28 (9) [21–47] Male/female 4/3 BMI kg/m 2 26 (4) [21–33] SaO 2 97 (2) [94–98] FEV 1 % pred 88 (11) [65–99] FVC% pred 104 (10) [89–120] FEV 1 /FVC% 72 (8) [61–81]
BMI, body mass index; FEV 1 , forced expiratory volume in 1 second; FVC, forced vital capacity; SaO 2 , arterial oxygen saturation; SD, standard deviation; % pred , percent predicted.
Table 2
Repeated Spirometry and Hyperpolarized 3 He Measurements
Parameter Time Point (±SD) [Range]; ( n = 7) Significance of Difference ( P ) ∗ Visit 1 Visit 2 Visit 3 Spirometry FEV 1 % pred 88 (11) [65–99] 86 (12) [59–96] 84 (12) [62–95] .22 FVC% pred 104 (10) [89–120] 101 (15) [77–127] 99 (14) [83–126] .18 FEV 1 /FVC% 72 (8) [61–81] 71 (7) [60–81] 72 (8) [62–82] .76 Hyperpolarized 3 He Dose, mL 386 (70) [290–490] 380 (76) [250–490] 386 (95) [250–550] .74 Polarization, % 13 (2) [10–15] 12 (2) [8–14] 12 (2) [9–14] .31 MRI VDP, % 4 (2) [1–7] 4 (3) [1–9] 4 (3) [1–8] .93
FEV 1 , forced expiratory volume in 1 second; FVC, forced vital capacity; MRI, magnetic resonance imaging; SD, standard deviation; VDP, ventilation defect percent; % pred , percent predicted.
Get Radiology Tree app to read full this article<
Table 3
Subject Listing of Demographic, Spirometry and Hyperpolarized 3 He MRI Measurements
Subject Age Spirometry Hyperpolarized 3 He MRI Sex FEV 1 % pred FVC% pred FEV 1 /FVC, % Dose, mL Polarization, % VDP, % VDP P , % VDP I , % PVP, % V1/V2/V3 V1/V2/V3 V1/V2/V3 V1/V2/V3 V1/V2/V3 V1/V2/V3 1 27 M 89/88/77 108/103/95 69/70/68 390/390/390 13/14/14 3/5/8 0.59 6.45 92.96 2 25 M 85/83/84 94/96/87 76//73/81 420/420/420 13/12/14 1/1/1 0.02 1.49 98.49 3 22 M 88/91/94 120/127/126 62/60/63 390/390/390 15/12/13 7/9/2 0.30 7.23 92.47 4 28 M 95/89/90 106/101/95 75/74/79 490/490/550 11/9/12 2/2/1 0.03 3.13 96.84 5 27 F 94/96/95 102/105/102 81/81/82 290/250/250 10/8/9 4/1/2 0.02 1.97 98.01 6 21 F 99/93/87 108/100/105 77/78/70 420/400/400 14/14/14 2/4/5 0.13 3.35 96.53 7 47 F 65/59/62 89/77/83 61/64/62 300/320/300 14/13/9 6/4/6 0.34 6.68 92.98 Mean 28 — 88/86/84 104/101/99 72/71/72 386/380/386 13/12/12 4/4/4 0.20 4.33 95.47 SD 9 — 11/12/12 10/15/14 8/7/8 70/76/95 2/2/2 2/3/3 0.22 2.40 2.58
FEV 1 , forced expiratory volume in 1 second; FVC, forced vital capacity; PVP, persistent ventilation percent; V1, visit 1; V2, visit 2; V3, visit 3; VDP, ventilation defect percent; VDP P , persistent ventilation defect percent; VDP I , intermittent ventilation defect percent; % pred , percent predicted.
Get Radiology Tree app to read full this article<
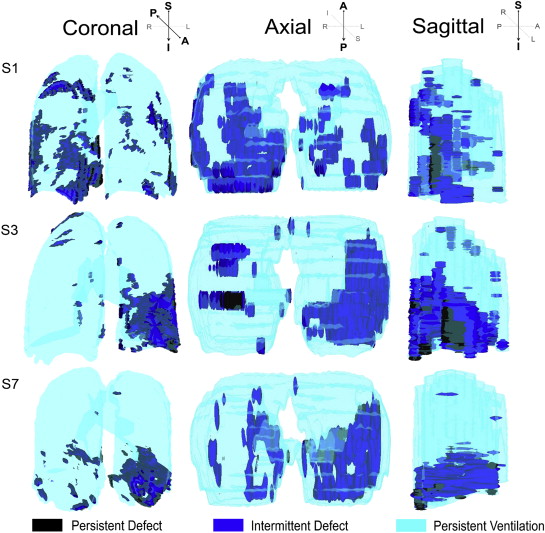
Temporal–Spatial Pulmonary Function Maps
Get Radiology Tree app to read full this article<
Target Registration Error
Get Radiology Tree app to read full this article<
Ventilation Defect Temporal Behavior
Get Radiology Tree app to read full this article<
Anatomic Differences
Get Radiology Tree app to read full this article<
Get Radiology Tree app to read full this article<
Relationships with Spirometry
Get Radiology Tree app to read full this article<
Get Radiology Tree app to read full this article<
Discussion
Get Radiology Tree app to read full this article<
Get Radiology Tree app to read full this article<
Get Radiology Tree app to read full this article<
Get Radiology Tree app to read full this article<
Get Radiology Tree app to read full this article<
Get Radiology Tree app to read full this article<
Get Radiology Tree app to read full this article<
Acknowledgments
Get Radiology Tree app to read full this article<
Get Radiology Tree app to read full this article<
Get Radiology Tree app to read full this article<
References
1. Global Strategy for Asthma Management and Prevention, Global Initiative for Asthma (GINA) 2012. Available at: http://www.ginasthma.org .
2. Crimi E., Spanevello A., Neri M., et. al.: Dissociation between airway inflammation and airway hyperresponsiveness in allergic asthma. Am J Respir Crit Care Med 1998; 157: pp. 4-9.
3. Skold C.M.: Remodeling in asthma and COPD—differences and similarities. Clin Respir J 2010; 4: pp. 20-27.
4. Perez T., Chanez P., Dusser D., et. al.: Small airway impairment in moderate to severe asthmatics without significant proximal airway obstruction. Resp Med 2013; 107: pp. 1667-1674.
5. Castro M., Fain S.B., Hoffman E.A., et. al.: Lung imaging in asthmatic patients: the picture is clearer. J Allergy Clin Immunol 2011; 128: pp. 467-478.
6. Niimi A., Matsumoto H., Amitani R., et. al.: Airway wall thickness in asthma assessed by computed tomography. Relation to clinical indices. Am J Respir Crit Care Med 2000; 162: pp. 1518-1523.
7. Aysola R.S., Hoffman E.A., Gierada D., et. al.: Airway remodeling measured by multidetector CT is increased in severe asthma and correlates with pathology. Chest 2008; 134: pp. 1183-1191.
8. King G.G., Eberl S., Salome C.M., et. al.: Airway closure measured by a technegas bolus and SPECT. Am J Respir Crit Care Med 1997; 155: pp. 682-688.
9. King G.G., Eberl S., Salome C.M., et. al.: Differences in airway closure between normal and asthmatic subjects measured with single-photon emission computed tomography and technegas. Am J Respir Crit Care Med 1998; 158: pp. 1900-1906.
10. Venegas J.G., Winkler T., Musch G., et. al.: Self-organized patchiness in asthma as a prelude to catastrophic shifts. Nature 2005; 434: pp. 777-782.
11. Albert M.S., Cates G.D., Driehuys B., et. al.: Biological magnetic resonance imaging using laser-polarized 129 Xe. Nature 1994; 370: pp. 199-201.
12. Altes T.A., Powers P.L., Knight-Scott J., et. al.: Hyperpolarized 3 He MR lung ventilation imaging in asthmatics: preliminary findings. J Magn Reson Imaging 2001; 13: pp. 378-384.
13. de Lange E.E., Altes T.A., Patrie J.T., et. al.: The variability of regional airflow obstruction within the lungs of patients with asthma: assessment with hyperpolarized helium-3 magnetic resonance imaging. J Allergy Clin Immunol 2007; 119: pp. 1072-1078.
14. de Lange E.E., Altes T.A., Patrie J.T., et. al.: Changes in regional airflow obstruction over time in the lungs of patients with asthma: evaluation with 3 He MR imaging. Radiology 2009; 250: pp. 567-575.
15. Wheatley A., McKay S., Mathew L., et. al.: Hyperpolarized helium-3 magnetic resonance imaging of asthma: short-term reproducibility. Medical Imaging.2008.International Society for Optics and PhotonicsSan Diego, CA 69161X-X-8
16. de Lange E.E., Altes T.A., Patrie J.T., et. al.: Evaluation of asthma with hyperpolarized helium-3 MRI: correlation with clinical severity and spirometry. Chest 2006; 130: pp. 1055-1062.
17. Fain S.B., Gonzalez-Fernandez G., Peterson E.T., et. al.: Evaluation of structure-function relationships in asthma using multidetector CT and hyperpolarized He-3 MRI. Acad Radiol 2008; 15: pp. 753-762.
18. Svenningsen S., Kirby M., Starr D., et. al.: What are ventilation defects in asthma?. Thorax 2014; 69: pp. 63-71.
19. Tzeng Y.S., Lutchen K., Albert M.: The difference in ventilation heterogeneity between asthmatic and healthy subjects quantified using hyperpolarized 3He MRI. J Appl Physiol 2009; 106: pp. 813-822.
20. Costella S., Kirby M., Maksym G.N., et. al.: Regional pulmonary response to a methacholine challenge using hyperpolarized 3 He magnetic resonance imaging. Respirology 2012; 17: pp. 1237-1246.
21. Samee S., Altes T., Powers P., et. al.: Imaging the lungs in asthmatic patients by using hyperpolarized helium-3 magnetic resonance: assessment of response to methacholine and exercise challenge. J Allergy Clin Immunol 2003; 111: pp. 1205-1211.
22. Svenningsen S., Kirby M., Starr D., et. al.: Hyperpolarized 3 He and 129 Xe MRI: differences in asthma before bronchodilation. J Magn Reson Imaging 2013; 38: pp. 1521-1530.
23. Miller M.R., Hankinson J., Brusasco V., et. al.: Standardisation of spirometry. Eur Respir J 2005; 26: pp. 319-338.
24. Crapo R.O., Casaburi R., Coates A.L., et. al.: Guidelines for methacholine and exercise challenge testing-1999. This official statement of the American Thoracic Society was adopted by the ATS Board of Directors, July 1999. Am J Respir Crit Care Med 2000; 161: pp. 309-329.
25. Parraga G., Ouriadov A., Evans A., et. al.: Hyperpolarized 3He ventilation defects and apparent diffusion coefficients in chronic obstructive pulmonary disease: preliminary results at 3.0 Tesla. Invest Radiol 2007; 42: pp. 384-391.
26. Kirby M., Heydarian M., Svenningsen S., et. al.: Hyperpolarized 3He magnetic resonance functional imaging semiautomated segmentation. Acad Radiol 2012; 19: pp. 141-152.
27. Adams R., Bischof L.: Seeded region growing. IEEE Transactions on Pattern Analysis and machine Intelligence 1994; 16: pp. 641-647.
28. Mathew L., Kirby M., Etemad-Rezai R., et. al.: Hyperpolarized (3)He magnetic resonance imaging: preliminary evaluation of phenotyping potential in chronic obstructive pulmonary disease. Eur J Radiol 2011; 79: pp. 140-146.
29. Fitzpatrick J.M., West J.B.: The distribution of target registration error in rigid-body point-based registration. IEEE transactions on medical imaging 2001; 20: pp. 917-927.
30. Niles D.J., Kruger S.J., Dardzinski B.J., et. al.: Exercise-induced bronchoconstriction: reproducibility of hyperpolarized 3He MR imaging. Radiology 2013; 266: pp. 618-625.
31. Cox G., Miller J.D., McWilliams A., et. al.: Bronchial thermoplasty for asthma. Am J Respir Crit Care Med 2006; 173: pp. 965-969.
32. Cho A.: Physics. Helium-3 shortage could put freeze on low-temperature research. Science 2009; 326: pp. 778-779.