
Rationale and Objectives
To evaluate the performance of custom-made software designed to quantify volume and weight of focal portions of lung tumors in regions of interest (ROI) and volume of interest on thin-section computed tomography (CT) images by stratum of CT values.
Methods and Materials
Volume and weight of lung portions were measured three-dimensionally and semiautomatically by CT stratum and compared with standard manual measurements. One each of a partly solid tumor (including initial and follow-up high-resolution CT scans), partly solid tumor with most parts showing solid density, and nonsolid tumors in the mid-zone of the lung were analyzed. The doubling time (DT) of tumor volume and mass were calculated by stratum of CT values.
Results
The software-measured tumor weight in lung periphery was reproducible, with and without trimming of intervening lung structures between borders of ROIs and tumor. For the lesion in the midlung zone, the fairly thick nearby pulmonary vessels degraded the measurements, with a higher measurement error, indicating the need to trim these structures off the ROI. Software measurements allowed quantification of tumor progress based on increase in tumor mass, without significant increase in tumor volume. The DTs for both tumor volume and mass were different among the four strata of CT values in the partly solid nodule.
Conclusion
Our semiautomated volumetric method involving measurement by CT stratum is promising for evaluation of lung tumor progress and aggressiveness.
Characterization of small lung nodules detected incidentally or on computed tomography (CT) screening is important. Clinically, it is also important to estimate the aggressiveness of lung cancers measuring 5–10 mm noninvasively because timely treatment of these tumors could usually lead to an excellent outcome . Unfortunately, it is often difficult to characterize such tumors by invasive procedures, such as transthoracic needle aspiration biopsy, contrast material-enhanced CT, and fluorine-18-fluorodeoxyglucose positron emission tomography . Tumor growth over time has been used as a parameter to differentiate malignant from benign nodules . Furthermore, the tumor volume doubling time (TVDT), based on two time-separated measurements of the nodule diameter, has been used to quantify tumor aggressiveness. However, the TVDT does not reflect asymmetric tumor growth or growth in craniocaudal direction, which is perpendicular to the transversely oriented CT section . A three-dimensional (3D) volumetric measurement technique was also introduced recently , with the use of 3D segmentation techniques and 3D morphologic filters to isolate a pulmonary nodule with an improved result compared with a two-dimensional (2D) method. Most of the currently available software is designed to provide solid nodule volume measurement, rather than subsolid (both partly solid and nonsolid) ones, although there have been a few reports on the sophisticated methods of segmenting both subsolid and solid nodules . Although these studies have focused on clarifying temporal volume changes in lung nodules , it is important to examine not only nodule volume but also nodule density for better evaluation of tumor progress, since the development of the central denser zone (CDZ) in a nonsolid lesion (ie, transformation to a partly solid one) and the increases in size and density of CDZ in partly solid nodule or of solid nodule could indicate progress or aggressiveness of lung cancer . Kawata et al examined CT number histograms for both the whole nodule and two divided portions of the nodule (central and peripheral zones), which was segmented by a custom-made computer-aided diagnosis system and examined volume doubling time for each bin of the histogram to determine the potential usefulness of this method in discriminating benign from malignant lung nodules.
The purpose of our preliminary study was to evaluate custom-made software for semiautomated 3D volume and weight measurements of individual tissue portions of nodular lesions by stratum of CT values to help estimate the aggressiveness of lung tumor based on high-resolution CT (HRCT) scans. We also determined the temporal progression of the tumors at follow-up HRCT scans to assess the prognosis . The HRCT data of three representative patients with partly solid or nonsolid nodule were evaluated retrospectively.
Background of the study
Get Radiology Tree app to read full this article<
Materials and methods
Get Radiology Tree app to read full this article<
Study Subjects in Preliminary Application Study of the Software Program
Get Radiology Tree app to read full this article<
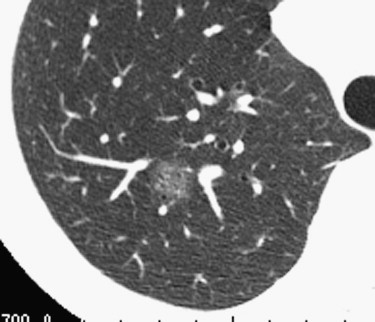
![Figure 1, (a) Initial high-resolution computed tomography (HRCT) of a 73-year-old male, smoker, with adenocarcinomas/WBF (with features of bronchioloalveolar cell carcinoma) showing a partly solid nodule in the periphery of the right upper lobe. Measurements included transverse tumor diameter of 21 × 16 mm (central denser zone [CDZ], 10 × 7 mm) and average CT value of −601 Hounsfield units (HU) (CDZ, −263 HU). (b) Follow-up HRCT of the same patient 2 months later included measurements of transverse tumor diameter of 19 × 16 mm (CDZ, 13 × 9 mm) and average CT value of −483 HU (CDZ, −161 HU). The calculated doubling time was -106 days for total tumor and 52 days for CDZ.](https://storage.googleapis.com/dl.dentistrykey.com/clinical/PulmonaryNodules/0_1s20S107663321000156X.jpg)
Get Radiology Tree app to read full this article<
CT Image Acquisition
Get Radiology Tree app to read full this article<
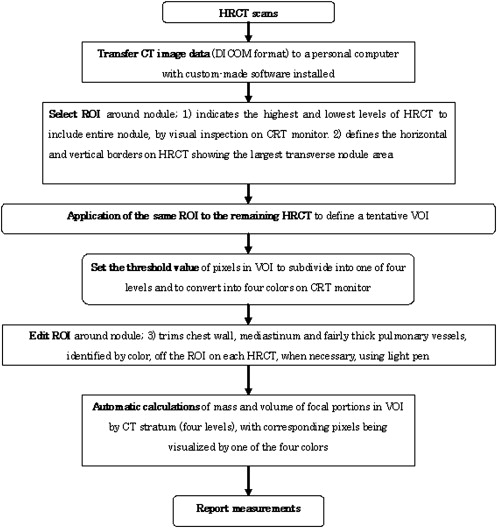
Outline of Software Program
Aim of development of the custom-made software program
Get Radiology Tree app to read full this article<
Volume and weight measurements of lung nodule by stratum of CT levels
Get Radiology Tree app to read full this article<
Get Radiology Tree app to read full this article<
Get Radiology Tree app to read full this article<
Get Radiology Tree app to read full this article<
Manual determination of CT sections containing the nodule
Get Radiology Tree app to read full this article<
Manual definition of ROI (rectangle) on HRCT image and automatic application of ROI (as a tentative one) to the remaining CT sections containing the nodule portion
Get Radiology Tree app to read full this article<
Manual edition of ROI on individual images
Get Radiology Tree app to read full this article<
Automatic volume and weight quantification of portions in ROI by CT stratum
Get Radiology Tree app to read full this article<
Calculation of tumor growth rate (doubling time [DT] of tumor volume and mass)
Get Radiology Tree app to read full this article<
Manual and Digital Measurement of ROIs
Get Radiology Tree app to read full this article<
Statistical Analysis
Get Radiology Tree app to read full this article<
Results
Baseline Measurements of Nodule Volume and Mass on ROIs Manually Defined by the Radiologist
Get Radiology Tree app to read full this article<
Table 1
Reference Standard for Manually Measured Nodule Volumes and Masses in Three Patients (Four High-resolution CT Scans)
Volume (cm 3 ) Mass (g) GGO CDZ Total GGO CDZ Total Case 1 Initial scan (2/24/1997) 2.89 0.33 3.22 0.87 0.23 1.10 Follow-up scan (4/21/1997) 2.63 0.6 3.23 0.84 0.45 1.29 Doubling time (days) −419 66 12,741 −1126 59 161 Case 2 0.71 1.09 1.8 0.25 0.89 1.14 Case 3 1.66 0 1.66 0.48 0 0.48
GGO, ground-glass opacity; CDZ, central denser zone.
Get Radiology Tree app to read full this article<
Get Radiology Tree app to read full this article<
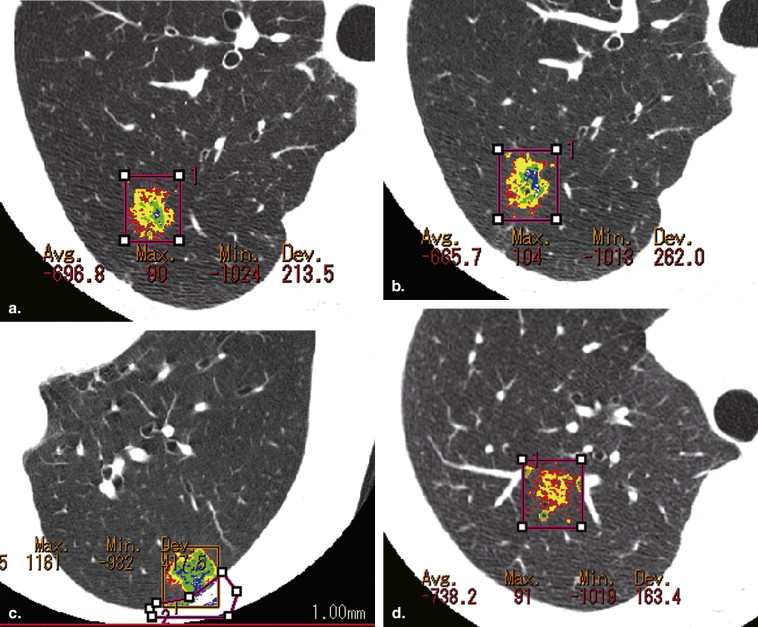
![Figure 2, High-resolution computed tomography of a 69-year-old female, nonsmoker, with adenocarcinomasWBF (with features of bronchioloalveolar cell carcinoma) showing a partly solid (but nearly solid) nodule in the subpleural zone of the left lower lobe. Measurements included transverse tumor diameter of 18 × 13 mm (central denser zone [CDZ], 15 × 13 mm) and average computed tomography value of −327 Hounsfield units (HU) (CDZ, −187 HU).](https://storage.googleapis.com/dl.dentistrykey.com/clinical/PulmonaryNodules/1_1s20S107663321000156X.jpg)
Get Radiology Tree app to read full this article<
Get Radiology Tree app to read full this article<
Get Radiology Tree app to read full this article<
Comparison of Measurements of ROIs Determined Manually and Semiautomatically, with or without Manual Trimming of Small Pulmonary Vessels
Get Radiology Tree app to read full this article<
Table 2
Volume and Mass of the Tumor of Case 1 Measured by the Three Methods on the Initial and Follow-up HRCT Scans
Manual Measurement GGO CDZ Total Volume (cm 3 ) GGO CDZ Total Mass (g) Initial scan (2/24/1997) 2.89 0.33 3.22 0.87 0.23 1.1 Follow-up scan (4/21/1997) 2.63 0.6 3.23 0.84 0.45 1.29 Software Measurement CT values −750 to −651 −650 to −351 −350 to −51 −50 to 50 −750 to −651 −650 to −351 −350 to −51 −50 to 50 Initial scan (2/24/1997) With trimming 0.93 0.91 0.23 0.04 2.11 0.273 0.41 0.184 0.036 0.903 Without trimming 1.12 1.04 0.27 0.04 2.47 0.347 0.492 0.223 0.036 1.098 Follow-up scan (4/21/1997) With trimming 0.88 0.93 0.36 0.13 2.3 0.26 0.421 0.289 0.125 1.095 Without trimming 1.21 1.14 0.43 0.13 2.91 0.358 0.521 0.34 0.128 1.347 Doubling time without trimming (days) 511 430 85 34 241 1,402 665 91 34 193
CT, computed tomography; HRCT, high-resolution CT; GGO, ground-glass opacity; CDZ, central denser zone.
![Figure 6, Plots of differences in mean tumor weight (mass) between the semiautomatically determined regions of interest, with and without trimming the surrounding lung parenchyma off the nodule, for Case 1 at the initial high resolution computed tomography scan; measurements are for focal portions of masses c and d (at computed tomography values ranging from −350 to −51 Hounsfield units [HU] and −50 to 50 HU, respectively).](https://storage.googleapis.com/dl.dentistrykey.com/clinical/PulmonaryNodules/5_1s20S107663321000156X.jpg)
Get Radiology Tree app to read full this article<
Get Radiology Tree app to read full this article<
Get Radiology Tree app to read full this article<
Get Radiology Tree app to read full this article<
Table 3
Volume and Mass of the Tumor of Cases 2 and 3 Measured by the Three Methods on the Last HRCT Scans
Manual Measurement GGO CDZ Total Volume (cm 3 ) GGO CDZ Total Mass (g) Case 2 0.71 1.09 1.8 0.25 0.89 1.14 Case 3 1.66 0 1.66 0.48 0 0.4 Software Measurement CT values −750 to −651 −650 to −351 −350 to −51 −50 to 50 −750 to −651 −650 to −351 −350 to −51 −50 to 50 Case 2 With trimming 0.38 0.51 0.73 0.29 1.92 0.111 0.248 0.607 0.285 1.251 Without trimming 0.47 0.56 0.74 0.29 2.06 0.143 0.272 0.614 0.283 1.312 Case 3 With trimming 0.62 0.41 0.01 0 1.05 0.186 0.174 0.007 0.001 0.368 Without trimming 0.73 0.48 0.07 0.03 1.31 0.22 0.205 0.059 0.024 0.508
CT, computed tomography; HRCT, high-resolution CT; GGO, ground-glass opacity; CDZ, central denser zone.
Get Radiology Tree app to read full this article<
Get Radiology Tree app to read full this article<
Get Radiology Tree app to read full this article<
Table 4
Summary of Weight Measurements of c plus d Portions on Three Patients (Four HRCT Scans)
Total Weight of c Plus d (g) Difference of Total Weight for c Plus d (g) between Without Trim, by Radiologist at First Reading (R1) Without Trim at Second Reading (R2) With Trim (R1) With Trim (R2) With Trim (P) Without Trim (R1-R2) Without-w (R1) With (R1- R2) With (R1- P) Case 1 Initial scan (2/24/1997) 0.259 0.259 0.22 0.218 0.216 0 0.039 0.002 0.004 Follow-up scan (4/21/1997) 0.468 0.459 0.414 0.414 0.426 0.009 0.054 0 0.012 Case 2 0.897 0.839 0.892 0.83 0.864 0.058 0.005 0.062 0.028 Case 3 0.083 0.071 0.008 0.002 0.004 0.012 0.075 0.006 0.004
HRCT, high-resolution computed tomography; R1, first measurement by a radiologist, R2, second measurement by the same radiologist, P, measurement by a pulmonologist.
Get Radiology Tree app to read full this article<
Discussion
Get Radiology Tree app to read full this article<
Get Radiology Tree app to read full this article<
Get Radiology Tree app to read full this article<
Get Radiology Tree app to read full this article<
Get Radiology Tree app to read full this article<
Acknowledgments
Get Radiology Tree app to read full this article<
References
1. Sone S., Matsumoto T., Honda T., et. al.: HRCT features on small peripheral lung cancers detected in a low-dose CT screening program. Acad Radiol 2010; 17: pp. 75-83.
2. Ko J.P., Rusinek H., Jacobs E.L., et. al.: Small pulmonary nodules: volume measurement at chest CT-Phantom study. Radiology 2003; 228: pp. 864-870.
3. Yankelevitz D.F., Reeves A.P., Kostis W.J., et. al.: Small pulmonary nodules: volumetrically determined growth rates based on CT evaluation. Radiology 2000; 217: pp. 251-256.
4. Winer-Muram H.T., Jennings S.G., Tarver R.D., et. al.: Volumetric growth rate of stage I lung cancer prior to treatment: serial CT scanning. Radiology 2002; 223: pp. 798-805.
5. Kostis W.J., Yankelewitz D.T., Reeves A.P., et. al.: Small pulmonary nodules: reproducibility of three-dimensional volumetric measurement and estimation of time to follow-up CT. Radiology 2004; 231: pp. 446-452.
6. Gavrielides M.A., Kinnard L.M., Myers K.J., et. al.: Noncalcified lung nodules: volumetric assessment with thoracic CT. Radiology 2009; 251: pp. 26-37.
7. Ravenel J.G., Leue W.M., Nietert P.J., et. al.: Pulmonary nodule volume: effects of reconstruction parameters on automated measurements—a phantom study. Radiology 2008; 247: pp. 400-408.
8. Aoyama M., Li Q., Katsuragawa S., et. al.: Computerized scheme for determination of the likelihood measure of malignancy for pulmonary nodules on low-dose CT images. Med Phys 2003; 30: pp. 387-394.
9. Kawata Y., Niki N., Ohmatsu H., et. al.: A deformable surface model based on boundary and region information for pulmonary nodule segmentation from 3-D thoracic CT images. IEICE Trans Inf Syst 2003; Vol.E86-D:1921–1930
10. Reeves A.P., Chan A.B., Yankelevitz D.F., et. al.: On measuring the change in size of pulmonary nodules. IEEE Trans Med Imaging 2006; 25: pp. 435-450.
11. Kawata Y., Niki N., Ohmatsu H., et. al.: Quantitative surface characterization of pulmonary nodules based on thin-section CT images. IEEE Trans Nucl Sci 1998; 45: pp. 2132-2138.
12. Kawata Y., Niki N., Ohmatsu H., et. al.: A computerized approach for estimating pulmonary nodule growth rates in three-dimensional thoracic CT images based on CT density histogram. Proc SPIE Med Imaging 2005; 5747: pp. 872-882.
13. Kawata Y., Kawamata A., Niki N., et. al.: Growth pattern classification of pulmonary nodules based on variation of CT number histogram and its potential usefulness in nodule differentiation. Proc SPIE Med Imaging 2009; 7260: 726011–772610
14. Sone S., Nakayama T., Honda T., et. al.: Long-term follow-up study of a population-based 1996–1998 mass screening programme for lung cancer using mobile low-dose spiral computed tomography. Lung Cancer 2007; 58: pp. 329-341.
15. Sone S., Li F., Yang Z.G., et. al.: Results of three-year mass screening programme for lung cancer using mobile low-dose spiral computed tomography scanner. Br J Cancer 2001; 84: pp. 25-32.
16. Hedlund L., Putman C.: Analysis of lung density by computed tomography.Putman C.Pulmonary diagnosis.1981.Appleton-Century CroftsNew York:pp. 107-123.
17. Ko J.K., Betke M., Chest C.T.: Automated nodule detection and assessment of change over time—preliminary experience. Radiology 2001; 218: pp. 267-273.
18. Lindell R.M., Hartman T.E., Swensen S.J., et. al.: Five-year lung cancer screening experience: CT appearance, growth rate, location, and histologic features of 61 lung cancers. Radiology 2007; 242: pp. 555-562.
19. Bland J.M., Altman D.G.: Measuring agreement in method comparison studies. Stat Methods Med Res 1999; 8: pp. 135-160.
20. MedCalc for windows, version 11.0.0 (MedCalc Software, Mariakerke, Belgium).
21. Revel M.P., Bissery A., Bienvenu M., et. al.: Are two-dimensional CT measurements of small noncalcified pulmonary nodules reliable?. Radiology 2004; 231: pp. 453-458.
22. Revel M.P., Lefort C., Bissery A., et. al.: Pulmonary nodules: preliminary experience with three-dimensional evaluation. Radiology 2004; 231: pp. 459-466.