
Rationale and Objectives
We evaluated the accuracy and reproducibility of three-dimensional (3D) measurements of lung phantoms and patient tumors from x-ray computed tomography (CT) and compared these to one-dimensional (1D) and two-dimensional (2D) measurements.
Materials and Methods
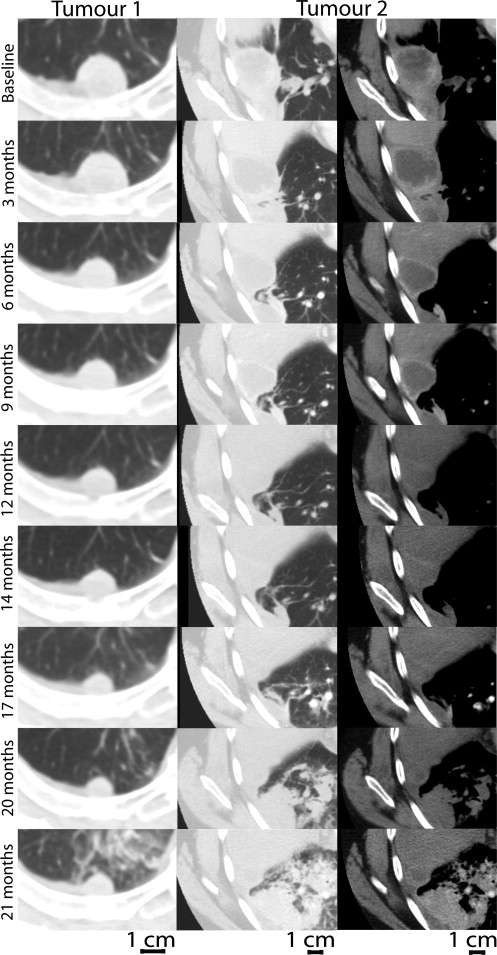
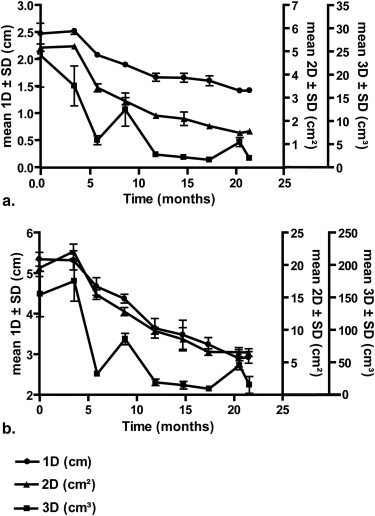
CT images of three spherical and three irregularly shaped tumor phantoms were evaluated by three observers who performed five repeated measurements. Additionally, three observers manually segmented 29 patient lung tumors five times each. Follow-up imaging was performed for 23 tumors and response criteria were compared. For a single subject, imaging was performed on nine occasions over 2 years to evaluate multidimensional tumor response. To evaluate measurement accuracy, we compared imaging measurements to ground truth using analysis of variance. For estimates of precision, intraobserver and interobserver coefficients of variation and intraclass correlations (ICC) were used. Linear regression and Pearson correlations were used to evaluate agreement and tumor response was descriptively compared.
Results
For spherical shaped phantoms, all measurements were highly accurate, but for irregularly shaped phantoms, only 3D measurements were in high agreement with ground truth measurements. All phantom and patient measurements showed high intra- and interobserver reproducibility (ICC >0.900). Over a 2-year period for a single patient, there was disagreement between tumor response classifications based on 3D measurements and those generated using 1D and 2D measurements.
Conclusion
Tumor volume measurements were highly reproducible and accurate for irregular, spherical phantoms and patient tumors with nonuniform dimensions. Response classifications obtained from multidimensional measurements suggest that 3D measurements provide higher sensitivity to tumor response.
Quantitative radiological evaluation of tumor response to therapy using one-dimensional (1D) measurements is still the mainstay of clinical practice, but it is well-understood that in some cases, the responses derived from 1D measurements may not adequately reflect the clinical situation . The two-dimensional (2D) measurement pioneered by the World Health Organization (WHO) is generated as the cross-product of the longest axis of the tumor and its longest perpendicular bisector , whereas the 1D measurement or Response Evaluation Criteria in Solid Tumors method (RECIST) is the length of the longest tumor axis . Both 1D and 2D measurements require the radiologist to first evaluate all image slices and typically, manual measurements are performed. These and other limitations have led to the development of three-dimensional (3D) or volumetric measurements , which in some cases may be considered more representative estimates of the clinical situation .
The effect of tumor shape on measurement accuracy is important, because lesions are seldom perfectly spherical and often have irregular or difficult-to-define margins in which a change in diameter may not accurately reflect overall changes in tumor size . Tumor measurements that incorporate multiple dimensions provide a way to evaluate irregular masses and there is consensus that with the increased dimensions, the precision of the measurements is not compromised . Moreover, it has been suggested that the sensitivity of 3D measurements to therapy response is significantly greater than 1D and 2D measurements . Unfortunately, there is not yet sufficient evidence to qualify lung tumor volume as a biomarker of solid tumor response and to incorporate this into mainstream radiology workflow. In this regard, it is important to consider tumor response over more than two or three individual time points and currently the majority of previous studies have been limited to at most three independent imaging sessions.
Get Radiology Tree app to read full this article<
Materials and methods
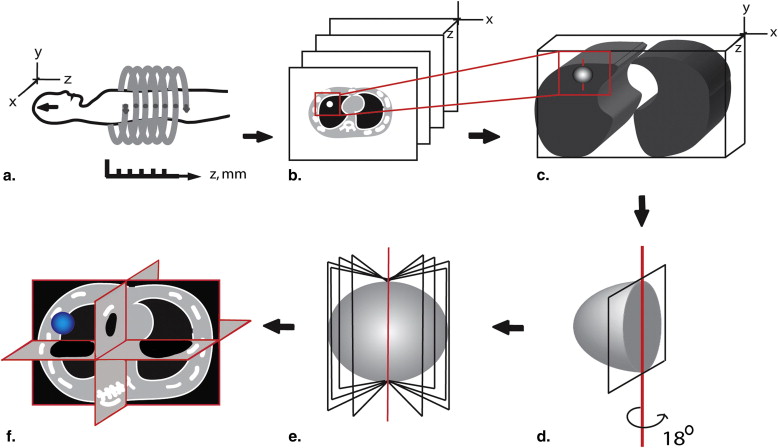
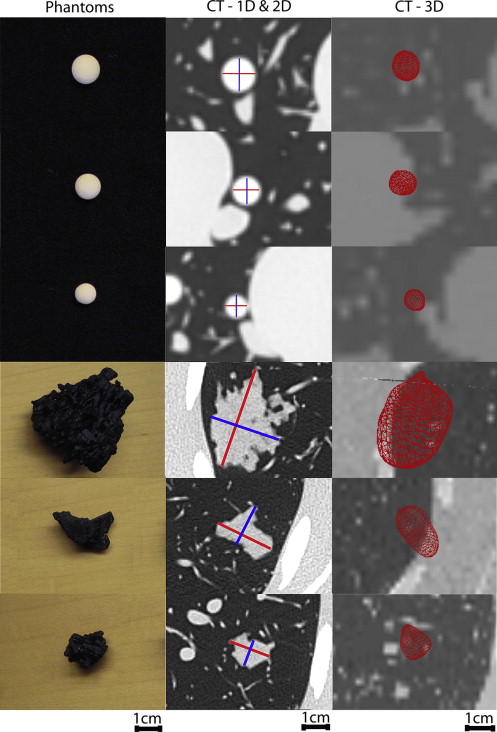
Lung Tumor Phantom Imaging
Get Radiology Tree app to read full this article<
V=16πD3 V
=
1
6
π
D
3
Get Radiology Tree app to read full this article<
Get Radiology Tree app to read full this article<
Study Subject Imaging
Get Radiology Tree app to read full this article<
Image Analysis
Get Radiology Tree app to read full this article<
Table 1
Overview of Analysis Plan
Tumor Phantoms Tumors ( n ) Slice Thicknesses ( n ) Observers ( n ) Measurements per Observer ( n ) 1D 2D 3D 1D 2D 3D Spheres 3 4 3 3 3 60 60 60 Irregular shapes 3 4 3 3 3 60 60 60
Subject Tumors Subjects Cross-sectional analysis 29 7 3 3 3 145 145 145 Longitudinal analysis: 2 time points 23 5 3 3 3 230 230 230 Longitudinal analysis: 9 time points 2 1 3 3 3 90 90 90
1D, one-dimensional; 2D, two-dimensional; 3D, three-dimensional.
Get Radiology Tree app to read full this article<
Get Radiology Tree app to read full this article<
Get Radiology Tree app to read full this article<
Get Radiology Tree app to read full this article<
Statistical Analysis
Get Radiology Tree app to read full this article<
Get Radiology Tree app to read full this article<
Get Radiology Tree app to read full this article<
Results
Phantom Measurements
Get Radiology Tree app to read full this article<
Get Radiology Tree app to read full this article<
Get Radiology Tree app to read full this article<
Table 2
Mean of Measurements at 2.0-mm Slice Thickness of Solid Spherical Tumors and Irregular-shaped Tumors and Ground Truth Measurements
Mean (SD) [COV] Observers 1D (cm) 2D (cm 2 ) 3D (cm 3 ) Spherical phantoms Tumor 1 1 1.20 (0.00) [0] 1.44 (0.00) [0] 0.82 (0.08) [9.4] 2 1.20 (0.00) [0] 1.44 (0.00) [0] 1.00 (0.13) [12.8] 3 1.20 (0.00) [0] 1.42 (0.05) [3.8] 0.89 (0.05) [6.1] Ground truth 1.19 (0.00) [0.4] 1.40 (0.00) [0.6] 0.87 (0.01) [1.2] Interobserver COV 0 0.8 10 Tumor 2 1 1.00 (0.00) [0] 1.00 (0.00) [0] 0.50 (0.06) [9.7] 2 1.00 (0.00) [0] 1.00 (0.00) [0] 0.58 (0.08) [13.6] 3 1.00 (0.00) [0] 1.00 (0.00) [0] 0.53 (0.03) [5.5] Ground truth 0.99 (0.00) [0.2] 0.99 (0.00) [0.4] 0.51 (0.00) [0.5] Interobserver COV 0 0 7.5 Tumor 3 1 0.80 (0.00) [0] 0.64 (0.00) [0] 0.23 (0.02) [10.9] 2 0.80 (0.00) [5.7] 0.61 (0.07) [11] 0.30 (0.05) [16.5] 3 0.80 (0.00) [5.7] 0.55 (0.03) [5.7] 0.27 (0.02) [6.1] Ground truth 0.78 (0.00) [0.5] 0.62 (0.00) [1] 0.25 (0.00) [1.5] Interobserver COV 0 7.6 13.2 Irregular shapes Tumor 4 1 4.20 (0.00) [1.3] 11.54 (0.32) [3.7] 14.69 (0.54) [3] 2 4.01 (0.2) [5.1] 11.87 (0.60) [5] 15.24 (1.34) [8.8] 3 4.16 (0.05) [1.3] 11.57 (0.42) [3.7] 13.71 (0.41) [3] Ground truth 5.16 (0.00) [0] 23.33 (0.03) [0.1] 16.83 (0.02) [0.1] Interobserver COV 1.7 9.4 18.6 Tumor 5 1 2.60 (0.00) [1.7] 4.00 (0.00) [4.5] 2.61 (0.06) [6.3] 2 2.53 (0.02) [0.9] 4.25 (0.18) [4.1] 2.99 (0.25) [8.4] 3 2.58 (0.04) [1.7] 3.97 (0.18) [4.5] 2.48 (0.16) [6.3] Ground truth 3.26 (0.00) [0] 7.38 (0.00) [0.1] 2.66 (0.04) [1.4] Interobserver COV 3.4 5.5 10.3 Tumor 6 1 1.30 (0.00) [0] 1.66 (0.06) [3.5] 1.08 (0.05) [1.8] 2 1.87 (0.03) [1.6] 2.19 (0.08) [3.6] 1.46 (0.15) [10.3] 3 1.30 (0.00) [0] 1.66 (0.06) [3.5] 1.17 (0.14) [12.3] Ground truth 2.11 (0.00) [0] 3.42 (0.00) [0.1] 1.21 (0.03) [2.4] Interobserver COV 16.9 18.6 29.9
1D, one-dimensional; 2D, two-dimensional; 3D, three-dimensional; COV, coefficient of variance; SD, standard deviation.
Intra- and interobserver COV is expressed in %.
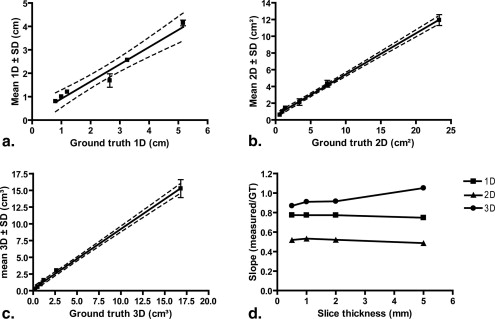
Table 3
Intraclass Correlation Coefficients for 1D, 2D, and 3D Measurements of Spherical and Irregular-shaped Tumor Phantoms and Patient Tumors
Observer 1D 2D 3D ICC (A) ICC (C) ICC (A) ICC (C) ICC (A) ICC (C) Spherical phantoms 1 1.000 1.000 1.000 1.000 0.967 0.963 2 0.985 0.985 0.991 0.991 0.937 0.986 3 0.985 0.985 0.993 0.996 0.986 0.990 All observers 0.999 0.999 0.995 0.996 0.965 0.990 Irregular shapes 1 0.988 0.988 0.995 0.995 0.989 0.991 2 1.000 1.000 0.991 0.995 0.996 0.996 3 0.999 0.999 0.997 0.998 0.999 0.999 All observers 0.973 0.971 0.994 1.000 0.982 0.993 Patient tumors 1 0.992 0.994 0.994 0.994 0.966 0.969 2 0.978 0.982 0.989 0.991 0.992 0.993 3 0.970 0.973 0.938 0.953 0.970 0.974 All observers 0.949 0.949 0.976 0.975 0.985 0.987
1D, one-dimensional; 2D, two-dimensional; 3D, three-dimensional; ICC, intraclass correlation coefficients.
Get Radiology Tree app to read full this article<
Patient Lung Tumor Measurements
Get Radiology Tree app to read full this article<
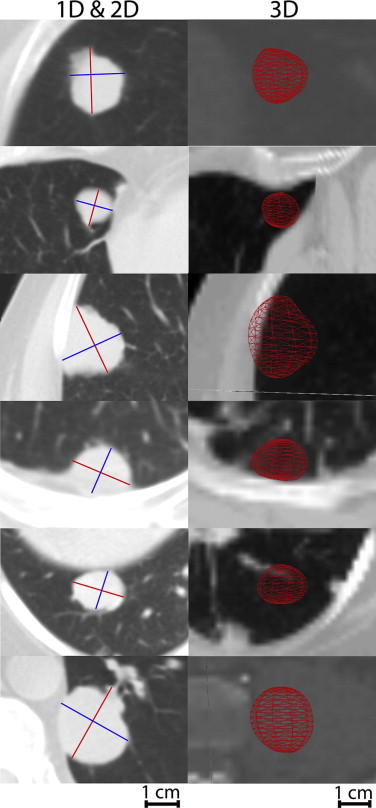
Table 4
Mean of 1D, 2D, and 3D Measurements Total Tumor Burden For Each Subject
Mean (SD) [COV] Observers 1D (cm) 2D (cm 2 ) 3D (cm 3 ) Subject 1 1 1.70 (0.20) [10.9) 2.54 (0.50) [19.65] 3.49 (0.46) [13.1] 2 1.70 (0.10) [7.7] 2.72 (0.30) [11] 3.84 (0.66) [17.2] 3 1.60 (0.00) [0.0] 2.18 (0.09) [4] 3.27 (0.14) [4.4] Interobserver COV 6.3 11.9 11.9 Subject 2 1 6.80 (0.20) [2.8] 20.14 (0.71) [3.6] 38.69 (4.47) [11.6] 2 6.70 (0.40) [5.4) 20.42 (1.69) [8.3] 38.30 (2.35) [6.1] 3 6.50 (0.20) [2.6] 20.50 (0.84) [4.1] 37.60 (4.22) [11.2] Interobserver COV 3.6 5.3 9.6 Subject 3 1 14.70 (0.20) [1.4] 42.12 (1.18) [2.8] 96.70 (7.56) [7.8] 2 14.50 (0.30) [1.9] 41.90 (1.28) [3.1] 85.02 (6.49) [7.6] 3 14.70 (0.30) [2.2] 42.70 (1.12) [2.6] 79.17 (10.25) [13] Interobserver COV 1.8 2.8 9.3 Subject 4 1 3.80 (0.10) [2.2] 6.30 (0.40) [6.4] 9.19 (1.27) [13.8] 2 3.70 (0.20) [4.1] 6.05 (0.63) [10.5] 8.26 (1.21) [14.6] 3 3.80 (0.20) [5.9] 6.39 (0.35) [5.4] 7.03 (0.96) [13.6] Interobserver COV 4.1 7.4 14 Subject 5 1 5.00 (0.10) [3] 6.14 (0.35) [5.7] 9.71 (0.96) [9.9] 2 4.60 (0.30) [5.8] 5.40 (0.49) [9.2] 6.94 (1.03) [14.8] 3 4.50 (0.30) [6.1] 5.54 (0.45) [8.1] 5.96 (0.82) [13.7] Interobserver COV 4.9 7.6 12.4 Subject 6 1 20.50 (0.10) [0.3] 32.74 (0.61) [1.9] 37.42 (2.43) [6.5] 2 19.90 (1.00) [5.2] 30.66 (2.63) [8.6] 45.21 (4.37) [9.7] 3 19.60 (0.50) [2.7] 30.11 (1.27) [4.2] 37.91 (4.61) [12.2] Interobserver COV 2.7 4.8 9.5 Subject 7 1 8.50 (0.10) [1] 11.96 (0.35) [2.9] 40.40 (10.82) [26.8] 2 8.00 (0.30) [3.9] 10.60 (0.77) [7.3] 38.93 (8.76) [22.5] 3 7.60 (0.10) [0.7] 9.81 (0.24) [2.5] 39.60 (1.30) [3.3] Interobserver COV 1.9 4.2 17.6
1D, one-dimensional; 2D, two-dimensional; 3D, three-dimensional; COV, coefficient of variance; SD, standard deviation.
Intra- and inter-observer COV is expressed in %.
Get Radiology Tree app to read full this article<
Get Radiology Tree app to read full this article<
Table 5
Mean Tumor Burden ± Standard Deviation for 1D, 2D, and Volumetric Measurements
Subject No. No. of Tumors Baseline Mean Tumor Burden (±Standard Deviation) Follow-up Mean Tumor Burden (±Standard Deviation) Fractional Change (%) Response Classification 1D (cm) 1 2 6.84 ± 0.06 6.52 ± 0.04 −4.68 SD 2 5 14.8 ± 0.03 13.66 ± 0.04 −7.7 SD 3 2 3.86 ± 0.06 4.50 ± 0.05 16.58 SD 4 3 4.52 ± 0.04 5.34 ± 0.04 18.14 SD 5 11 20.34 ± 0.02 19.98 ± 0.05 −1.77 SD 2D (cm 2 ) 1 2 20.33 ± 0.46 19.16 ± 0.41 −5.76 SD 2 5 43.32 ± 0.15 36.68 ± 0.23 −15.33 SD 3 2 6.56 ± 0.16 8.17 ± 0.19 24.56 SD 4 3 5.53 ± 0.06 7.01 ± 0.08 26.76 PD 5 11 31.88 ± 0.05 26.18 ± 0.33 −17.88 SD 3D (cm 3 ) 1 2 38.26 ± 0.80 39.99 ± 1.11 4.52 SD 2 5 84.98 ± 1.20 77.91 ± 0.73 −8.32 SD 3 2 7.67 ± 0.87 8.72 ± 0.40 13.69 SD 4 3 6.30 ± 0.51 8.50 ± 0.29 34.92 SD 5 11 40.4 ± 0.23 40.79 ± 0.22 0.97 SD
1D, one-dimensional; 2D, two-dimensional; 3D, three-dimensional; PD, progressive disease; SD, stable disease.
Performed by a single observer at baseline and follow-up scan along with fractional change (%) and corresponding response classifications for each subject.
Get Radiology Tree app to read full this article<
Get Radiology Tree app to read full this article<
Get Radiology Tree app to read full this article<
Discussion
Get Radiology Tree app to read full this article<
Table 6
Previous Studies Related to the Quantification of Lung Tumor Growth or Response
1D 2D 3D Slice Thicknesses (mm) Phantom Spherical Phantom Irregular Patient 1 Time Point Patient Multiple Time Points Prionas et al, 2010 ND ND Yes 0.625 1.25 2.50 5.0 Yes ND ND ND Sohns et al, 2010 Yes Yes Yes 0.625 ND ND ND baseline + 1 follow-up Ravenel et al, 2008 ND ND Yes 0.625 1.25 Yes ND ND ND Schwartz et al, 2006 Yes Yes ND ND ND ND ND Baseline + avg. 3.1 follow-ups Petrou et al, 2006 ND ND Yes 1.25 2.50 5.0 ND ND Yes ND Zhao et al, 2006 Yes Yes Yes 1.25 ND ND ND Baseline + 1 follow-up Revel et al, 2004 ND Yes ND 1.25 2.50 ND ND Yes ND Tran et al, 2004 Yes Yes Yes 3 ND ND ND Baseline + 2 follow-ups Erasmus et al, 2003 Yes Yes ND 7 ND ND ND Baseline + 1 follow-up
Get Radiology Tree app to read full this article<
Get Radiology Tree app to read full this article<
Get Radiology Tree app to read full this article<
Get Radiology Tree app to read full this article<
Get Radiology Tree app to read full this article<
Get Radiology Tree app to read full this article<
Get Radiology Tree app to read full this article<
Acknowledgments
Get Radiology Tree app to read full this article<
Get Radiology Tree app to read full this article<
References
1. Schwartz L.H., Colville J.A., Ginsberg M.S., et. al.: Measuring tumor response and shape change on CT: esophageal cancer as a paradigm. Ann Oncol 2006; 17: pp. 1018-1023.
2. Dempsey M.F., Condon B.R., Hadley D.M.: Measurement of tumor “size” in recurrent malignant glioma: 1D, 2D, or 3D?. AJNR Am J Neuroradiol 2005; 26: pp. 770-776.
3. World Health Organization: WHO Handbook for reporting results of cancer treatment : WHO offset publication no. 48.1979.World Health OrganizationGeneva, Switzerland
4. Miller A.B., Hoogstraten B., Staquet M., et. al.: Reporting results of cancer treatment. Cancer 1981; 47: pp. 207-214.
5. Therasse P., Arbuck S.G., Eisenhauer E.A., et. al.: New guidelines to evaluate the response to treatment in solid tumors. European Organization for Research and Treatment of Cancer, National Cancer Institute of the United States, National Cancer Institute of Canada. J Natl Cancer Inst 2000; 92: pp. 205-216.
6. Belton A.L., Saini S., Liebermann K., et. al.: Tumor size measurement in an oncology clinical trial: comparison between off-site and on-site measurements. Clin Radiol 2003; 58: pp. 311-314.
7. Lavin P.T., Flowerdew G.: Studies in variation associated with the measurement of solid tumors. Cancer 1980; 46: pp. 1286-1290.
8. Mozley P.D., Schwartz L.H., Bendtsen C., et. al.: Change in lung tumor volume as a biomarker of treatment response: a critical review of the evidence. Ann Oncol 2010; 21: pp. 1751-1755.
9. Revel M.P., Bissery A., Bienvenu M., et. al.: Are two-dimensional CT measurements of small noncalcified pulmonary nodules reliable?. Radiology 2004; 231: pp. 453-458.
10. Thiesse P., Ollivier L., Di Stefano-Louineau D., et. al.: Response rate accuracy in oncology trials: reasons for interobserver variability. Groupe Francais d’Immunotherapie of the Federation Nationale des Centres de Lutte Contre le Cancer. J Clin Oncol 1997; 15: pp. 3507-3514.
11. Mantatzis M., Kakolyris S., Amarantidis K., et. al.: Treatment response classification of liver metastatic disease evaluated on imaging. Are RECIST unidimensional measurements accurate?. Eur Radiol 2009; 19: pp. 1809-1816.
12. Ravenel J.G., Leue W.M., Nietert P.J., et. al.: Pulmonary nodule volume: effects of reconstruction parameters on automated measurements—a phantom study. Radiology 2008; 247: pp. 400-408.
13. Sohaib S.A., Turner B., Hanson J.A., et. al.: CT assessment of tumour response to treatment: comparison of linear, cross-sectional and volumetric measures of tumour size. Br J Radiol 2000; 73: pp. 1178-1184.
14. Zhao B., Schwartz L.H., Moskowitz C.S., et. al.: Lung cancer: computerized quantification of tumor response—initial results. Radiology 2006; 241: pp. 892-898.
15. Shah G.D., Kesari S., Xu R., et. al.: Comparison of linear and volumetric criteria in assessing tumor response in adult high-grade gliomas. Neuro Oncol 2006; 8: pp. 38-46.
16. Tran L.N., Brown M.S., Goldin J.G., et. al.: Comparison of treatment response classifications between unidimensional, bidimensional, and volumetric measurements of metastatic lung lesions on chest computed tomography. Acad Radiol 2004; 11: pp. 1355-1360.
17. Buckler A.J., Mulshine J.L., Gottlieb R., et. al.: The use of volumetric CT as an imaging biomarker in lung cancer. Acad Radiol 2010; 17: pp. 100-106.
18. Yankelevitz D.F., Reeves A.P., Kostis W.J., et. al.: Small pulmonary nodules: volumetrically determined growth rates based on CT evaluation. Radiology 2000; 217: pp. 251-256.
19. Goodman L.R., Gulsun M., Washington L., et. al.: Inherent variability of CT lung nodule measurements in vivo using semiautomated volumetric measurements. AJR Am J Roentgenol 2006; 186: pp. 989-994.
20. Sohns C., Mangelsdorf J., Sossalla S., et. al.: Measurement of response of pulmonal tumors in 64-slice MDCT. Acta Radiol 2010; 51: pp. 512-521.
21. Prionas N.D., Ray S., Boone J.M.: Volume assessment accuracy in computed tomography: a phantom study. J Appl Clin Med Phys 2010; 11: pp. 3037.
22. Erasmus J.J., Gladish G.W., Broemeling L., et. al.: Interobserver and intraobserver variability in measurement of non-small-cell carcinoma lung lesions: implications for assessment of tumor response. J Clin Oncol 2003; 21: pp. 2574-2582.
23. Landry A., Spence J.D., Fenster A.: Quantification of carotid plaque volume measurements using 3D ultrasound imaging. Ultrasound Med Biol 2005; 31: pp. 751-762.
24. Petrou M., Quint L.E., Nan B., et. al.: Pulmonary nodule volumetric measurement variability as a function of CT slice thickness and nodule morphology. AJR Am J Roentgenol 2007; 188: pp. 306-312.
25. Winer-Muram H.T., Jennings S.G., Meyer C.A., et. al.: Effect of varying CT section width on volumetric measurement of lung tumors and application of compensatory equations. Radiology 2003; 229: pp. 184-194.
26. Hopper K.D., Kasales C.J., Van Slyke M.A., et. al.: Analysis of interobserver and intraobserver variability in CT tumor measurements. AJR Am J Roentgenol 1996; 167: pp. 851-854.