
Rationale and Objectives
The main aim of this study was to evaluate the clinical validity and correlation with pathologic invasiveness in the pulmonary adenocarcinoma spectrum based on the novel qualitative computed tomography criterion for subsolid nodule (SSN) classification, which classified SSN into pure ground-glass nodule, heterogeneous ground-glass nodule, and part-solid nodule. In addition, we compared the performance of the conventional and novel classifications.
Materials and Methods
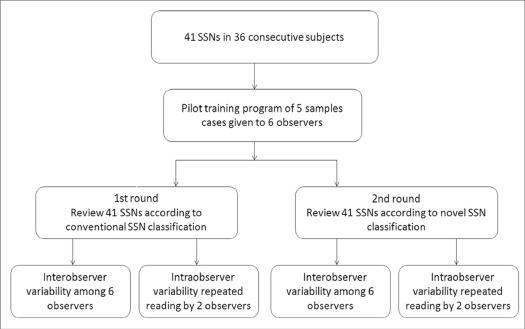
The computed tomography images of 41 SSN nodules were interpreted by six observers independently, and the SSN characteristics were classified according to both the conventional and the novel classification systems. Each observer assessed 41 nodules in two different classifications separated by a minimum of 8 weeks. The kappa ( κ ) coefficient test was used to determine the reliability. The correlation between pulmonary adenocarcinoma spectrum and the SSN classification was analyzed with Spearman correlation coefficients.
Results
Interobserver agreement ( κ ) was 0.702 (range 0.42–0.89) and 0.707 (range 0.58–0.88) for the conventional and the novel classifications for SSN, respectively, and intraobserver agreement ( κ ) was 0.92 and 0.88 for the conventional and the novel classifications for SSN, respectively. The novel SSN classification (correlation coefficient range 0.622–0.732) is more strongly correlated with the pathologic invasiveness degree of lesions in adenocarcinoma spectrum than the conventional SSN classification (correlation coefficient range 0.458–0.644).
Conclusions
The agreement between observers on the novel SSN classification system was good and had better correlation with pathologic invasiveness than the conventional SSN classification. Further studies are needed to confirm these results on interobserver agreement.
Introduction
Pulmonary subsolid nodules (SSNs) have emerged as important aspects of the lung adenocarcinoma spectrum following the introduction of low-dose computed tomography (LDCT) for lung cancer screening over the past few years . SSNs may be further classified as either pure ground-glass nodules (GGNs) or part-solid nodules (PSNs) according to the convention classification proposed by the Fleischner Society . An accurate and objective assessment of the SSN classification system is necessary before it can be reliably used in a clinical setting. The inconsistency in differentiating between GGN and PSN may affect surveillance recommendations and prognostic determination, which would lead to different management strategies and follow-up periods . Previous studies have reported a low to moderate interobserver agreement for classifying solid nodules, PSNs, and GGNs on LDCT scans . Ridge et al has found that a moderate interobsever agreement for differentiating subsolid from solid nodules . However, limited studies have investigated interobsever agreement for differentiating GGNs from PSNs .
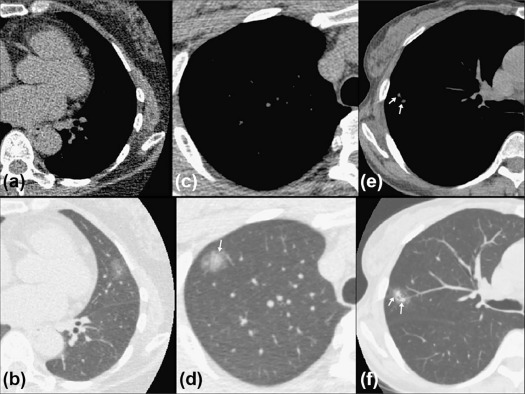
In the present study, a novel classification algorithm based on qualitative computed tomography (CT) criterion proposed by Kakinuma et al divided SSNs into pure GGN, heterogeneous GGNs (partly consolidated on lung windows), and PSNs (with a mediastinal window solid component) . Previous studies have investigated the clinical prognostic importance and natural course of SSNs based on the novel classification . However, this classification has not yet been well validated for interobserver and intraobserver agreement.
Get Radiology Tree app to read full this article<
Materials and Methods
Get Radiology Tree app to read full this article<
Nodule Selection and Evaluation
Get Radiology Tree app to read full this article<
Get Radiology Tree app to read full this article<
Get Radiology Tree app to read full this article<
Get Radiology Tree app to read full this article<
Get Radiology Tree app to read full this article<
Get Radiology Tree app to read full this article<
Get Radiology Tree app to read full this article<
Get Radiology Tree app to read full this article<
Get Radiology Tree app to read full this article<
Pathologic Evaluation and Report
Get Radiology Tree app to read full this article<
Statistical Analysis
Get Radiology Tree app to read full this article<
Get Radiology Tree app to read full this article<
Results
Characteristics in Subjects
Get Radiology Tree app to read full this article<
TABLE 1
Demographics of the 41 Nodules in 36 Subjects
Characteristics N (%) or Mean (±SD) Subjects ( n = 36) Age 57.31 (11.5) Sex Female 25 (69.4) Male 11 (30.6) Lesion multiplicity Solitary 27 (75.0) Multiple 9 (25.0) Nodules ( n = 41) Nodule size 15.15 (6.93) Pathology distribution AAH 3 (7.3) AIS 10 (24.4) MIA 7 (17.1) IPA 21 (51.2)
AAH, atypical adenomatous hyperplasia; AIS, adenocarcinoma in situ; IPA, invasive pulmonary adenocarcinoma; MIA, minimally invasive adenocarcinoma; SD, standard deviation.
Get Radiology Tree app to read full this article<
Interobserver and Intraobserver Agreement
Get Radiology Tree app to read full this article<
TABLE 2
Interobserver Agreement Between Each of Six Observers for the Conventional and Novel Subsolid Nodule Classifications
Observer Conventional Classification Novel Classification 1–2 0.733 0.795 1–3 0.892 0.878 1–4 0.892 0.620 1–5 0.534 0.691 1–6 0.892 0.688 2–3 0.733 0.757 2–4 0.733 0.620 2–5 0.491 0.652 2–6 0.627 0.726 3–4 0.892 0.584 3–5 0.418 0.731 3–6 0.892 0.729 4–5 0.418 0.700 4–6 0.783 0.699 5–6 0.534 0.769 Range 0.418–0.892 0.584–0.878 Fleiss kappa 0.702 0.707
Get Radiology Tree app to read full this article<
Correlation to Pathologic Result
Get Radiology Tree app to read full this article<
Get Radiology Tree app to read full this article<
TABLE 3
The Correlation Coefficient Between Pathologic Invasiveness and the Conventional and the Novel Subsolid Nodule Classifications
Observer Conventional Classification Novel Classification Experienced thoracic radiologist 1 0.595 0.719 2 0.644 0.650 Radiology residents 3 0.525 0.648 4 0.458 0.732 Physician 5 0.558 0.677 6 0.555 0.622
Get Radiology Tree app to read full this article<
Get Radiology Tree app to read full this article<
Get Radiology Tree app to read full this article<
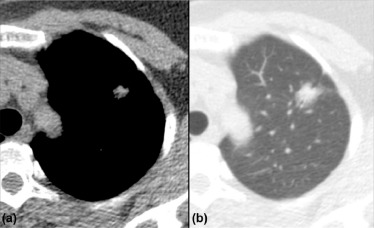
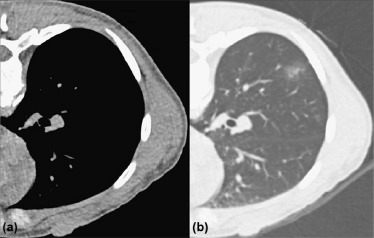
TABLE 4
Contingency Table for Number of Observers in Identical Classification on the Novel Subsolid Nodule Classification Versus the Pathologic Result
Observers in Identical Classification (N) Pathology AAH AIS MIA IPA All Pure GGN 1 8 1 1 11 3 0 1 0 0 1 4 0 0 0 0 0 5 1 1 0 0 2 6 0 6 1 1 8 Heterogeneous GGN 2 2 4 2 10 3 0 0 1 1 2 4 1 1 1 1 4 5 0 0 1 0 1 6 1 1 1 0 3 Part-solid nodule 0 0 2 18 20 3 0 0 0 1 1 4 0 0 1 1 2 5 0 0 1 1 2 6 0 0 0 15 15
AAH, atypical adenomatous hyperplasia; AIS, adenocarcinoma in situ; GGN, ground-glass nodule; IPA, invasive pulmonary adenocarcinoma; MIA, minimally invasive adenocarcinoma.
Get Radiology Tree app to read full this article<
Discussion
Get Radiology Tree app to read full this article<
Get Radiology Tree app to read full this article<
Get Radiology Tree app to read full this article<
Get Radiology Tree app to read full this article<
Get Radiology Tree app to read full this article<
Get Radiology Tree app to read full this article<
Get Radiology Tree app to read full this article<
Get Radiology Tree app to read full this article<
References
1. Austin J.H.M., Garg K., Aberle D., et. al.: Radiologic implications of the 2011 classification of adenocarcinoma of the lung. Radiology 2013; 266: pp. 62-71.
2. Henschke C.I., Yankelevitz D.F., Mirtcheva R., et. al.: CT screening for lung cancer. Am J Roentgenol 2002; 178: pp. 1053-1057.
3. Kim H.Y., Shim Y.M., Lee K.S., et. al.: Persistent pulmonary nodular ground-glass opacity at thin-section CT: histopathologic comparisons. Radiology 2007; 245: pp. 267-275.
4. Wu F.-Z., Huang Y.-L., Wu C.C., et. al.: Assessment of selection criteria for low-dose lung screening CT among Asian Ethnic Groups in Taiwan: from mass screening to specific risk-based screening for non-smoker lung cancer. Clin Lung Cancer 2016; 17: pp. e45-e56.
5. Lin K.-F., Wu H.-F., Huang W.-C., et. al.: Propensity score analysis of lung cancer risk in a population with high prevalence of non-smoking related lung cancer. BMC Pulm Med 2017; 17: pp. 120.
6. Naidich D.P., Bankier A.A., MacMahon H., et. al.: Recommendations for the management of subsolid pulmonary nodules detected at CT: a statement from the Fleischner Society. Radiology 2013; 266: pp. 304-317.
7. van Riel S.J., Sánchez C.I., Bankier A.A., et. al.: Observer variability for classification of pulmonary nodules on low-dose CT images and its effect on nodule management. Radiology 2015; 277: pp. 863-871.
8. Ridge C.A., Yildirim A., Boiselle P.M., et. al.: Differentiating between subsolid and solid pulmonary nodules at CT: inter- and intraobserver agreement between experienced thoracic radiologists. Radiology 2015; 278: pp. 888-896.
9. MacMahon H., Naidich D.P., Goo J.M., et. al.: Guidelines for management of incidental pulmonary nodules detected on CT images: from the Fleischner Society. Radiology 2017; 2017: pp. 161659.
10. Jacobs C., van Rikxoort E.M., Scholten E.T., et. al.: Solid, part-solid, or non-solid? Classification of pulmonary nodules in low-dose chest computed tomography by a computer-aided diagnosis system. Invest Radiol 2015; 50: pp. 168-173.
11. Penn A., Ma M., Chou B.B., et. al.: Inter-reader variability when applying the 2013 Fleischner guidelines for potential solitary subsolid lung nodules. Acta Radiol 2015; 56: pp. 1180-1186.
12. Lee S.M., Park C.M., Goo J.M., et. al.: Invasive pulmonary adenocarcinomas versus preinvasive lesions appearing as ground-glass nodules: differentiation by using CT features. Radiology 2013; 268: pp. 265-273.
13. Revel M.-P., Mannes I., Benzakoun J., et. al.: Subsolid lung nodule classification: a CT criterion for improving interobserver agreement. Radiology 2017; 286: pp. 316-325.
14. Kakinuma R., Noguchi M., Ashizawa K., et. al.: Natural history of pulmonary subsolid nodules: a prospective multicenter study. J Thorac Oncol 2016; 11: pp. 1012-1028.
15. Detterbeck F.C.: Achieving clarity about lung cancer and opacities. Chest 2017; 151: pp. 252-254.
16. Wu F.-Z., Chen P.-A., Wu C.C., et. al.: Semiquantitative visual assessment of sub-solid pulmonary nodules ≦3 cm in differentiation of lung adenocarcinoma spectrum. Sci Rep 2017; 7: pp. 15790.
17. Lee K.H., Goo J.M., Park S.J., et. al.: Correlation between the size of the solid component on thin-section CT and the invasive component on pathology in small lung adenocarcinomas manifesting as ground-glass nodules. J Thorac Oncol 2014; 9: pp. 74-82.
18. Travis W.D., Brambilla E., Noguchi M., et. al.: International Association for the Study of Lung Cancer/American Thoracic Society/European Respiratory Society International Multidisciplinary Classification of Lung Adenocarcinoma. J Thorac Oncol 2011; 6: pp. 244-285.
19. Kim H., Park C.M., Song Y.S., et. al.: Measurement variability of persistent pulmonary subsolid nodules on same-day repeat CT: what is the threshold to determine true nodule growth during follow-up?. PLoS ONE 2016; 11: e0148853
20. Yoo R.-E., Goo J.M., Hwang E.J., et. al.: Retrospective assessment of interobserver agreement and accuracy in classifications and measurements in subsolid nodules with solid components less than 8 mm: which window setting is better?. Eur Radiol 2017; 27: pp. 1369-1376.
21. Sawada S., Yamashita N., Sugimoto R., et. al.: Long-term outcomes of patients with ground-glass opacities detected using CT scanning. Chest 2017; 151: pp. 308-315.
22. Scholten E.T., de Jong P.A., Jacobs C., et. al.: Interscan variation of semi-automated volumetry of subsolid pulmonary nodules. Eur Radiol 2015; 25: pp. 1040-1047.
23. Ruchalski K.L., Brown K.: Lung cancer screening update. J Thorac Imaging 2016; 31: pp. 190-200.
24. Fintelmann F.J., Bernheim A., Digumarthy S.R., et. al.: The 10 pillars of lung cancer screening: rationale and logistics of a lung cancer screening program. Radiographics 2015; 35: pp. 1893-1908.
25. Kazerooni E.A., Austin J.H.M., Black W.C., et. al.: ACR–STR practice parameter for the performance and reporting of lung cancer screening thoracic computed tomography (CT): 2014 (resolution 4)*. J Thorac Imaging 2014; 29: pp. 310-316.
26. Lung cancer screening resources : American College of Radiology. Available at: http://www.acr.org/Quality-Safety/Resources/Lung-Imaging-Resources