
Objectives
Epicardial adipose tissue (EAT) is an important structure both as an active secretor of hormones and cytokines that play a role in the development of atherosclerosis, as well as its potential as a cardiac risk marker. The purpose of this article was to determine an easy but accurate quantification of EAT for routine clinical use.
Methods and Results
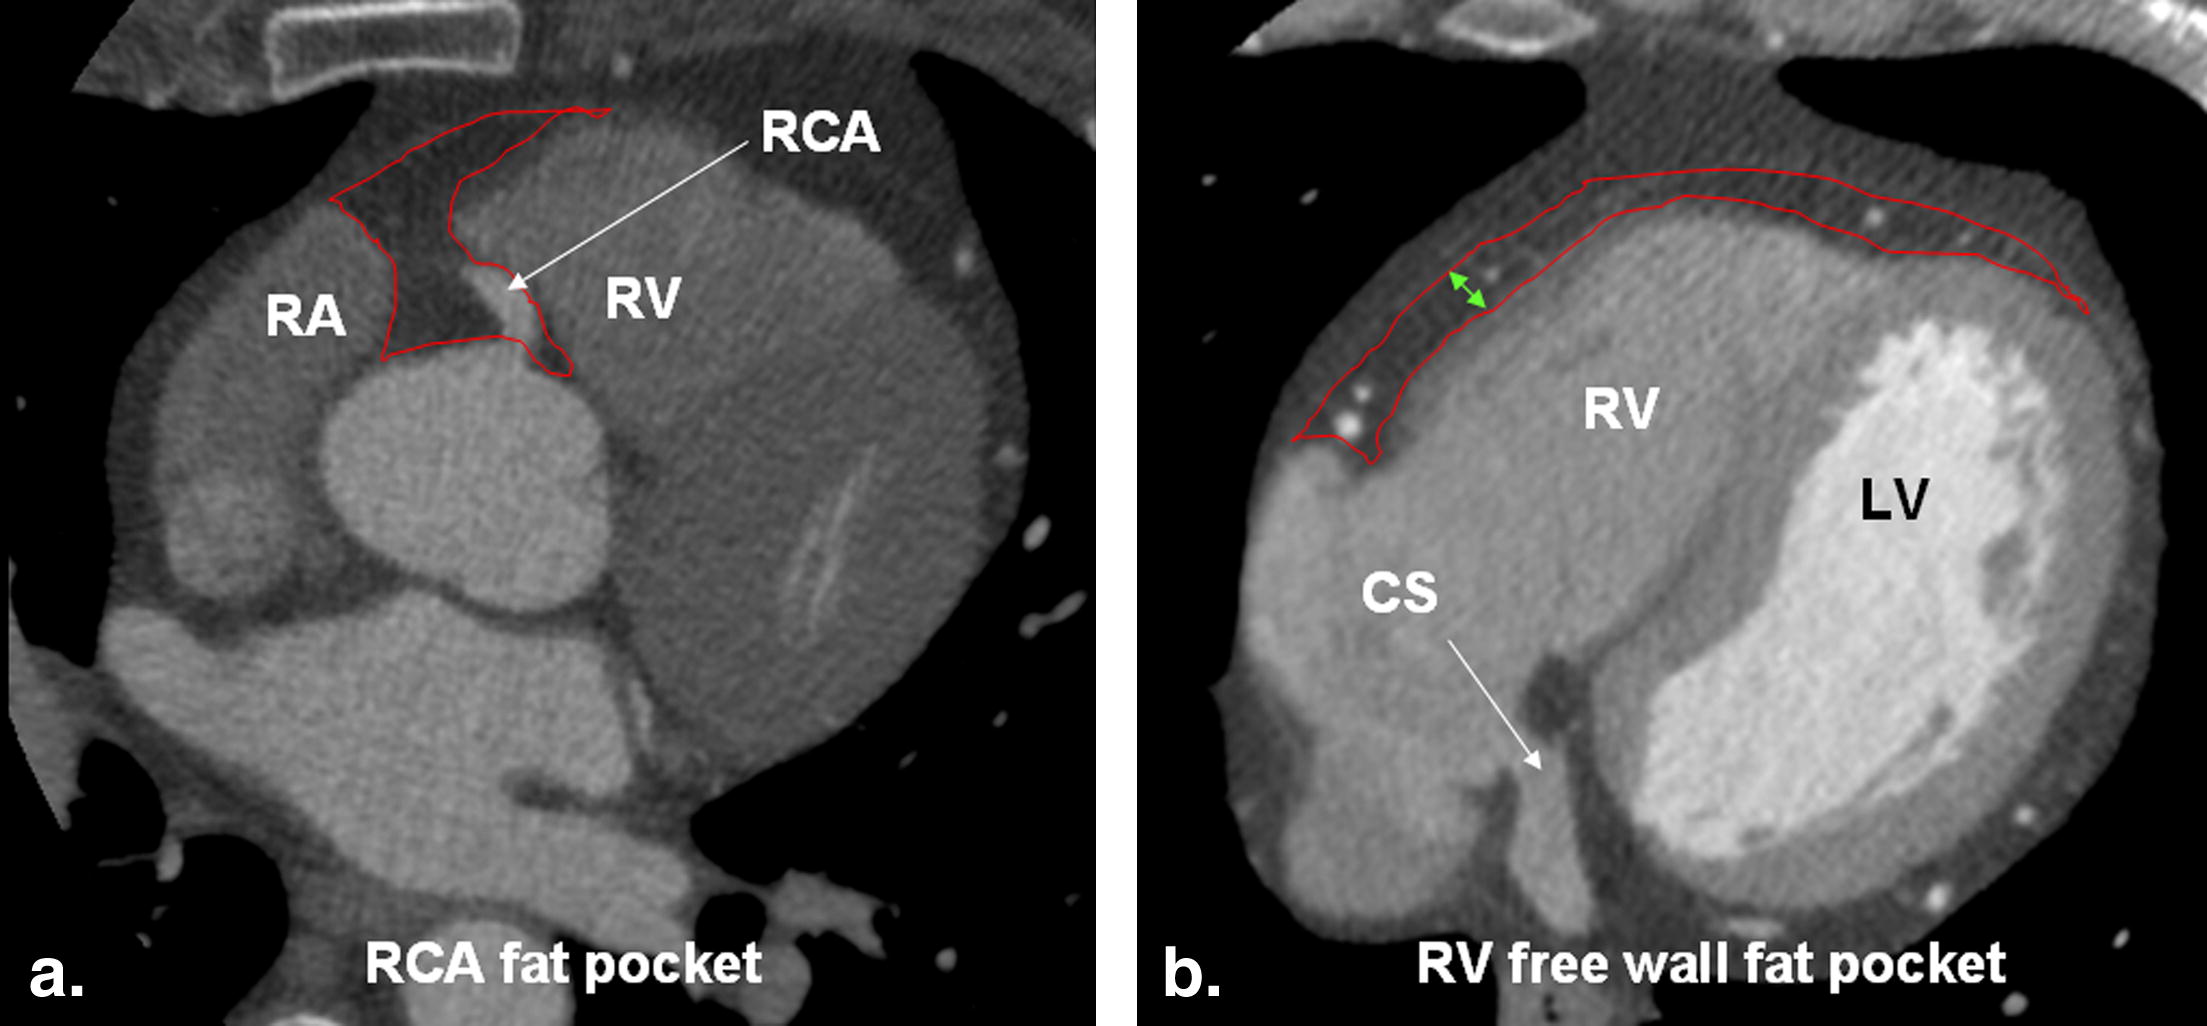
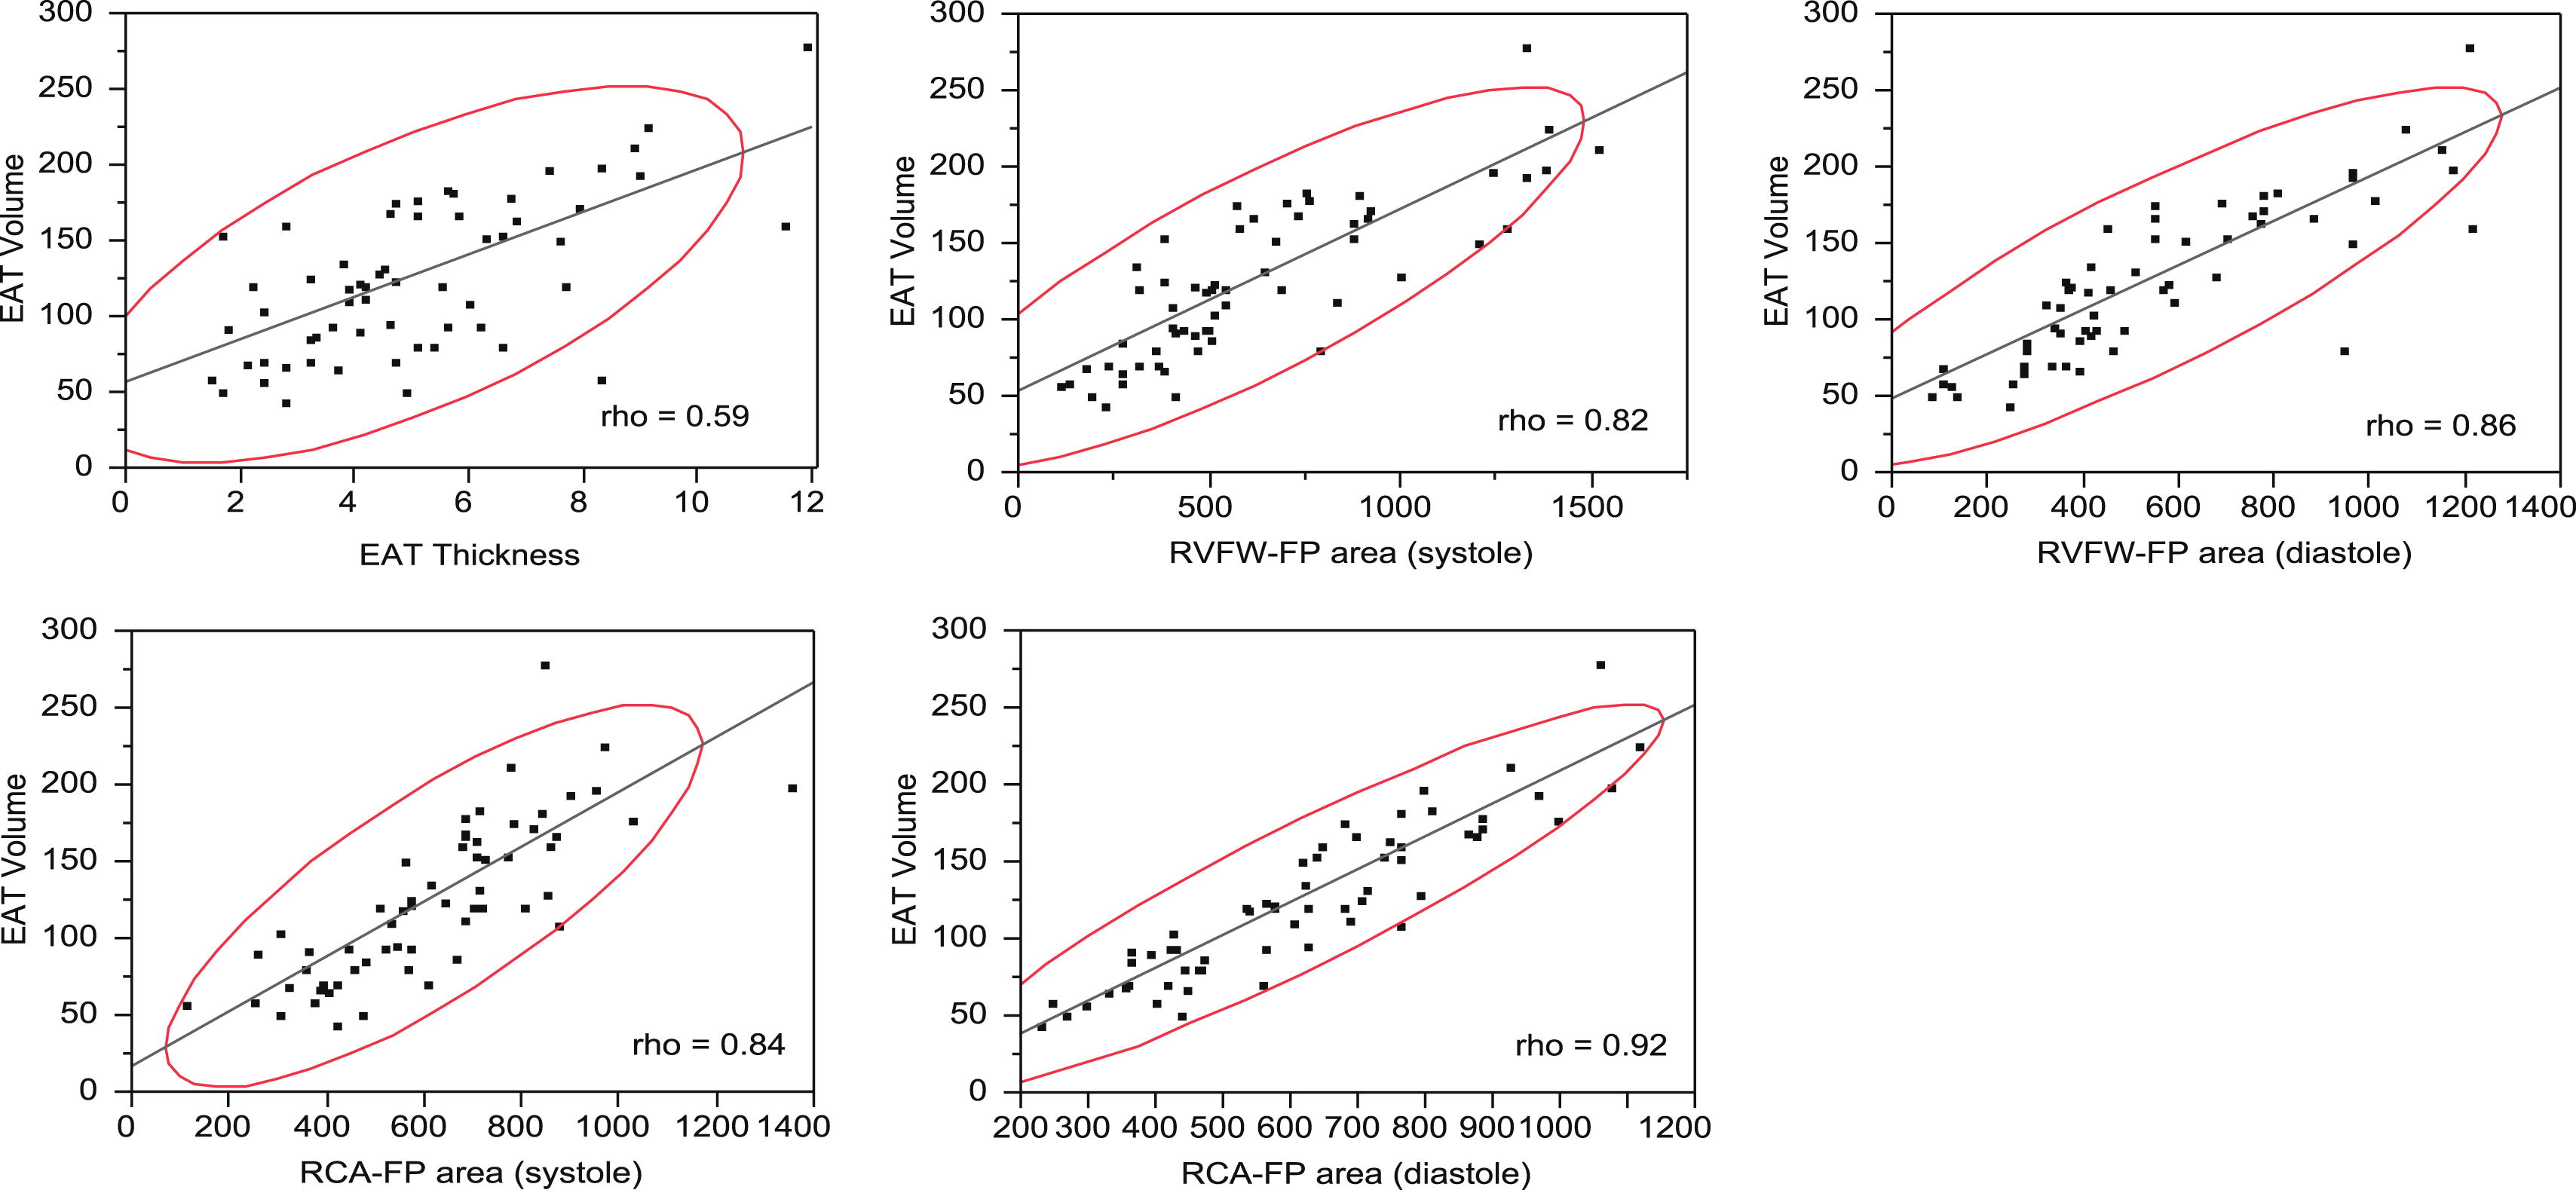
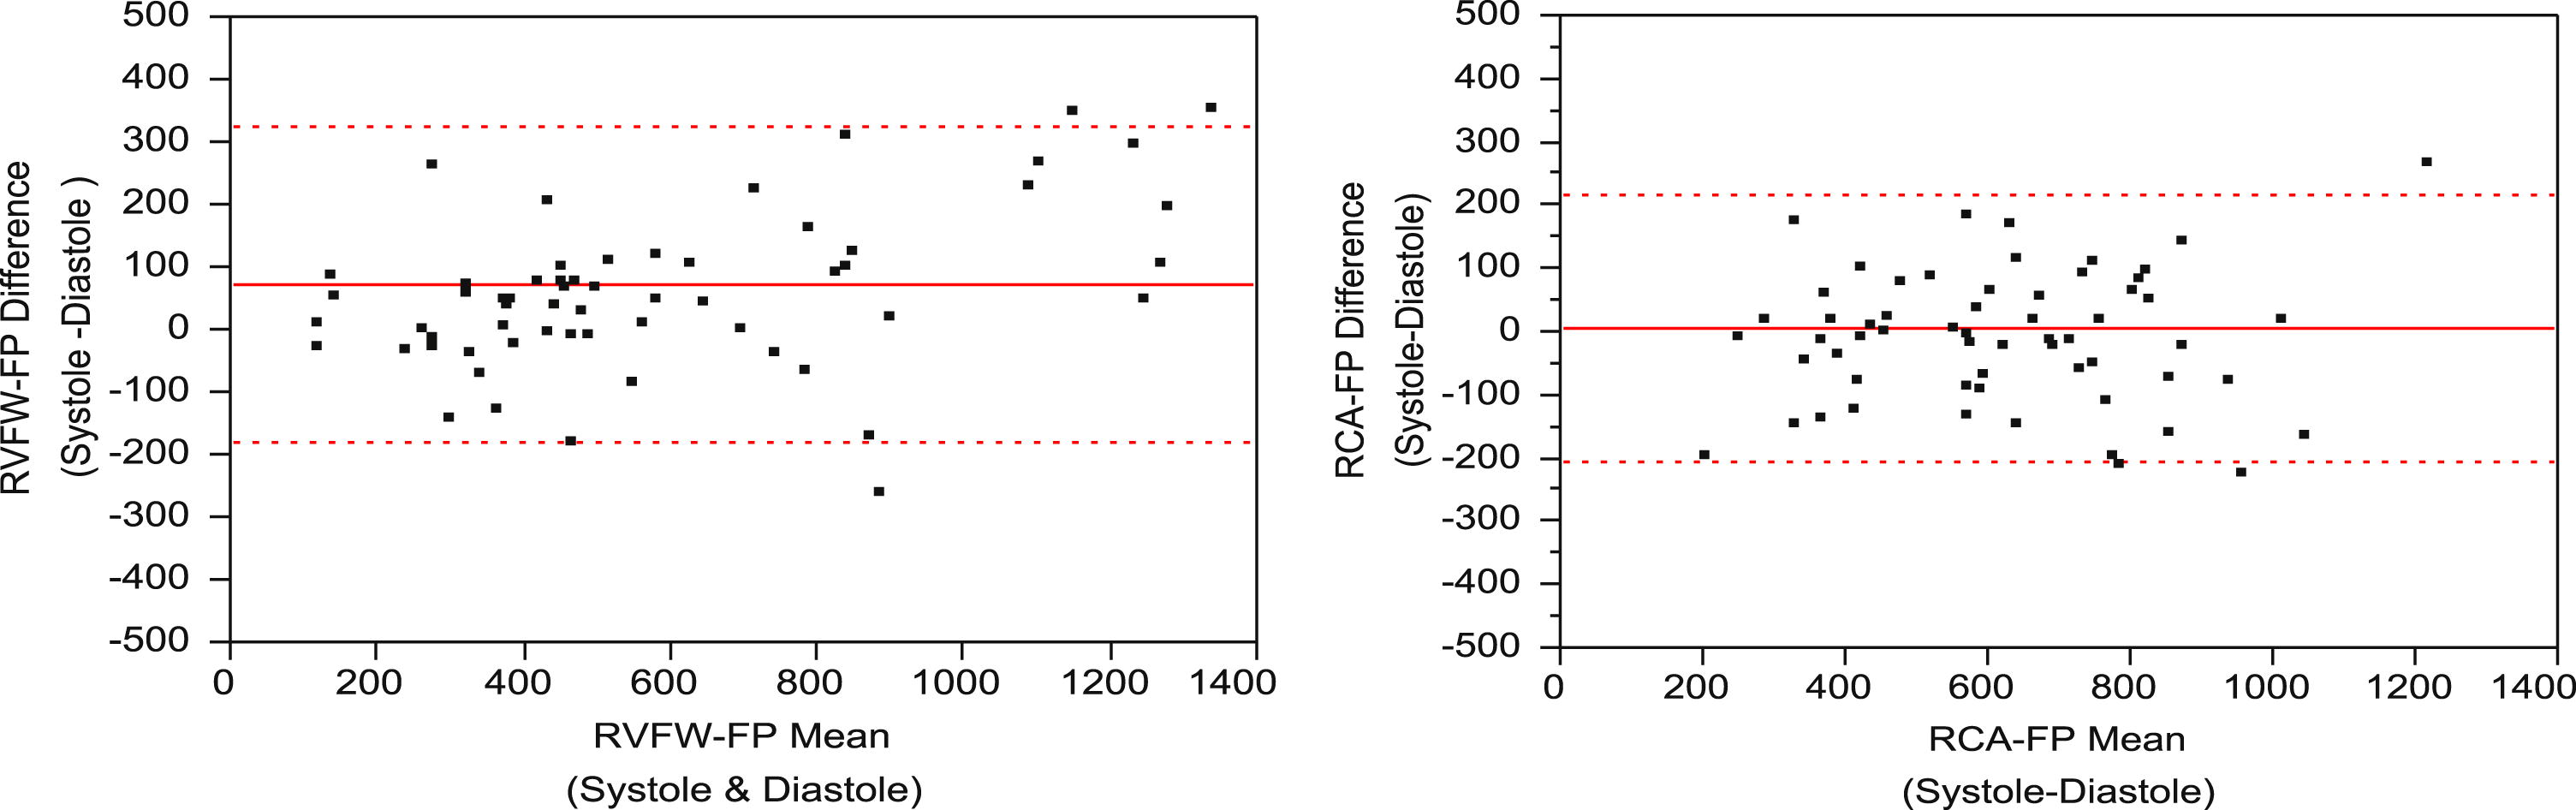
We randomly selected coronary computed tomography angiographies of 60 patients (20 lean, 20 overweight, and 20 obese) derived from a larger study. Systolic and diastolic surface areas (SAs) were measured at two axial levels: a) fat pocket (FP) between right atrium and right ventricular outflow tract at origin of right coronary artery (RCA-FP) and b) FP anterior to right ventricular free wall (RVFW-FP) at coronary sinus ostium level. Maximum RVFW-FP thickness and total diastolic EAT volume were measured. EAT SA and thickness measurements were correlated to EAT volume and compared. Both interobserver and intraobserver reliability were assessed for SA and thickness with the intraclass correlation coefficient (ICC) as well as mean relative difference ± standard deviation (SD). Differences between systolic and diastolic SA measurements were also evaluated. Diastolic RCA-FP showed the highest SA correlation with volume (ρ = 0.92) and compared to the correlation of EAT thickness with volume (ρ=0.59) demonstrated the largest difference in correlation (+ 0.33, P < .0001). Systolic RCA-FP, systolic RVFW-FP, and diastolic RVFW-FP correlations to volume were less than diastolic RCA-FP (ρ = 0.84, ρ = 0.82, ρ = 0.86 respectively), but all correlations were statistically significantly higher than EAT thickness with volume. Values of systolic SA were mildly higher than diastolic SA for the RCA-FP (relative difference ± SD = 1.8 ± 21%, P = .8), but significantly higher for the RVFW-FP (relative difference ± SD = 17 ± 35%, P < .0001). Both systolic and diastolic SA measurements showed excellent reproducibility (ICC >0.95). However, for EAT thickness, the inter-observer reliability was comparatively low (ICC = 0.66).
Conclusion
Diastolic RCA-FP SA is a quick, reproducible estimate of total EAT and compared to EAT thickness demonstrates a significantly better correlation with EAT volume.
There has been growing interest in the role of epicardial adipose tissue (EAT) in recent years, both as an active secretor of hormones and cytokines which play a role in the development of atherosclerosis, as well as its potential as a cardiac risk marker . Previous studies have shown a significant association between the amount of EAT and the incidence of obesity-related insulin resistance and coronary atherosclerosis . Moreover, because of a significant direct relationship between epicardial fat and visceral fat , EAT thickness has been suggested to be used as a therapeutic marker . Accordingly, serial measurements of EAT can potentially serve as a means to evaluate the effectiveness of pharmacological, physical, and surgical therapies specifically designed to target visceral adipose tissue .
Precise measurement of EAT, however, remains a challenge. To date, several imaging modalities, including echocardiography , magnetic resonance imaging (MRI) , and computed tomography (CT) , have been applied in attempts to quantify EAT. Assessment of EAT by echocardiography is limited to measurement of EAT thickness over the right ventricular free wall (RVFW). Consequently, contradictory results have been reported by various investigators, most likely attributable to the impracticality of standardizing the angle of the transducer and location of the measurements . Volumetric measurements using CT and MRI are largely accomplished by manually tracing fat in slices of a given thickness and then adding up the individual volume measurements . Unless fully automated, this method is obviously cumbersome and time-consuming, thereby precluding widespread clinical use.
Linear measurement of EAT thickness anterior to the RV is rather simple. However, this measurement has not been shown to be strongly correlated with EAT volume in linear regression models . It also measures the adipose tissue anterior to the RV, which is not the primary site of EAT deposition . Anatomic studies suggest that the atrioventricular and interventricular grooves, particularly over the RV free wall, are the most frequent location for fat accumulation . Given this fact, we hypothesized that the areas of fat pockets in these regions would likely correlate better to EAT volume compared with a simple linear measurement of EAT thickness. As a result of this method’s simplicity and speed in quantifying EAT, it can potentially be included in routine cardiac CT interpretation and follow-up studies for metabolic risk stratification of patients. To test our hypothesis, we correlated surface area (SA) measurements of two specific anatomic regions that, according to the literature, are most likely representative of total EAT and compared with EAT volume using multislice CT (MDCT): 1) fat surrounding the right coronary artery origin (RCA fat pocket, RCA-FP) and 2) pocket of fat anterior to the right ventricle free wall extending to the apex (RV free wall fat pocket, RVFW-FP).
Material and methods
Patient Selection
Get Radiology Tree app to read full this article<
Get Radiology Tree app to read full this article<
Get Radiology Tree app to read full this article<
Institutional Review Board Approval
Get Radiology Tree app to read full this article<
CT Scan Parameters and Image Interpretation
Get Radiology Tree app to read full this article<
Get Radiology Tree app to read full this article<
Get Radiology Tree app to read full this article<
Get Radiology Tree app to read full this article<
Get Radiology Tree app to read full this article<
Get Radiology Tree app to read full this article<
Get Radiology Tree app to read full this article<
Get Radiology Tree app to read full this article<
Results
Patient Characteristics
Get Radiology Tree app to read full this article<
Table 1
Patient Characteristics of the Study Population (n = 60)
Lean Overweight Fat Total Sex (male/female) 8/12 2/18 11/9 21/39 Age (y) 61 ± 13 61 ± 2 56 ± 9 59 ± 11 Body mass index 21 ± 2.3 27.4 ± 1.6 35 ± 6.0 28 ± 7.0
Data are mean values ± standard deviation.
Get Radiology Tree app to read full this article<
Epicardial Fat Volume and SA Measurement, Correlations and Reproducibility
Get Radiology Tree app to read full this article<
Table 2
Distribution of Measures for all Subjects and BMI Categories
Measurement All cases BMI Mean ± SD Median (Range) Category Mean ± SD Median (Range) RCA-FP (systole) (mm 2 ) 620 ± 225 627 (110–1353) Lean 462 ± 190 432 (110–966) Overweight 658 ± 161 683 (375–1027) Obese 740 ± 228 744 (250–1353) RCA-FP (diastole) (mm 2 ) 617 ± 219 619 (230–1116) Lean 477 ± 213 423 (230–1116) Overweight 680 ± 179 662 (399–995) Obese 693 ± 202 695 (246–1075) RVFW-FP (systole) (mm 2 ) 618 ± 353 507 (109–1518) Lean 450 ± 287 410 (109–1385) Overweight 618 ± 296 592 (130–1518) Obese 787 ± 397 757 (232–1381) RVFW-FP (diastole) (mm 2 ) 548 ± 297 457 (84–1214) Lean 390 ± 250 345 (84–1075) Overweight 583 ± 266 528 (104–1149) Obese 670 ± 313 586 (251–1214) EAT thickness (mm) 5.1 ± 2 4.7 (1.5–11.9) Lean 4.2 ± 2.0 3.9 (1.7–9.1) Overweight 4.8 ± 1.8 4.7 (1.5–8.9) Obese 6.2 ± 2.8 5.9 (1.7–11.9) EAT volume (cm3) 127 ± 51 123 (47–281) Lean 97 ± 46 91 (47–228) Overweight 141 ± 42 146 (61–215) Obese 144 ± 51 130 (61–281)
RCA-FP, right coronary fat pocket; RVFW-FP, right ventricle free wall fat pocket; EAT, epicardial fat.
Get Radiology Tree app to read full this article<
Get Radiology Tree app to read full this article<
Table 3
Correlations of SA and EAT Thickness to Volume with Comparison Tests
Correlations to Eat Volume Correlation Comparison to Eat Thickness (All Subjects) BMI Categories All Subjects Difference to EAT Thickness Steiger Z-score_P_ < Z (2-sided) Lean Overweight Obese EAT thickness (mm) 0.53 ∗ 0.63 ∗ 0.51 ∗ 0.59 † — — — RVFW-FP area (systole) (mm 2 ) 0.82 † 0.66 ∗ 0.82 † 0.82 † 0.232 3.615 <.001 RVFW-FP area (diastole) (mm 2 ) 0.88 † 0.7 † 0.88 † 0.86 † 0.269 4.53 <.0001 RCA-FP area (systole) (mm 2 ) 0.56 ∗ 0.81 † 0.69 † 0.84 † 0.251 3.544 <.001 RCA FP area (diastole) (mm 2 ) 0.80 † 0.93 † 0.80 † 0.92 † 0.33 5.842 <.0001
RCA-FP, right coronary fat pocket; RVFW-FP, right ventricle free wall fat pocket; EAT, epicardial fat.
Get Radiology Tree app to read full this article<
Get Radiology Tree app to read full this article<
Get Radiology Tree app to read full this article<
Get Radiology Tree app to read full this article<
Get Radiology Tree app to read full this article<
Get Radiology Tree app to read full this article<
Get Radiology Tree app to read full this article<
Get Radiology Tree app to read full this article<
Table 4
Inter-observer and intra-observer variability for area and thickness measurements
Measurement Inter-observer Reliability Intra-observer Reliability Rel Diff ± SD (%) ICC ∗ ICC 95% CI Rel Diff ± SD (%) ICC ∗ ICC 95% CI RCA-FP area (systole) (mm 2 ) 1.1 ± 9.2 0.97 (0.96–0.98) 0.6 ± 6 0.99 (0.98–0.99) RCA FP area (diastole) (mm 2 ) 0.1 ± 6.6 0.97 (0.97–0.99) 1.9 ± 6 0.98 (0.97–0.99) RVFW-FP area (systole) (mm 2 ) 3.0 ± 18.0 0.96 (0.94–0.98) −1.0 ± 8 0.98 (0.98–0.99) RVFW-FP area (diastole) (mm 2 ) 2.4 ± 11.7 0.97 (0.95–0.98) −0.5 ± 6 0.98 (0.98–0.99) EAT thickness (diastole) (mm) −12.7 ± 36 0.66 (0.49–0.78) 0.4 ± 21 0.92 (0.87–0.95)
RCA-FP, right coronary fat pocket; RVFW-FP, right ventricle free wall fat pocket; rel diff ± SD%, relative difference ± standard deviation; ICC, intra-class correlation coefficient; CI, confidence interval.
Get Radiology Tree app to read full this article<
Get Radiology Tree app to read full this article<
Discussion
Get Radiology Tree app to read full this article<
Get Radiology Tree app to read full this article<
Get Radiology Tree app to read full this article<
Get Radiology Tree app to read full this article<
Get Radiology Tree app to read full this article<
Get Radiology Tree app to read full this article<
Get Radiology Tree app to read full this article<
Limitations
Get Radiology Tree app to read full this article<
Conclusion
Get Radiology Tree app to read full this article<
References
1. Iacobellis G., Corradi D., Sharma A.M.: Epicardial adipose tissue: anatomic, biomolecular and clinical relationships with the heart. Nat Clin Pract Cardiovasc Med 2005; 2: pp. 536-543.
2. Rabkin S.W.: Epicardial fat: properties, function and relationship to obesity. Obesity Rev 2007; 8: pp. 253-261.
3. Djaberi R., Schuijf J.D., Van Werkhovena J.M., et. al.: Relation of epicardial adipose tissue to coronary atherosclerosis. Am J Cardiol 2008; 102: pp. 1602-1607.
4. Shimabukuro M.: Cardiac adiposity and global cardiometabolic risk - New concept and clinical implication. Circ J 2009; 73: pp. 27-34.
5. Iacobellis G., Barbaro G., Gerstein H.C.: Relationship of epicardial fat thickness and fasting glucose. Int J Cardiol 2008; 128: pp. 424-426.
6. Iacobellis G., Leonetti F.: Epicardial adipose tissue and insulin resistance in obese subjects. J Clin Endocrinol Metab 2005; 90: pp. 6300-6302.
7. Ding J., Hsu F.C., Harris T.B., et. al.: The association of pericardial fat with incident coronary heart disease: the Multi-Ethnic Study of Atherosclerosis (MESA). Am J Clin Nutr 2009; 90: pp. 499-504.
8. Jeong J.W., Jeong M.H., Yun K.H., et. al.: Echocardiographic epicardial fat thickness and coronary artery disease. Circ J 2007; 71: pp. 536-539.
9. Iacobellis G., Pellicelli A.M., Grisorio B., et. al.: Relation of epicardial fat and alanine aminotransferase in subjects with increased visceral fat. Obesity 2008; 16: pp. 179-183.
10. Singh N., Singh H., Khanijoun H.K., et. al.: Echocardiographic assessment of epicardial adipose tissue - a marker of visceral adiposity. MJM 2007; 10: pp. 26-30.
11. Kim M.K., Tomita T., Kim M.J., et. al.: Aerobic exercise training reduces epicardial fat in obese men. J Appl Physiol 2009; 106: pp. 5-11.
12. Iacobellis G., Singh N., Wharton S., et. al.: Substantial changes in epicardial fat thickness after weight loss in severely obese subjects. Obesity 2008; 16: pp. 1693-1697.
13. Willens H.J., Byers P., Chirinos J.A., et. al.: Effects of weight loss after bariatric surgery on epicardial fat measured using echocardiography. Am J Cardiol 2007; 99: pp. 1242-1245.
14. Iacobellis G., Assael F., Ribaudo M.C.: Epicardial fat from echocardiography: a new method for visceral adipose tissue prediction. Obes Res 2003; 11: pp. 304-310.
15. Iacobellis G., Ribaudo M.C., Assael F.: Echocardiographic epicardial adipose tissue is related to anthropometric and clinical parameters of metabolic syndrome: a new indicator of cardiovascular risk. J Clin Endocrinol Metab 2003; 88: pp. 5163-5168.
16. Ahn S.G., Lim H.S., Joe D.Y., et. al.: Relationship of epicardial adipose tissue by echocardiography to coronary artery disease. Heart 2008; 94: pp. e7. 17
17. Chaowalit N., Somers V.K., Pellikka P.A., et. al.: Subepicardial adipose tissue and the presence and severity of coronary artery disease. Atherosclerosis 2006; 186: pp. 354-359.
18. Flüchter S., Haghi D., Dinter D., et. al.: Volumetric assessment of epicardial adipose tissue with cardiovascular magnetic resonance imaging. Obesity (Silver Spring) 2007; 15: pp. 870-878.
19. Gorter P.M., van Lindert A.S.R., de Vos A.M., et. al.: Quantification of epicardial and peri-coronary fat using cardiac computed tomography; reproducibility and relation with obesity and metabolic syndrome in patients suspected of coronary artery disease. Atherosclerosis 2008; 197: pp. 896-903.
20. Abbara S., Desai J.C., Cury R.C., et. al.: Mapping epicardial fat with multi-detector computed tomography to facilitate percutaneous transepicardial arrhythmia ablation. Eur J Radiol 2006; 57: pp. 417-422.
21. Sacks H.S., Fain J.N.: Human epicardial adipose tissue: a review. Am Heart J 2007; 153: pp. 907-917.
22. Willliams P.L.: The anatomical basis of medicine and surgery. Gray’s Anatomy.38th ed.1995.Churchill LivingstonePhiladelphia, PA
23. Schejbal V.: Epicardial fatty tissue of the right ventricle—morphology, morphometry and functional significance. Pneumologie 1989; 43: pp. 490-499.
24. Saremi F., Channual S., Krishnan S., et. al.: Bachmann bundle and its arterial supply: imaging with multidetector CT - implications for interatrial conduction abnormalities and arrhythmias. Radiology 2008; 248: pp. 447-457.
25. Agatston A.S., Janowitz W.R., Hildner F.J., et. al.: Quantification of coronary artery calcium using ultrafast computed tomography. J Am Coll Cardiol 1990; 15: pp. 827-832.
26. Yoshizumi T., Nakamura T., Yamane M., et. al.: Abdominal fat: standardized technique for measurement at CT. Radiology 1999; 211: pp. 283-286.
27. Baumgartner R.N., Heymsfield S.B., Roche A.F., et. al.: Abdominal composition quantified by computed tomography. Am J Clin Nutr 1988; 48: pp. 936-945.
28. Steiger J.H.: Tests for comparing elements of a correlation matrix. Psychol Bull 1980; 87: pp. 245-251.
29. Bland J.M., Altman D.G.: Statistical methods for assessing agreement between two methods of clinical measurement. Lancet 1986; 1: pp. 307-310.