
Rationale and Objectives
To evaluate, in a group of candidates for liver donation, the role of unenhanced computed tomography (CT) and magnetic resonance (MR) as noninvasive means to measure hepatic steatosis (HS).
Materials and Methods
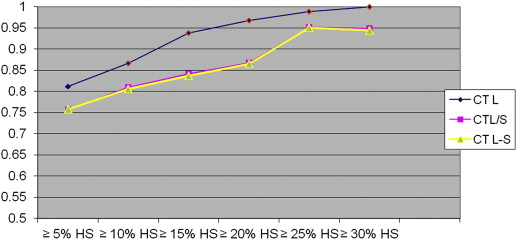
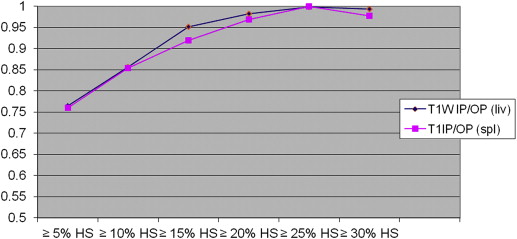
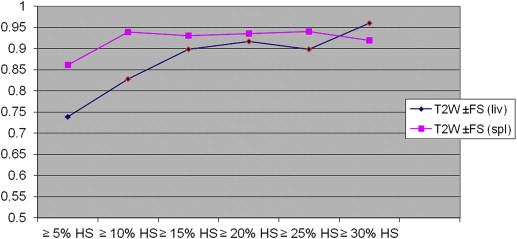
Sixty-one consecutive candidates underwent CT and MR evaluation for liver donation within 3 weeks of liver biopsy. On CT, three methods of HS quantification were evaluated: the measurement of hepatic attenuation (CT L), the ratio of hepatic attenuation to splenic attenuation (CT L/S), and the difference between the hepatic and splenic attenuation (CT L-S). On MR, HS was reported in terms of fat signal fraction (FSF) using in-phase/opposed-phase and fat/non-fat- saturated images, with and without normalization with the spleen (T1W IP/OP FSF, T1W IP/OP FSF spleen and T2W±FS FSF, TW2±FS FSF spleen). The accuracy of each imaging index in the diagnosis of HS, according to various thresholds, was assessed using receiver operating characteristic analysis.
Results
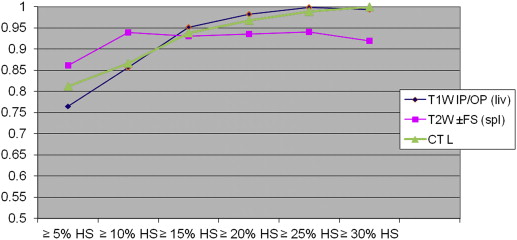
On biopsy, 35 donors showed no significant HS (<5%); the remaining 26 showed HS ranging from 5% to 40%. With all CT and MR indices, there was a trend toward increasing diagnostic accuracy as the threshold levels of HS increased. When comparing all the indices, TW2±FS FSF(spl) showed higher accuracy at threshold levels of 5% and 10% of steatosis but without reaching statistical significance.
Conclusions
In candidates for living donation, MR and CT indices are similar in estimating liver-fat content; however, MR with T2W±FS FSF(spl) sequences shows higher accuracy when low threshold levels of steatosis (≤5% and ≤10% HS) are selected.
Assessment of hepatic steatosis (HS) is a key point in living liver donor selection because excessive liver fat can affect postoperative outcome for both the donor and the recipient . Although liver biopsy (LB) remains the reference standard for grading HS, it is not routinely performed because it is an invasive procedure with several limitations, including sampling errors . Computed tomography (CT) and magnetic resonance (MR) have been separately evaluated for their ability to detect and quantify hepatic fat in potential living liver donors with MR emerging as the technique of choice for noninvasive accurate estimation of HS . However, imaging techniques, including measuring methods and reference tests, differed among studies and few articles evaluated both CT and MR within the same population while using histopathology as a reference . There has also been a paucity of studies investigating the role of (T2) fat-saturation techniques in potential liver donors . The aim of our study was to compare the accuracy of different imaging biomarkers derived from unenhanced CT and MR with both opposed-phase T1-weighted and fat-saturated T2-weighted sequences for the quantitative estimation of hepatic fat content in a selected population of potential living liver donors.
Materials and methods
Study Population
Our institutional review board approved this retrospective study and waived the need for informed consent, although written informed consent was obtained for every procedure from all subjects. Between July 2004 and July 2010, 61 consecutive candidates, who underwent CT and MR evaluation protocol for liver donation within 3 weeks of LB, were identified in the radiology information system and pathology database at a single transplant center. All potential living liver donors undergo an extensive stepwise evaluation protocol, including CT for liver volumetry and depiction of the hepatic vascular system, and MR cholangiography for assessment of the biliary anatomy. Donors who are not excluded because of an unfavorable hepatic parenchymal, vascular, or biliary morphology advance to the biopsy phase. LB is performed not only to quantify liver fat but also to detect other clinically and serologically unsuspected donor diseases that might potentially affect recovery of the donor and recipient after surgery .
Imaging Techniques
CT examination
Get Radiology Tree app to read full this article<
MR Examination
Get Radiology Tree app to read full this article<
Image Interpretation
Get Radiology Tree app to read full this article<
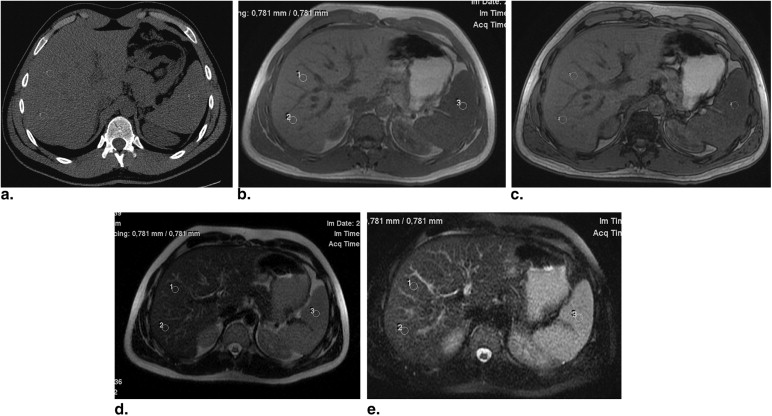
Table 1
Imaging Biomarkers for Liver Fat Estimation
Unenhanced CT methods CT L = hepatic attenuation values in Hounsfield unit CT L/S = hepatic-to-splenic attenuation ratio CT L−S = difference between hepatic and splenic attenuation MRI methods T1W IP/OP GRE sequences IP/OP FSF = (L SI (IP) − L SI (OP))/L SI (IP) × 100 IP/OP FSF(spl) = (L SI (IP)/S SI (IP)) − (L SI (OP)/S SI (OP))/(L SI (IP)/S SI (IP)) × 100 T2W±FS FSE sequences ±FS FSF = (L SI NFS − L SI FS)/L SI NFS × 100 ±FS FSF(spl) = (L SI NFS/S SI NFS) − (L SI FS/S SI FS)/(L SI NFS/S SI NFS) × 100
CT, computed tomography; FS, fat saturation; FSE, fast spin-echo; FSF, fat signal fraction; GRE, gradient-echo; IP, in-phase; L, liver; NFS, non–fat saturation; OP, opposed-phase; S = spleen, SI = signal intensity; T1W, T1-weighted; T2W, T2-weighted.
Get Radiology Tree app to read full this article<
Donor Biopsy and Histologic Assessment
Get Radiology Tree app to read full this article<
Statistical Analysis
Get Radiology Tree app to read full this article<
Get Radiology Tree app to read full this article<
Get Radiology Tree app to read full this article<
Get Radiology Tree app to read full this article<
Get Radiology Tree app to read full this article<
Results
Clinical and Histologic Findings
Get Radiology Tree app to read full this article<
Accuracy of CT and MRI in Diagnosing HS
Get Radiology Tree app to read full this article<
Table 2
The Area under the Receiver Operating Characteristic Curve and 95% Confidence Intervals for CT and MR Indices According to the Various Threshold Levels of Steatosis
Cutoff ∗ IP/OP FSF IP/OP FSF(Spl) ±FS FSF ±FS FSF(spl) CT L CT L/S CT L−S 5% (26) 0.765 (0.642–0.888) 0.760 (0.636–0.884) 0.739 (0.609–0.868) 0.861 (0.769–0.954) 0.812 (0.703–0.921) 0.757 (0.627–0.887) 0.758 (0.629–0.887) 10% (20) 0.856 (0.750–0.960) 0.854 (0.749–0.960) 0.828 (0.718–0.937) 0.939 (0.883–0.996) 0.866 (0.770–0.960) 0.810 (0.670–0.950) 0.806 (0.667–0.946) 15% (14) 0.952 (0.866–1.000) 0.919 (0.816–1.000) 0.898 (0.807–0.988) 0.930 (0.866–0.994) 0.938 (0.869–1.000) 0.842 (0.695–0.988) 0.837 (0.689–0.985) 20% (11) 0.983 (0.959–1.000) 0.969 (0.925–1.000) 0.917 (0.832–1.000) 0.935 (0.864–1.000) 0.967 (0.922–1.000) 0.868 (0.692–1.000) 0.865 (0.689–1.000) 25% (8) 0.998 (0.991–1.000) 1.000 (1.000–1.000) 0.899 (0.788–1.000) 0.940 (0.880–0.999) 0.988 (0.967–1.000) 0.952 (0.895–1.000) 0.950 (0.892–1.000) 30% (5) 0.993 (0.975–1.000) 0.978 (0.944–1.000) 0.960 (0.904–1.000) 0.920 (0.825–1.000) 1.000 (1.000–1.000) 0.949 (0.862–1.000) 0.944 (0.855–1.000)
CT, computed tomography; FS, fat saturation; FSE, fast spin-echo; FSF, fat signal fraction; IP, in-phase; L, liver; MR, magnetic resonance; OP, opposed-phase; S, spleen.
Get Radiology Tree app to read full this article<
Get Radiology Tree app to read full this article<
Get Radiology Tree app to read full this article<
Get Radiology Tree app to read full this article<
Get Radiology Tree app to read full this article<
Get Radiology Tree app to read full this article<
Get Radiology Tree app to read full this article<
Get Radiology Tree app to read full this article<
Get Radiology Tree app to read full this article<
Get Radiology Tree app to read full this article<
Get Radiology Tree app to read full this article<
Discussion
Get Radiology Tree app to read full this article<
Get Radiology Tree app to read full this article<
Get Radiology Tree app to read full this article<
Get Radiology Tree app to read full this article<
Get Radiology Tree app to read full this article<
References
1. Fan S.T., Lo C.M., Liu C.L., et. al.: Safety of donors in live donor liver transplantation using right lobe grafts. Arch Surg 2000; 135: pp. 336-340.
2. Brancatelli G.: Science to practice: should biopsy be performed in potential live donors when unenhanced CT shows an unacceptable degree of steatosis for transplantation?. Radiology 2006; 239: pp. 1-2.
3. Limanond P., Raman S.S., Lassman C., et. al.: Macrovesicular hepatic steatosis in living related liver donors: correlation between CT and histologic findings. Radiology 2004; 230: pp. 276-280.
4. Park S.H., Kim P.N., Kim K.W., et. al.: Macrovesicular hepatic steatosis in living liver donors: use of CT for quantitative and qualitative assessment. Radiology 2006; 239: pp. 105-112.
5. Rinella M.E., McCarthy R., Thakrar K., et. al.: Dual-echo, chemical shift gradient-echo magnetic resonance imaging to quantify hepatic steatosis: implications for living liver donation. Liver Transplant 2003; 9: pp. 851-856.
6. Kim S.H., Lee J.M., Han J.K., et. al.: Hepatic macrosteatosis: predicting appropriateness of liver donation by using MR imaging—correlation with histopathologic findings. Radiology 2006; 240: pp. 116-129.
7. Yamashiki N., Sugawara Y., Tamura S., et. al.: Noninvasive estimation of hepatic steatosis in living liver donors: usefulness of visceral fat area measurement. Transplantation 2009; 88: pp. 575-581.
8. Kim D.Y., Park S.H., Lee S.S., et. al.: Contrast-enhanced computed tomography for the diagnosis of fatty liver: prospective study with same-day biopsy used as the reference standard. Eur Radiol 2010; 20: pp. 359-366.
9. Yoshimitsu K., Kuroda Y., Nakamuta M., et. al.: Noninvasive estimation of hepatic steatosis using plain CT vs. chemical-shift MR imaging: significance for living donors. J Magn Reson Imaging 2008; 28: pp. 678-684.
10. Lee S.S., Park S.H., Kim H.J., et. al.: Non-invasive assessment of hepatic steatosis: prospective comparison of the accuracy of imaging examinations. J Hepatol 2010; 52: pp. 579-585.
11. Qayyum A., Goh J.S., Kakar S., et. al.: Accuracy of liver fat quantification at MR imaging: comparison of out-of-phase gradient-echo and fat-saturated fast spin-echo techniques—initial experience. Radiology 2005; 237: pp. 507-511.
12. Minervini M.I., Ruppert K., Fontes P., et. al.: Liver biopsy findings from healthy potential living liver donors: reasons for disqualification, silent diseases and correlation with liver injury tests. J Hepatol 2009; 50: pp. 501-510.
13. Ma X., Holalkere N.S., Kambadakone R.A., et. al.: Imaging-based quantification of hepatic fat: methods and clinical applications. Radiographics 2009; 29: pp. 1253-1277.
14. McPherson S., Jonsson J.R., Cowin G.J., et. al.: Magnetic resonance imaging and spectroscopy accurately estimate the severity of steatosis provided the stage of fibrosis is considered. J Hepatol 2009; 51: pp. 389-397.
15. DeLong E.R., DeLong D.M., Clarke-Pearson D.L.: Comparing the areas under two or more correlated receiver operating characteristic curves: a nonparametric approach. Biometrics 1988; 44: pp. 837-845.
16. Saadeh S., Younossi Z.M., Remer E.M., et. al.: The utility of radiological imaging in nonalcoholic fatty liver disease. Gastroenterology 2002; 123: pp. 745-750.
17. Cho C.S., Curran S., Schwartz L.H., et. al.: Preoperative radiographic assessment of hepatic steatosis with histologic correlation. J Am Coll Surg 2008; 206: pp. 480-488.
18. Bahl M., Qayyum A., Westphalen A.C., et. al.: Liver steatosis: investigation of opposed-phase T1-weighted liver MR signal intensity loss and visceral fat measurement as biomarkers. Radiology 2008; 249: pp. 160-166.
19. Bohte A.E., van Werven J.R., Bipat S., et. al.: The diagnostic accuracy of US, CT, MRI and 1H-MRS for the evaluation of hepatic steatosis compared with liver biopsy: a meta-analysis. Eur Radiol 2011; 21: pp. 87-97.
20. Kodama Y., Ng C.S., Wu T.T., et. al.: Comparison of CT methods for determining the fat content of the liver. Am J Roentgenol 2007; 188: pp. 1307-1312.
21. McCormack L., Clavien P.A.: Understanding the meaning of fat in the liver. Liver Transpl 2005; 11: pp. 137-139.
22. Cho J.Y., Suh K.S., Kwon C.H., et. al.: The hepatic regeneration power of mild steatotic grafts is not impaired in living-donor liver transplantation. Liver Transpl 2005; 11: pp. 210-217.
23. Baccarani U., Adani G.L., Isola M., et. al.: Steatosis of the graft is a risk factor for posttransplantation biliary complications. Transplant Proc 2009; 41: pp. 1313-1315.
24. Guiu Bw, Loffroy R., Ben Salem D., et. al.: Liver steatosis and in-phase/opposed-phase MR imaging: theory and clinical applications at 3T. J Rad 2007; 88: pp. 1845-1853.
25. Marsman W.A., Wiesner R.H., Rodriguez L., et. al.: Use of fatty donor liver is associated with diminished early patient and graft survival. Transplantation 1996; 62: pp. 1246-1251.
26. McCormack L., Petrowsky H., Jochum W., et. al.: Hepatic steatosis is a risk factor for postoperative complications after major hepatectomy: a matched case-control study. Ann Surg 2007; 245: pp. 923-930.
27. Iwasaki M., Takada Y., Hayashi M., et. al.: Noninvasive evaluation of graft steatosis in living donor liver transplantation. Transplantation 2004; 78: pp. 1501-1505.
28. Lee S.W., Park S.H., Kim K.W., et. al.: Unenhanced CT for assessment of macrovesicular hepatic steatosis in living liver donors: comparison of visual grading with liver attenuation index. Radiology 2007; 244: pp. 479-485.
29. Szczepaniak L.S., Babcock E.E., Schick F., et. al.: Measurement of intracellular triglyceride stores by H spectroscopy: validation in vivo. Am J Physiol 1999; 276: pp. 977-989.
30. Szczepaniak L.S., Nurenberg P., Leonard D., et. al.: Magnetic resonance spectroscopy to measure hepatic triglyceride content: prevalence of hepatic steatosis in the general population. Am J Physiol Endocrinol Metab 2005; 288: pp. 462-468.
31. Guiu B., Petit J.M., Loffroy R., et. al.: Quantification of liver fat content: comparison of triple-echo chemical shift gradient-echo imaging and in vivo proton MR spectroscopy. Radiology 2009; 250: pp. 95-102.
32. Cassidy F.H., Yokoo T., Aganovic L., et. al.: Fatty liver disease: MR imaging techniques for the detection and quantification of liver steatosis. Radiographics 2009; 29: pp. 231-260.