
Rationale and Objectives
Quantitative measurement of renal perfusion in murine models provides important information on the organ physiology and disease states. The 1-T desktop magnetic resonance imaging has a small footprint and a self-contained fringe field. This resultant flexibility in siting makes the system ideal for preclinical imaging research. Our objective was to evaluate the capability of the 1-T desktop magnetic resonance imaging to measure mouse renal perfusion without the administration of exogenous contrast agents.
Materials and Methods
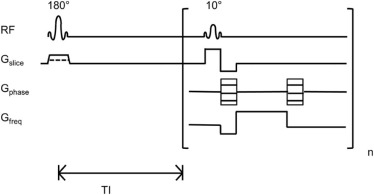
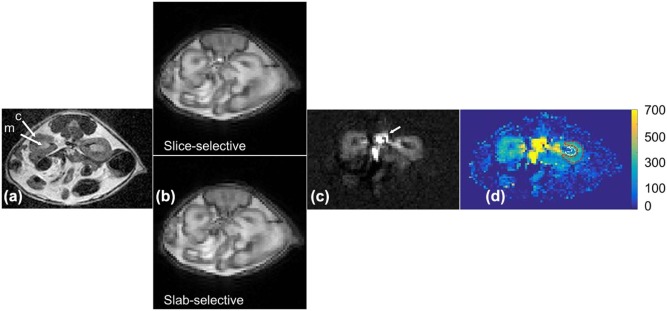
We implemented a flow-sensitive alternating inversion recovery (FAIR)-based arterial spin labeling sequence with a mouse volume coil on a 1-T desktop magnetic resonance scanner. The validity of the implementation was tested by comparing obtained renal perfusion results with literature values for normal mice and challenging the technique with mice treated with furosemide, a blood vessel vasoconstrictor drug.
Results
The measured cortical and medullary perfusions were quantified to be 402 ± 95 and 184 ± 52 mL/100 g/min, respectively, in agreement with literature values. The ratio of cortical to medullary renal blood flow was between 2 and 3 and was independent of the mouse weight. As expected, upon furosemide injection, a decrease (~50%) in cortical perfusion was observed in the mice population, at 1 hour post injection compared to baseline ( P < 0.0001), which returned to baseline after 24 hours ( P = 0.68).
Conclusions
We reported the successful application of FAIR-based arterial spin labeling for noncontrast perfusion measurement of mouse kidneys using a 1-T desktop scanner. The easy implementation of FAIR sequence on a 1-T desktop scanner offers the potential for longitudinal perfusion studies in limited access areas such as behind the barrier in mouse facilities and in multimodality preclinical imaging laboratories without the administration of exogenous contrast agents.
Introduction
The quantitative measurement of renal perfusion in murine models is important in preclinical research to assess both renal function and the effects of antiangiogenic therapies in models of renal cancer. Perfusion measurement gives information regarding organ performance, disease state, and understanding of inter- and intratumoral metabolic heterogeneity . Tumor blood flow has also been suggested as a predictive parameter in assessing the effects of the treatment of tumors with antiangiogenic therapy . Imaging techniques that are based on radioactive tracers like positron emission tomography (PET) and single-photon emission computed tomography have been used to assess perfusion. However, applications of these techniques, particularly for longitudinal monitoring of disease progression or treatment to response, are limited due to radiation exposure and invasiveness. A magnetic resonance imaging (MRI) technique using dynamic contrast enhancement provides high–spatial resolution perfusion study but requires the injection of a gadolinium (Gd)-based contrast agent. Reports of a link between the administration of Gd-based contrast agents and nephrogenic systemic fibrosis , along with recent studies on Gd deposition in the brain , do not make contrast-enhanced MRI ideal for perfusion imaging. Noninvasive perfusion MRI techniques will therefore logically gain importance in multiparametric MRI methods in cancer research.
Arterial spin labeled (ASL) MRI is a noninvasive technique that has been used to measure noncontrast perfusion . ASL uses radiofrequency pulses and magnetic field gradients to label the inflowing spins of blood water molecules and measures their accumulation in the tissue of interest. ASL MRI can be broadly classified into two categories: pulsed ASL and continuous ASL. Continuous ASL can provide a higher signal-to-noise ratio (SNR) but requires external hardware that can be challenging to implement on standard scanners. Recent developments such as pseudocontinuous ASL can be performed on standard scanners without the need for additional hardware , but this technique requires a specific location to label the inflowing blood, which can be difficult to achieve in small animal imaging . Alternatively, the pulsed ASL technique using flow-sensitive alternating inversion recovery (FAIR) globally inverts all the blood spins outside the imaging slab, avoiding the challenges with labeling location, and is easy to implement on standard scanners for small animal imaging .
Get Radiology Tree app to read full this article<
Get Radiology Tree app to read full this article<
Materials and Methods
Experimental Design
Get Radiology Tree app to read full this article<
Get Radiology Tree app to read full this article<
FAIR Imaging Protocol
Get Radiology Tree app to read full this article<
Get Radiology Tree app to read full this article<
Get Radiology Tree app to read full this article<
Flow Quantification
Get Radiology Tree app to read full this article<
RBF=λ(SSel−Snonsel)2α∗TI∗SrefeTIT1 R
B
F
=
λ
(
S
S
e
l
−
S
nonsel
)
2
α
∗
T
I
∗
S
r
e
f
e
T
I
T
1
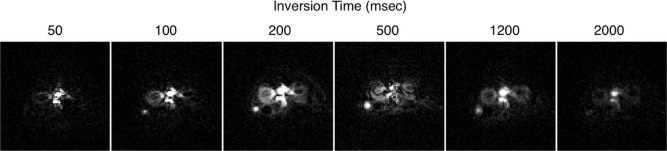
where λ is the tissue-blood partition coefficient, assumed to be 1.0 mL/g ; S is the signal for nonselective ( S nonsel ) and selective ( S sel ) ASL images, and the reference proton density image ( S ref ); TI is the inversion time (1.2 seconds); T 1 is the longitudinal relaxation time of blood, assumed to be 1.4 seconds at 1 T ; and α is the inversion efficiency, assumed to be 1.0 .
Get Radiology Tree app to read full this article<
Image Analysis
Get Radiology Tree app to read full this article<
Results
Get Radiology Tree app to read full this article<
Get Radiology Tree app to read full this article<
Get Radiology Tree app to read full this article<
Get Radiology Tree app to read full this article<
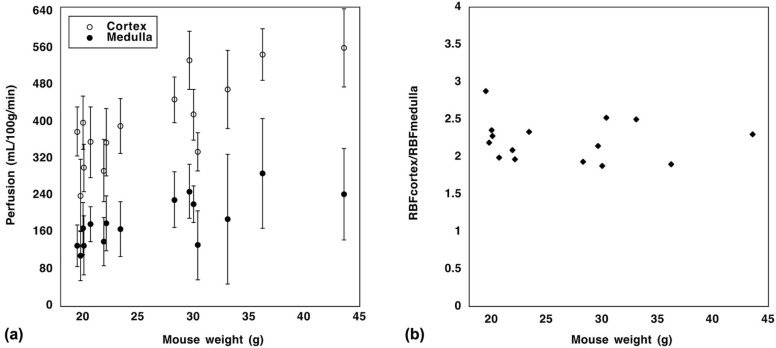
TABLE 1
Means and Standard Deviations of Cortical and Medullary Blood Flow of Group 1 Mice, Measured Using the Flow-sensitive Alternating Inversion Recovery-Arterial Spin Labeling Technique on a 1-T Desktop Magnetic Resonance Scanner
Mouse Weight (g) Medullary Perfusion (mL/100 g/min) Cortical Perfusion (mL/100 g/min) 19.8 110 ± 54 241 ± 78 20.1 132 ± 64 301 ± 52 20.7 179 ± 38 357 ± 77 21.9 141 ± 53 295 ± 68 22.1 181 ± 60 356 ± 73 23.4 168 ± 59 392 ± 60 30.4 133 ± 75 336 ± 42 33.1 189 ± 141 472 ± 85 36.2 289 ± 119 548 ± 56 43.6 244 ± 100 561 ± 85 20.0 169 ± 57 399 ± 58 19.5 132 ± 45 380 ± 54 28.3 232 ± 60 449 ± 50 30.0 222 ± 40 417 ± 55 29.6 250 ± 58 535 ± 63
Get Radiology Tree app to read full this article<
Get Radiology Tree app to read full this article<
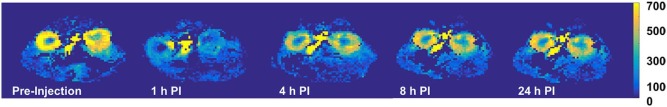
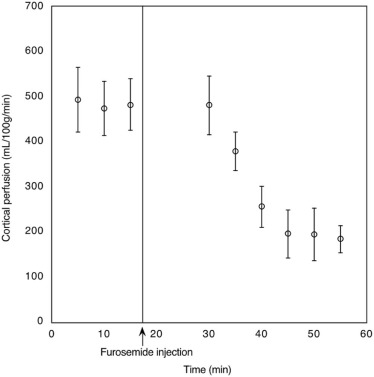
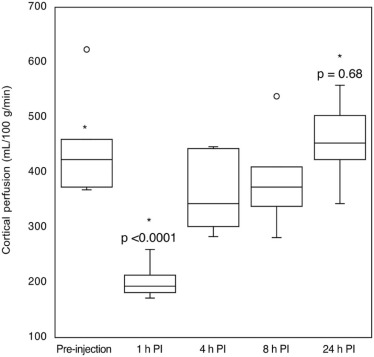
TABLE 2
Means and Standard Deviations of Cortical Blood Flow (mL/100 g/min) of Group 2 Mice, Before (Preinjection) and After Treatment with Furosemide (1, 4, 8, and 24 hours PI)
Mouse Weight (g) Preinjection 1 h PI 4 h PI 8 h PI 24 h PI 28.0 \* 486 ± 54 161 ± 41 — — — 26.2 \* 131 ± 35 109 ± 32 — — — 27.3 \* 349 ± 71 103 ± 24 — — — 34.0 \* 414 ± 71 168 ± 35 — — — 27.3 \* 220 ± 54 147 ± 38 — — — 26.9 \* 331 ± 49 179 ± 62 — — — 41.6 446 ± 72 191 ± 75 334 ± 50 338 ± 35 503 ± 81 20.0 400 ± 66 182 ± 53 302 ± 90 364 ± 58 344 ± 41 19.5 368 ± 70 172 ± 63 283 ± 37 281 ± 67 446 ± 71 28.3 373 ± 44 260 ± 84 447 ± 84 384 ± 58 424 ± 41 30.0 460 ± 93 196 ± 61 352 ± 73 410 ± 72 461 ± 54 29.6 624 ± 88 214 ± 46 444 ± 61 539 ± 55 558 ± 68
PI, post injection.
Get Radiology Tree app to read full this article<
Get Radiology Tree app to read full this article<
Get Radiology Tree app to read full this article<
Discussion
Get Radiology Tree app to read full this article<
Get Radiology Tree app to read full this article<
Get Radiology Tree app to read full this article<
Get Radiology Tree app to read full this article<
Get Radiology Tree app to read full this article<
Conclusions
Get Radiology Tree app to read full this article<
Get Radiology Tree app to read full this article<
References
1. Hensley C.T., Faubert B., Yuan Q., et. al.: Metabolic heterogeneity in human lung tumors. Cell 2016; 164: pp. 681-694.
2. Essock-Burns E., Lupo J.M., Cha S., et. al.: Assessment of perfusion MRI-derived parameters in evaluating and predicting response to antiangiogenic therapy in patients with newly diagnosed glioblastoma. Neuro Oncol 2011; 13: pp. 119-131.
3. Thomsen H.S., Morcos S.K., Almén T., et. al.: Nephrogenic systemic fibrosis and gadolinium-based contrast media: updated ESUR Contrast Medium Safety Committee guidelines. Eur Radiol 2013; 23: pp. 307-318.
4. Sherry A.D., Caravan P., Lenkinski R.E.: Primer on gadolinium chemistry. J Magn Reson Imaging 2009; 30: pp. 1240-1248.
5. McDonald R.J., McDonald J.S., Kallmes D.F., et. al.: Intracranial gadolinium deposition after contrast-enhanced MR imaging. Radiology 2015; 275: pp. 772-782.
6. Kanda T., Fukusato T., Matsuda M., et. al.: Gadolinium-based contrast agent accumulates in the brain even in subjects without severe renal dysfunction: evaluation of autopsy brain specimens with inductively coupled plasma mass spectroscopy. Radiology 2015; 276: pp. 228-232.
7. Monet P., Franc J., Brasseur A., et. al.: Arterial spin labeling: state of the art. J Radiol 2009; 90: pp. 1031-1037.
8. Dai W., Garcia D., de Bazelaire C., et. al.: Continuous flow-driven inversion for arterial spin labeling using pulsed radio frequency and gradient fields. Magn Reson Med 2008; 60: pp. 1488-1497.
9. Duhamel G., Prevost V., Girard O.M., et. al.: High-resolution mouse kidney perfusion imaging by pseudo-continuous arterial spin labeling at 11.75T. Magn Reson Med 2014; 71: pp. 1186-1196.
10. Leithner C., Gertz K., Schröck H., et. al.: A flow sensitive alternating inversion recovery (FAIR)-MRI protocol to measure hemispheric cerebral blood flow in a mouse stroke model. Exp Neurol 2008; 210: pp. 118-127.
11. Tibiletti M., Bianchi A., Stiller D., et. al.: Pulmonary perfusion quantification with flow-sensitive inversion recovery (FAIR) UTE MRI in small animal imaging. NMR Biomed 2016; 29: pp. 1791-1799.
12. Rajendran R., Lew S.K., Yong C.X., et. al.: Quantitative mouse renal perfusion using arterial spin labeling. NMR Biomed 2013; 26: pp. 1225-1232.
13. Wang J., Zhang Y., Yang X., et. al.: Hemodynamic effects of furosemide on renal perfusion as evaluated by ASL-MRI. Acad Radiol 2012; 19: pp. 1194-1200.
14. Alsop D.C., Detre J.A.: Reduced transit-time sensitivity in noninvasive magnetic resonance imaging of human cerebral blood flow. J Cereb Blood Flow Metab 1996; 16: pp. 1236-1249.
15. De Bazelaire C., Rofsky N.M., Duhamel G., et. al.: Arterial spin labeling blood flow magnetic resonance imaging for the characterization of metastatic renal cell carcinoma. Acad Radiol 2005; 12: pp. 347-357.
16. Schor-Bardach R., Alsop D.C., Pedrosa I., et. al.: Does arterial spin-labeling MR Imaging-measured tumor perfusion correlate with renal cell cancer response to antiangiogenic therapy in a mouse model?. Radiology 2009; 251: pp. 731-742.
17. Zhang X., Petersen E.T., Ghariq E., et. al.: In vivo blood T-1 measurements at 1.5 T, 3 T, and 7 T. Magn Reson Med 2013; 70: pp. 1082-1086.